
Cassandra's performance can be affected by any of the following:
- I/O contention between reads and writes (pending compactions)
- Frequent GC pauses
- Disk failures
- Network misbehaviors
- Threads and CPU contention
I would like to emphasize that a dead node in production is better than a slow node, and it is increasingly hard to identify a slow node that is to be replaced. This chapter will try to explain the tools and methods that can be implemented to identify the performance bottlenecks and take action on them or to tune your cluster for them.
In the past few releases, Cassandra has taken a lot of steps to simplify troubleshooting performance problems as well as improve the tooling around it. The Cassandra community has increasingly added features and improvements that can allow mixed workloads without any problems. Performance tuning depends on the types of operations your cluster performs most frequently and the type of queries performed on the data. I would like to talk about the various tools available in Linux before we start talking about performance tuning in Cassandra. It is really important as an administrator to constantly monitor system performance rather than monitor it only while tuning.
Let's start the chapter with an introduction to the following tools; these metrics can also be easily monitored regularly using most of the basic monitoring solutions. While reading this section, it will be nice if you could run the commands/tools on a test machine to get the context.
vmstat reports information about processes, memory, paging, block I/O, traps, and CPU activity. When executed for the first time, the first line of the program returns the average since the machine was booted. This information is usually useless, hence it is recommended to run it in a loop (for example, the command vmstat 6 9 prints the metrics 9 times in an interval of 6 seconds).
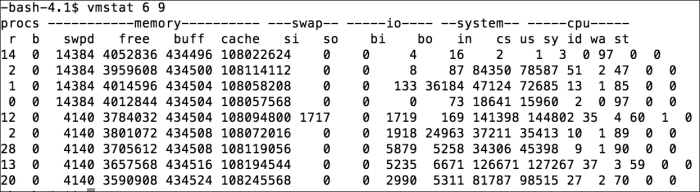
The elements of the preceding command line are elaborated in the following table:
|
Column |
Description |
|---|---|
|
|
Amount of memory used as buffer |
|
|
Amount of memory used as cache |
|
|
Blocks received and sent to the disks |
|
|
Interrupts and context switches |
|
|
Time spent running non-kernel code |
|
|
Time spent running kernel code and the time stolen by a virtual machine |