
Garbage collection is the process of removing dead objects from the heap, allowing new Java objects to be created in the JVM heap memory. Garbage collection helps the JVM reclaim heap space/memory allocated by the threads processing read and write operations that are no longer needed. This process is performed by a set of threads that constantly clears and compacts memory for efficient memory management. Even though there are a lot of hurdles to overcome before getting the right GC settings, any decent-sized application written in any language has to deal with memory fragmentation. JVM's GC is implemented in a generic, well-understood manner, and has enough parameters to tune and make it efficient for high-performance applications.
Most new users are tempted to increase the heap size, thinking it will improve performance. In most cases, increasing the Java heap size is actually a bad idea, because JVM then has more memory to manage and has to frequently compact the memory locations, in turn increasing the CPU usage and causing larger stop-the-world GC pauses. In some cases, where the object allocation is slower, JVM doesn't have any incentive to keep compacting its heap, as there is more space available. GC will try to wait till it is x% full, but sometimes that might get too late to be able to catch up, in turn causing longer pauses/stop-the-world scenarios.
Cassandra also logs GC log information about garbage collection whenever garbage collection takes longer than 200 ms. If you start to notice a log message about the garbage collections occurring frequently and taking a moderate length of time to complete, it is a good indication that we need to start tuning the garbage collectors.
It is better to give most of the system's memory to the OS than allocating it to the JVM. Most operating systems maintain the page cache for frequently accessed data and are very good at keeping it in memory. In addition, we have to give enough memory to the JVM to cache its object creation. It is also worth noting that Cassandra also uses off-heap memory (more than what is configured in cassandra-env.sh) to store some of the data structures (such as offheap, bloomfilter, indexsummaries, and so on). Currently, Cassandra ships with Concurrent Mark Sweep (CMS) collector settings for its old-generation garbage collection, but this may change in future releases. We will cover CMS more than any other collector in this chapter.
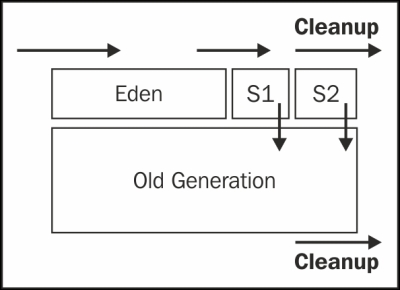
CMS GC behavior looks similar to the following diagram; the objects are first created in Eden and eventually promoted to survivor spaces. During every promotion, the JVM will expire the objects that are not needed. Eventually, the objects that survive will be promoted to the old generation. If the threads try to create any object larger than the space available for the generations allocated, it will be created directly in Old Generation:
It is strongly recommended to enable GC logging during performance tests; most users enable GC logging in production to better understand GC behavior when needed (GC logging has a very low overhead). Enabling the following in the cassandra-env.sh file can enable the required GC logging:
JVM_OPTS="$JVM_OPTS -XX:+PrintGCDetails"
JVM_OPTS="$JVM_OPTS -XX:+PrintGCDateStamps"
JVM_OPTS="$JVM_OPTS -XX:+PrintHeapAtGC"
JVM_OPTS="$JVM_OPTS -XX:+PrintTenuringDistribution"
JVM_OPTS="$JVM_OPTS -XX:+PrintGCApplicationStoppedTime"
JVM_OPTS="$JVM_OPTS -XX:+PrintPromotionFailure"
JVM_OPTS="$JVM_OPTS -XX:PrintFLSStatistics=1"
JVM_OPTS="$JVM_OPTS -Xloggc:/var/log/cassandra/gc-`date +%s`.log"
You can get more detailed information on how to interpret CMS by looking at all the numerous articles online; I recommend you visit https://blogs.oracle.com/poonam/entry/understanding_cms_gc_logs.
Let's start by examining some examples with explanations:
[GC 39.910: [ParNew: 261760K->0K(261952K), 0.2314667 secs] 262017K->26386K(1048384K), 0.2318679 secs]
The young generation collection's capacity was 261952K, and after the collection, its occupancy drops down to 0:
[GC40.704: [Rescan (parallel) , 0.1790103 secs]40.883: [weak refs processing, 0.0100966 secs] [1 CMS-remark: 26386K(786432K)] 52644K(1048384K), 0.1897792 secs]
Stop-the-world GC is unavoidable most of the times, but we can make sure the full GC is not a major load on the system and can complete within a few milliseconds. A dynamic snitch usually tries to redirect traffic when it notices a non-responsive node. Consider the following commands:
[GC 197.976: [ParNew: 260872K->260872K(261952K), 0.0000688 secs]197.976: [CMS197.981: [CMS-concurrent-sweep: 0.516/0.531 secs]
(concurrent mode failure): 402978K->248977K(786432K), 2.3728734 secs] 663850K->248977K(1048384K), 2.3733725 secs]
This shows that a ParNew collection started, but was not able to complete because there was not enough space in the CMS generation to promote the object to the surviving young generation. Due to this, the concurrent mode of CMS was interrupted and a full GC was performed. Usually, when you see this, you might want to look if the Cassandra query is pulling a lot of data into memory; to get around this problem, you might want to increase the new size, increase the tenured generation size, or initiate the CMS collection at lesser heap occupancy by setting
CMSInitiatingOccupancyFraction
to a lower value.
The jstat tool displays performance statistics for an instrumented HotSpot JVM; complete information on the options available can be viewed at http://docs.oracle.com/javase/6/docs/technotes/tools/share/jstat.html. The jstat tool is useful for understanding GC promotions and how much memory is utilized overall as well as the frequency of full GC.
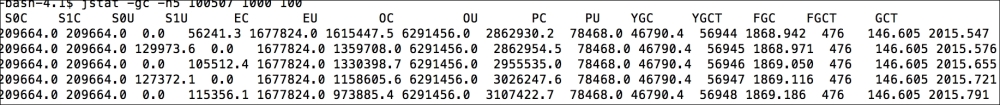
As described in the earlier section, these numbers represent the object sizes in each generation, and you can see the promotion activities using the following commands:
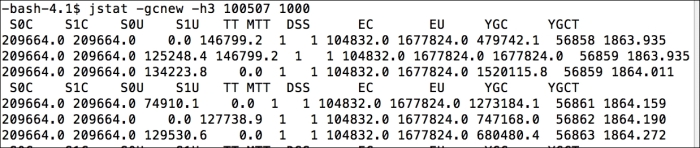
The following commands show how the objects are allocated and promoted; for a healthy VM, most objects will expire during promotions:
$ jstat -gc -h5 18753 1000 100
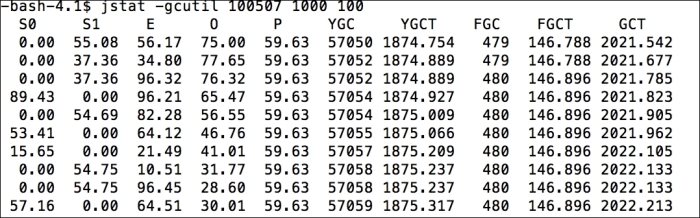
$ jstat -gcutil 18753 1000 100
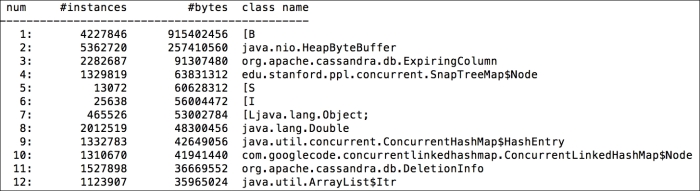
The jmap tool can be used to understand the types of objects that are currently occupying the memory. If you detect a memory leak, it might be worth taking a heap dump for analysis. jmap can be used for a cheap analysis of memory utilization as shown in the following command line snippet:
$ jmap -histo:live 18753
To get the right settings and tuning in place, it is very important for the users to test real-world scenarios. To achieve this, Cassandra supports the write survey mode without responding back to the read traffic. The user can change and tune write traffic, compaction, and compression strategies, and these can be compared with the rest of the cluster. Using the write survey mode, users can experiment with different strategies and benchmark compaction, write performance, and so on. They can also note all the differences in tuning without affecting production workload. It is worth noting that in the write survey mode, read traffic cannot be tested. To enable write survey mode, start a Cassandra node with -Dcassandra.write_survey=true
appended to the start up script.