Visualizing data is as important as processing it. The human brain perceives pictures faster than reading data in tables, and because of this, data visualization provides super fast understanding of large amount of data in split seconds. Reports, charts, interactive dashboards, and any form of infographics are all part of data visualization and provide deeper understanding of results.
To connect with third-party applications, Cloudera provides ODBC and JDBC connectors. These connectors are installed on machines where third-party applications are running, and by configuring the correct Impala server and port details on those connectors, third-party applications connect with Impala, submit those queries, and then take results back to the application. The result is then displayed on third-party applications, where it is rendered on a graphics device for visualization, displayed in a table format, or further processed depending on the application requirement. In this section, we will cover a few notable third-party applications, which can take advantage of Impala's super fast query processing and then display amazing graphical results.
Tableau Software supports Impala by providing access to tables on Impala using the Impala ODBC connector provided by Tableau. Tableau is one of the most prominent data visualization software technologies in recent days and is used by thousands of enterprises daily to get intelligence out of their data. Tableau is available for Windows OS, and an ODBC connector is provided by Cloudera to make this connection a reality. You can visit the following link to download the Impala connector for Tableau:
http://go.cloudera.com/tableau_connector_download
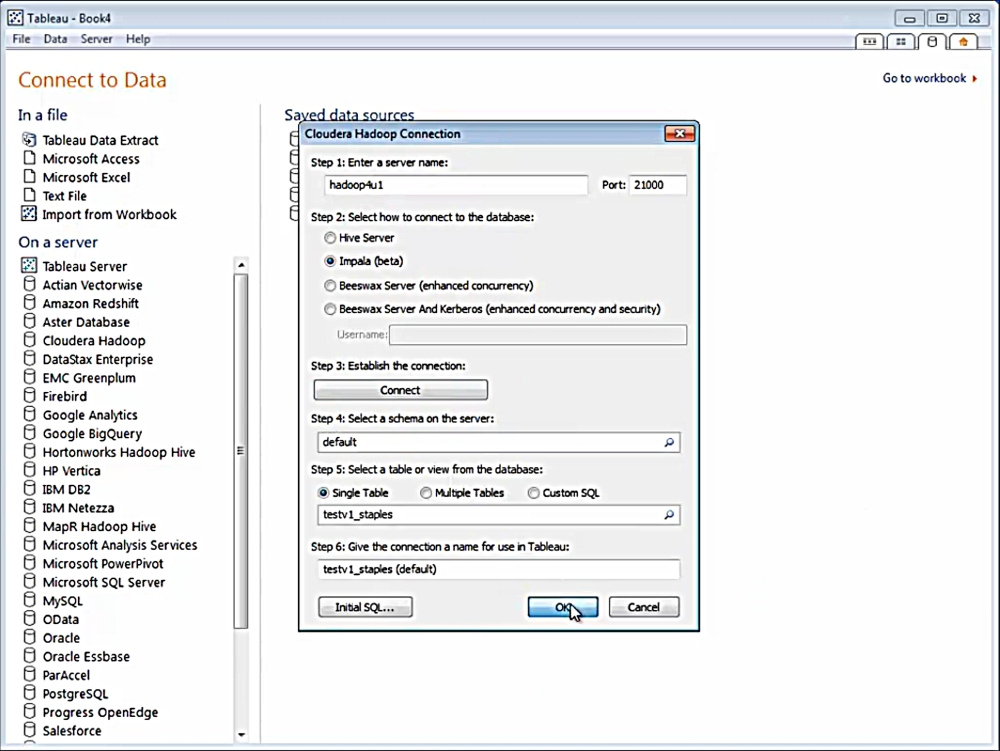
Once the Impala connector is installed on a machine where the Tableau software is running and configured correctly, Tableau is ready to work with Impala. In the following screenshot, Tableau is connected to an Impala server at port 21000 and then a table located in Impala is selected:
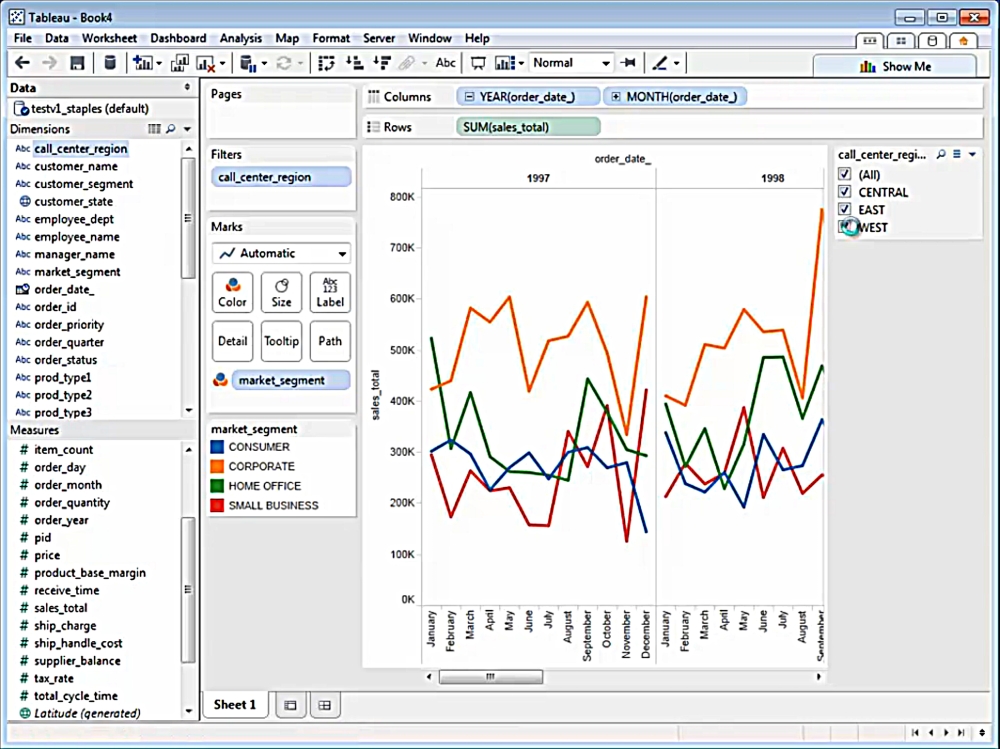
Once a table is selected, particular fields are selected, and the data is displayed in a graphical format in various mind-blowing visualizations. The following screenshot displays one example showing such a visualization:
Microsoft Excel is one of the most widely adopted data processing applications used by business professionals worldwide. You can connect Microsoft Excel with Impala using another ODBC connector provided by Simba Technology. You can download the connector from their website at the following URL:
http://www.simba.com/data-connections
Microsoft OLE DB for OLAP, also known as ODBO, defines multidimensional expressions, or MDX, that are used as a query language to report multi-dimensional data stores. Most of the OLAP servers support interaction through MDX queries by Business Intelligence applications and many other third-party applications. MDX provides flexibility and multidimensional functionality to answer real-world business questions asked by Business Intelligence applications.
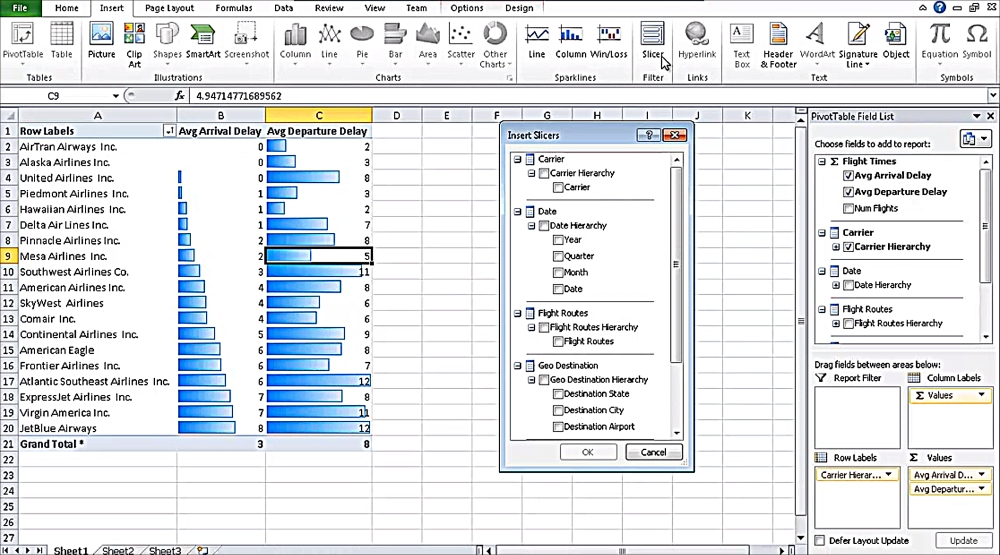
Business users can use Simba MDX Provider to connect to Cloudera Impala tables from Microsoft Excel PivotTables, by just installing the driver and configuring it correctly to access Cloudera Impala. In the following screenshot, Microsoft Excel PivotTable is connected to Cloudera Impala using Simba MDX:
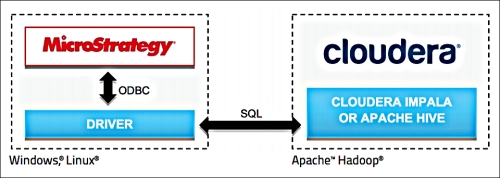
Microstrategy is another big player in data analysis and visualization software and uses an ODBC drive to connect to Impala to render amazing looking visualizations. The connectivity model between Microstrategy software and Cloudera Impala is shown as follows:
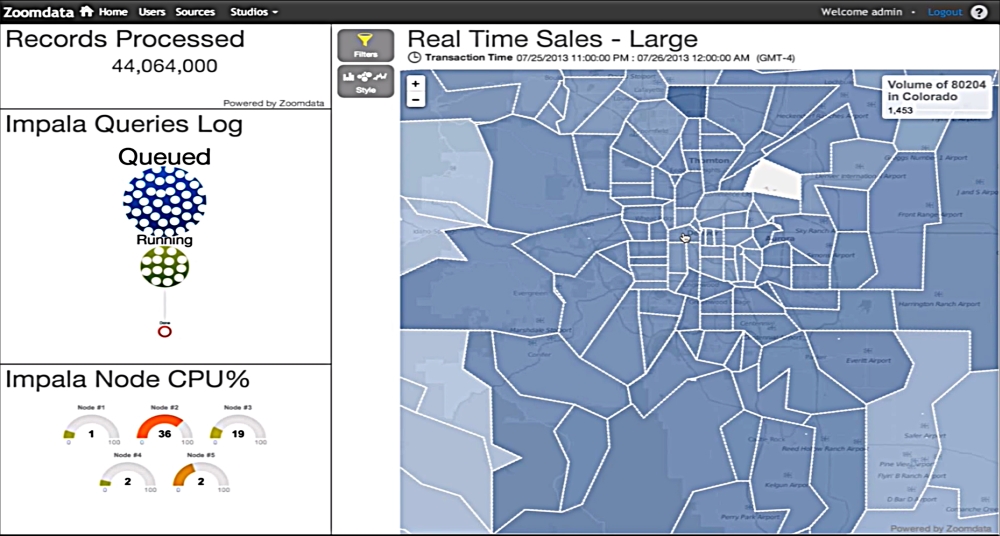
Zoomdata is considered to be the new generation of data user interfaces, as it addresses streams of data instead of sets of data. The Zoomdata processing engine performs continuous mathematical operations across data streams in real time to create visualizations on a multitude of devices. The visualization updates itself as new data arrives and is recomputed by Zoomdata.
As shown in in the following screenshot, you can see that the Zoomdata application uses Impala as a source of data, which is configured underneath to use of one of the available connectors to connect to Impala:
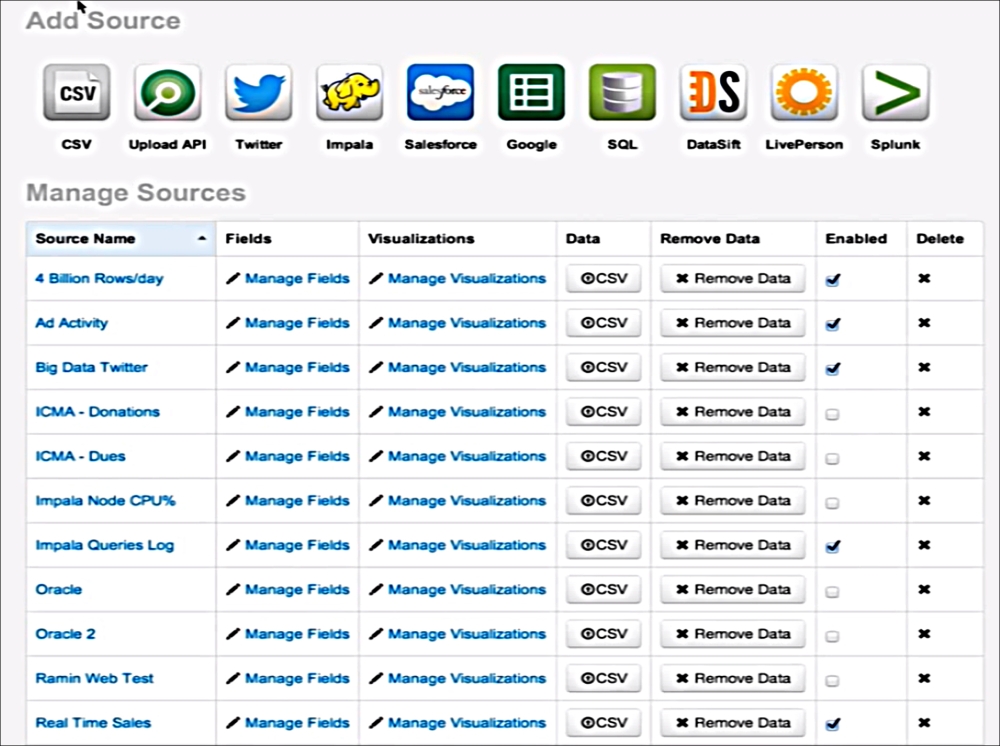
Once the connections are made, the user can see amazing data visualizations, as shown in the following screenshot: