By now, we should have an idea of what the series property does. In this section, we are going to examine it in more detail.
The series property is an array of series configuration objects that contain data- and series-specific options. It allows us to specify single-series data and multiple-series data. The purpose of series objects is to inform Highcharts of the format of the data and how the data is presented in the chart.
All data values in the chart are specified through the data field. The data field is highly flexible and can take an array in a number of forms, as follows:
- Numerical values
- An array with x and y values
- A point object with properties describing the data point
The first two options have already been examined in the Accessing the axis data type section. In this section, we will explore the third option. Let's use the single-series Nasdaq example and we will specify the series data through a mixture of numerical values and objects:
series: [{
name: 'Nasdaq',
pointStart: Date.UTC(2012, 4, 11, 9, 30),
pointInterval: 30 * 60 * 1000,
data: [{
// First data point
y: 2606.01,
marker: {
symbol: 'url(./sun.png)'
}
}, 2622.08, 2636.03, 2637.78,
{
// Highest data point
y: 2639.15,
dataLabels: {
enabled: true
},
marker: {
fillColor: '#33CC33',
radius: 5
}
}, 2637.09, 2633.38, 2632.23, 2632.33,
2632.59, 2630.34, 2626.89, 2624.59,
{
// Last data point
y: 2615.98,
marker: {
symbol: 'url(./moon.png)'
}
}]
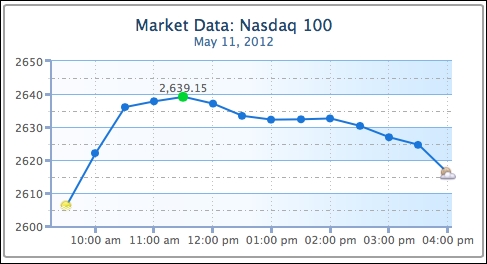
}]The first and last data points are objects that have y axis values and image files to indicate the opening and closing of the market. The highest data point is configured with a different color and data label. The size of the data point is also set slightly larger than the default. The rest of the data arrays are just numerical values, as shown in the following screenshot: