Tool tips in Highcharts are enabled by the tooltip.enabled Boolean option, which is true by default. In Highcharts 4, the default shape of the tooltip box has been changed to callout. The following shows the new style of tooltip:
For the older style of tooltip shape, we can set the tooltip.shape option to square, which we will use in the following exercises.
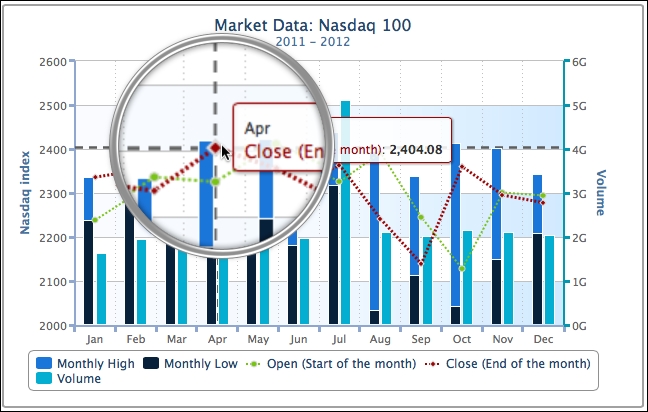
Tooltip's content formats are flexible, which can be defined via a callback handler or in the HTML style. We will continue from the example in the previous section. As the chart is packed with multiple lines and columns, we can first enable the crosshair tool tip to help us align the data points onto the axes. The crosshairs configuration can take either a Boolean value to activate the feature or an object style for the crosshair line style. The following is the code snippet to set up crosshairs with an array of x- and y-axis configurations for the gray color and dash line styles:
            tooltip : {
                shape: 'square',
                crosshairs: [{
                     color: '#5D5D5D',
                     dashStyle: 'dash',
                     width: 2
                }, {
                     color: '#5D5D5D',
                     dashStyle: 'dash',
                     width: 2
                }]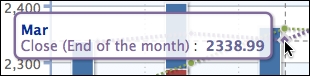
},The following screenshot shows the view when hovering over a data point in the market close series. We see a tool tip box appear next to the pointer and gray crosshairs for both axes:
Highcharts provides template options such as headerFormat, pointFormat, and footerFormat to construct the tool tip by specific template variables (or macros). These specific variables are series and point, and we can use their properties such as point.x, point.y, series.name, and series.color within the template. For instance, the default tool tip setting uses pointFormat, which has the default value of the following code snippet:
<span style="color:{series.color}">{series.name}</span>: <b>{point.y}</b><br/>Highcharts internally translates the preceding expression into SVG text markups, so only a subset of HTML syntax can be supported, which is <b>, <br>, <strong>, <em>, <i>, <span>, <href>, and font style attributes in CSS. However, if we want to have more flexibility in polishing the content, and the ability to include image files, we need to use the useHTML option for full HTML tool tips. This option allows us to do the following:
- Use other HTML tags such as
<img>inside the tool tip - Create a tool tip in real HTML content, so that it is outside the SVG markups
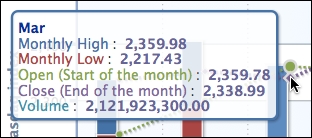
Here, we can format an HTML table inside a tool tip. We will use headerFormat to create a header column for the category and a bottom border to separate the header from the data. Then, we will use pointFormat to set up an icon image along with the series name and data. The image file is based on the series.index macro, so different series have different image icons. We use the series.color macro to highlight the series name with the same color in the chart and apply the series.data macro for the series value:
      tooltip : {
         useHTML: true,
         shape: 'square',
         headerFormat: '<table><thead><tr>' +
             '<th style="border-bottom: 2px solid #6678b1; color: #039" ' +
             'colspan=2 >{point.key}</th></tr></thead><tbody>',
         pointFormat: '<tr><td style="color: {series.color}">' +
             '<img src="./series_{series.index}.png" ' +
             'style="vertical-align:text-bottom; margin-right: 5px" >' +
             '{series.name}: </td><td style="text-align: right; color: #669;">' +
             '<b>{point.y}</b></td></tr>',
         footerFormat: '</tbody></table>'
      },
When we hover over a data point, the template variable point is substituted internally for the hovered point object, and the series is replaced by the series object containing the data point.
The following is the screenshot of the new tool tip. The icon next to the series name indicates market close:
Alternatively, we can implement the tool tip through the callback handler in JavaScript. The tool tip handler is declared through the formatter option. The major difference between template options and the handler is that we can disable the tool tip display for certain points by setting conditions and returning the Boolean to false, whereas for template options we cannot. In the callback example, we use the this.series and this.point variables for the series name and values for the data point that is hovered over.
The following is an example of the handler:
     formatter: function() {
          return '<span style="color:#039;font-weight:bold">' +
                 this.point.category +
                 '</span><br/><span style="color:' +
                 this.series.color + '">' + this.series.name +
                 '</span>: <span style="color:#669;font-weight:bold">' +
                 this.point.y + '</span>';
     }
The preceding handler code returns an SVG text tool tip with the series name, category, and value, as shown in the following screenshot:
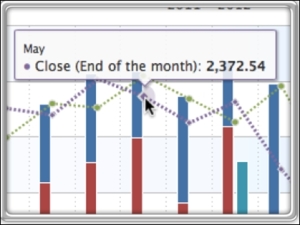
Another flexible tooltip feature is to allow all the series data to be displayed inside the same tooltip. This simplifies user interaction by looking up multiple series data in one action. To enable this feature, we need to set the shared option to true.
We will continue with the previous example for a multiple series tooltip. The following is the new tooltip code:
         shared: true,
         useHTML: true,
         shape: 'square',
         headerFormat: '<table><thead><tr><th colspan=2 >' +
                       '{point.key}</th></tr></thead><tbody>',pointFormat:  '<tr><td style="color: {series.color}">' +
                       '{series.name}: </td>' +
                       '<td style="text-align: right; color: #669;"> ' +
                       '<b>{point.y}</b></td></tr>',footerFormat: '</tbody></table>'
The preceding code snippet will produce the following screenshot:
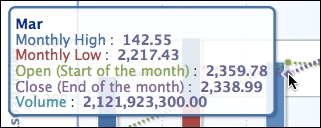
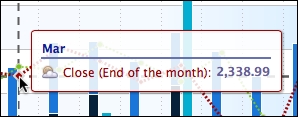
As previously discussed, we will use the monthly high and monthly low series to plot stacked columns that are actually used for plotting data within the same category. Therefore, the tooltip for the monthly high series is showing the subtracted values that we previously put in. To correct this within the tooltip, we can use the handler to apply different properties for the monthly high series, as follows:
   shared: true,
   shape: 'square',
   formatter: function() {
       return '<span style="color:#039;font-weight:bold">' +
           this.x + '</span><br/>' +
           this.points.map(function(point, idx) {return '<span style="color:' + point.series.color +
                   '">' + point.series.name +
                   '</span>: <span style="color:#669;font-weight:bold">' +
                     Highcharts.numberFormat((idx == 0) ? point.total : point.y) + '</span>';}).join('<br/>'),
       }
point.total is the total of the difference and the monthly low series value. The following screenshot shows the new corrected monthly high value: