Highcharts not only supports single color values, but also allows complex color gradient definitions. In Highcharts, the color gradient is based on the SVG linear color gradient standard, which is composed of two sets of information as follows:
linearGradient: This gives a gradient direction for a color spectrum made up of two sets of x and y coordinates; ratio values are between 0 and 1, or in percentagesstops: This gives a sequence of colors to be filled in the spectrum, and their ratio positions within the gradient direction
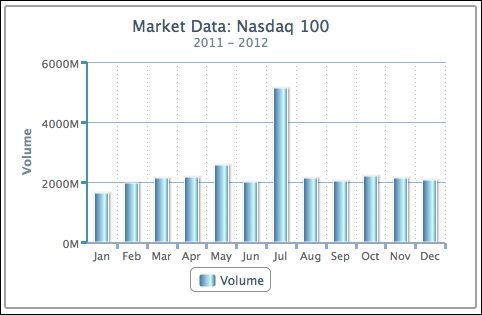
We can use the previous stock market example with only the volume series, and redefine yAxis alternateGridColor as follows:
       yAxis: [{
            title: { text: 'Nasdaq index' },
            ....

            alternateGridColor: {
                linearGradient: [ 10, 250, 400, 250 ],
                    stops: [
                           [ 0, 'red' ],
                        [ 0.2, 'orange' ],
                        [ 0.5, 'yellow' ] ,
                        [ 0.8, 'green' ] ,
                        [ 1, 'lime' ] ]
            }
linearGradient is an array of coordinate values that are arranged in the x1, y1, x2, y2 order. The values can be absolute coordinates, percentage strings, or ratio values between 0 and 1. The difference is that colors defined in coordinate values can be affected by the chart size, whereas percentage and ratio values avoid that.
The stops property has an array of tuples: the first value is the offset ranging from 0 to 1 and the second value is the color definition. The offset and color values define where the color is positioned within the spectrum. For example, [0, 'red' ] and [0.2, 'orange' ] mean starting with red at the beginning and gradually changing the color to orange in a horizontal direction towards the position at x = 80 (0.2 * 400), before changing from orange at x = 80 to yellow at x = 200, and so on. The following is a screenshot of the multicolor gradient:
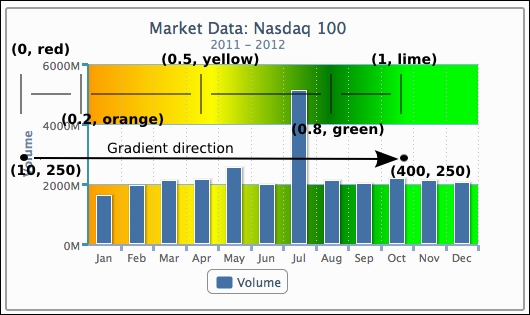
As we can see, the red and orange colors do not appear on the chart because the gradient is based on coordinates. Hence, depending on the size of the chart, the position of the y axis exceeds the red and orange coordinates in this example. Alternatively, we can specify linearGradient in terms of percentage, as follows:
linearGradient: [ '20%', 250, '90%', 250 ]
This means linearGradient stretches from 20% of the width of the chart to 90%, so that the color bands are not limited to the size of the chart. The following screenshot shows the effect of the new linearGradient setting:
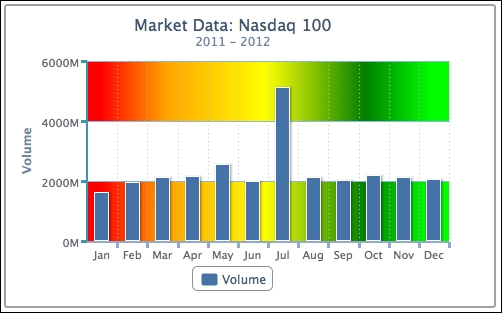
The chart background now has the complete color spectrum. As for specifying ratio values between 0 and 1, linearGradient must be defined in an object style, otherwise the values will be treated as coordinates. Note that the ratio values are referred to as the fraction over the plot area only, and not the whole chart.
linearGradient: { x1: 0, y1: 0, x2: 1, y2: 0 }The preceding line of code is an alternative way to set the horizontal gradient.
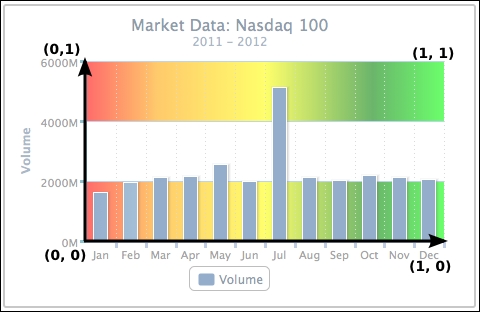
The following line of code adjusts the vertical gradient:
linearGradient: { x1: 0, y1: 0, x2: 0, y2: 1 }It produces a gradient background in a vertical direction. We also set the 'Jan' and 'Jul' data points individually as point objects with linear shading in a vertical direction:
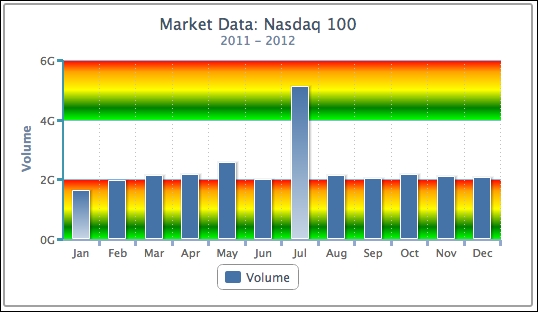
Moreover, we can manipulate Highcharts standard colors to trigger a color gradient in the series plot. This approach is taken from a post in a Highcharts forum experimenting with the look of 3D charts. Before plotting a chart, we need to overwrite the default series color with a gradient color. The following code snippet replaces the first series color with horizontal blue gradient shading. Note that the ratio gradient values in this example are referring to the width of the series column:
     $(document).ready(function() {

          Highcharts.getOptions().colors[0] = {
                  linearGradient: { x1: 0, y1: 0, x2: 1, y2: 0 },
                  stops: [ [ 0, '#4572A7' ],
                           [ 0.7, '#CCFFFF' ],
                           [ 1, '#4572A7' ] ]
           };

           var chart = new Highcharts.Chart({  ...
The following is a screenshot of a column chart with color shading: