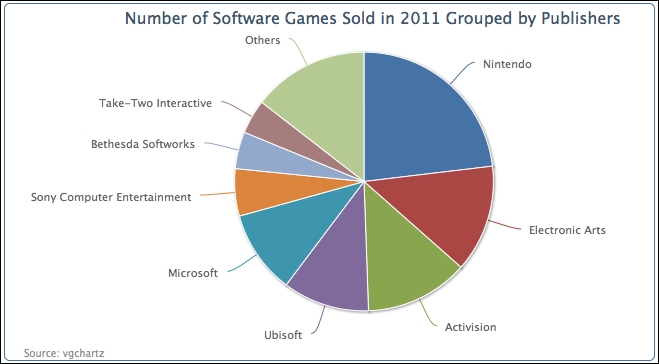
In this chapter, we are going to use video gaming data supplied by vgchartz (www.vgchartz.com). The following is the pie chart configuration, and the data is the number of games sold in 2011 according to publishers, based on the top 100 games sold. Wii Sports is taken out of the dataset because it is free with the Wii console:
      chart: {
        renderTo: 'container',
        type: 'pie',
        borderWidth: 1,
        borderRadius: 5
      },
      title: {
        text: 'Number of Software Games Sold in 2011 Grouped by Publishers',
      },
      credits: {
        ...
      },
      series: [{
        data: [ [ 'Nintendo', 54030288 ],
            [ 'Electronic Arts', 31367739 ],
            ... ]
      }]
Here is a simple pie chart screenshot with the first data point (Nintendo) starting at the 12 o'clock position. The first slice always starts at the 12 o'clock position unless we specify a different start point with the startAngle option, which we will explore later in the chapter.
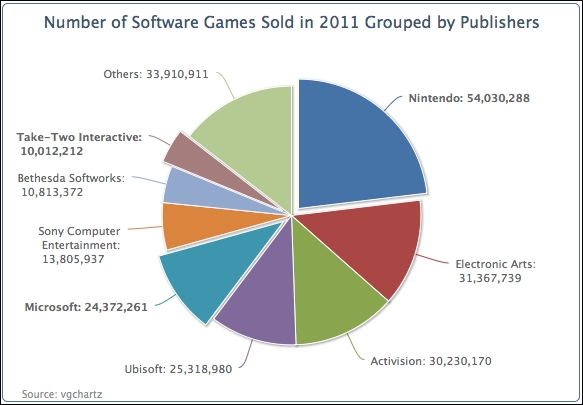
We can improve the previous pie chart to include values in the labels and word wrap some of the long names of the publishers. The following is the configuration code for the pie series. The allowPointSelect option allows the users to interact with the chart by clicking on the data points. As for the pie series, this is used for slicing off a section of the pie chart (see the following screenshot). The slicedOffset option is used to adjust how far the section is sliced off from the pie chart. For word wrap labels, we set the labels style, dataLabels.style.width, to 140 pixels wide:
   plotOptions: {
     pie: {
       slicedOffset: 20,
       allowPointSelect: true,
       dataLabels: {
         style: {
              width: '140px'
         },
         formatter: function() {
           var str = this.point.name + ': ' +
             Highcharts.numberFormat(this.y, 0);
           return str;
         }
       }
     }
   },
Additionally, we would like to slice off the largest section in the initial display; its label is shown in bold type font. To do that, we will need to change the largest data point into object configuration as shown in the following screenshot. Then we put the sliced property into the object and change from the default, false, to true, which forces the slice to part from the center. Furthermore, we set dataLabels with the assignment of the fontWeight option to overwrite the default settings:
    series: [{
      data: [ {
        name: 'Nintendo',
        y: 54030288,
        sliced: true,
        dataLabels: {
          style: {
          fontWeight: 'bold'
          }
        }
       }, [ 'Electronic Arts', 31367739 ],
        [ 'Activision', 30230170 ], .... ]
    }]
The following is the chart with the refined labels:

As mentioned earlier, the slicedOffset option has also pushed the sliced off section further than the default distance, which is 10 pixels. The slicedOffset option applies to all the sliced off sections, which means that we cannot control the distance of individually parted sections. It is also worth noticing that the connectors (the lines between the slice and the data label) become crooked as a result of that. In the next example, we demonstrate that the sliced property can be applied to as many data points as we want, and remove the slicedOffset option to resume the default settings to show the difference. The following chart illustrates this with three parted slices, by repeating the data object settings (Nintendo) for two other points:
Notice that the connectors go back to being smooth lines. However, there is another interesting behavior for the sliced option. For those slices with sliced as the default setting (false), only one of them can be sliced off. For instance, the user clicks on the Others section and it moves away from the chart. Then, clicking on Activision will slice off the section and the Others section moves back towards the center, whereas the three configured sliced: true sections maintain their parted positions. In other words, with the sliced option set to true, this enables its state to be independent of others with the false setting.
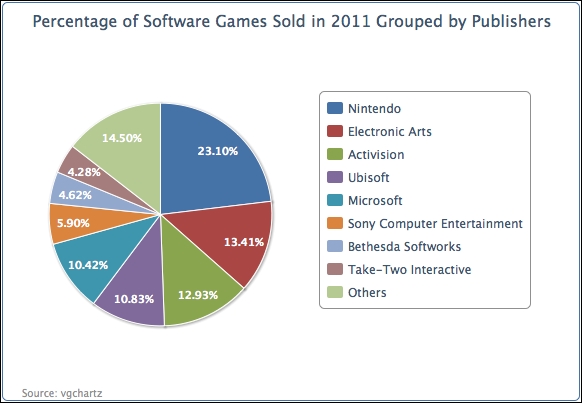
So far, the chart contains large numbers, and it is difficult to really comprehend how much larger one section is than the other. We can print all the labels in percentages. Let's put all the publisher names inside a legend box and print the percentage values inside each slice.
The plotting configuration is redefined as follows. To enable the legend box, we set showInLegend to true. Then, we set the data labels' font color and style to bold and white respectively, and change the formatter function slightly to use the this.percentage variable that is only available for the pie series. The distance option is the distance between the data label and the outer edge of the pie. A positive value will shift the data label outside of the edge and a negative value will do the same in the opposite direction:
      plotOptions: {
        pie: {
          showInLegend: true,
          dataLabels: {
            distance: -24,
            color: 'white',
            style: {
              fontWeight: 'bold'
            },
            formatter: function() {
              return Highcharts.numberFormat(this.percentage) + '%';
            }
          }
        }
      },
Then, for the legend box, we add in some padding as there are more than a few legend items, and set the legend box closer to the pie, as follows:
      legend: {
        align: 'right',
        layout: 'vertical',
        verticalAlign: 'middle',
        itemMarginBottom: 4,
        itemMarginTop: 4,
        x: -40
      },
The following is another presentation of the chart: