The radial gradient setting is based on SVG. As its name implies, a radial gradient is color shading radiating outwards in a circular direction. Therefore, it requires three properties to define the gradient circle—cx, cy, and r. The gradient circle is the outermost circle for shading, such that no shading can go outside of this.
All the gradient positions are defined in ratio values between zero and one with respect to their containing elements. The cx and cy options are at the x, y center position of the outermost circle, whereas r is the radius of the outmost circle. If r is 0.5, it means the gradient radius is half the diameter of its element, the same size as the containing pane. In other words, the gradient starts from the center and goes all the way to the edge of the gauge. The stop offsets option works the same way as the linear gradient: the first parameter is the ratio position in the gradient circle to stop the shading. This controls the intensity of shading between the colors. The shorter the gap, the higher the contrast between the colors.
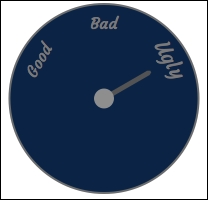
Let's explore how to set up the color gradient. The following is a mood swing detector without any color gradient:
We will apply a radial gradient to the preceding chart with the following settings:
                background: [{
                   backgroundColor: {
                       radialGradient: {
                           cx: 0.5,
                           cy: 0.5,
                            r: 0.5
                       },
                       stops: [
                           [ 0, '#CCD5DE' ],
                           [ 1, '#002E59' ]
                       ]
                   }
                }]
We have set cx, cy, and r to 0.5 for the gradient to start shading from the center position all the way towards the edge of the circle, as follows:
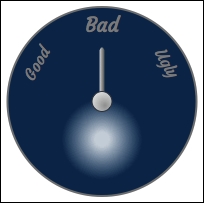
As we can see, the preceding chart shows white shading evenly radiating from the center. Let's change some of the parameters and see the effect:
backgroundColor: {
radialGradient: {
cx: 0.5,
cy: 0.7,
r: 0.25
},
stops: [
[ 0.15, '#CCD5DE' ],
[ 0.85, '#002E59' ]
]
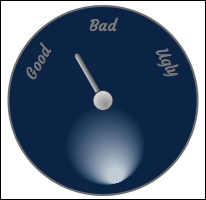
}Here, we have changed the size of the gradient circle to half the size of the gauge and moved the circle down. The bright color doesn't start shading until it reaches 15 percent of the size of the gradient circle, so there is a distinct white blob in the middle, and the shading stops at 85 percent of the circle:
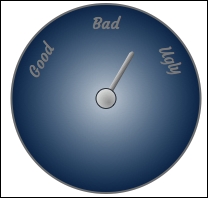
In the SVG radiant gradient, there are two other options, fx and fy, which are used to set the focal point position for the shading; they are also referred to as the inner circle settings.
Let's experiment with how the focal point can affect the shading:
                   backgroundColor: {
                       radialGradient: {
                           cx: 0.5,
                           cy: 0.7,
                            r: 0.25,
                           fx: 0.6,
                           fy: 1.0
                       },
                       stops: [
                           [ 0.15, '#CCD5DE' ],
                           [ 0.85, '#002E59' ]
                       ]
                   }
The preceding code snippet produces the following output:
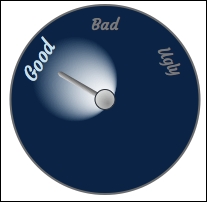
We can observe that the fx and fy options move the bright color starting from the bottom of the gradient circle and slightly to the right-hand side. This makes the shading much more directional. Let's make our final change by moving the bright spot position towards the center of the gauge chart. In addition, we align the focal directional along the Good label:
                background: [{
                   backgroundColor: {
                       radialGradient: {
                           cx: 0.32,
                           cy: 0.38,
                            r: 0.25,
                           fx: 1.3,
                           fy: 0.95
                       },
                       stops: [
                           [ 0.1, '#CCD5DE' ],
                           [ 0.9, '#002E59' ]
                       ]
                   }]
Finally, we can finish the chart by moving the bright side to where we want it to be, as follows: