To enable the 3D feature, we first need to include the extension as follows:
<script
 src="http://code.highcharts.com/highcharts-3d.js"></script>
In Highcharts, there are two levels of 3D options: chart and series. The chart level options are located in chart.options3d, which mainly deals with the orientation and the frame around the plotting area, whereas the 3D options for the series remain in the usual plotOptions area, such as plotOptions.column.depth.
Currently, Highcharts supports 2 axles of rotation: horizontal and vertical, which are the alpha and beta options in chart.options3d respectively. The values for these options are in degrees. The following diagram illustrates with arrows the direction of chart rotation as the degree value increases and decreases:
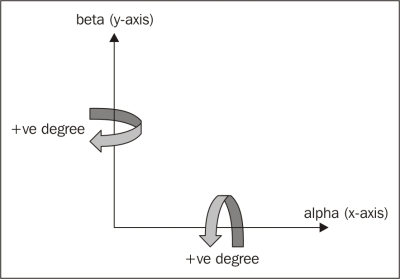
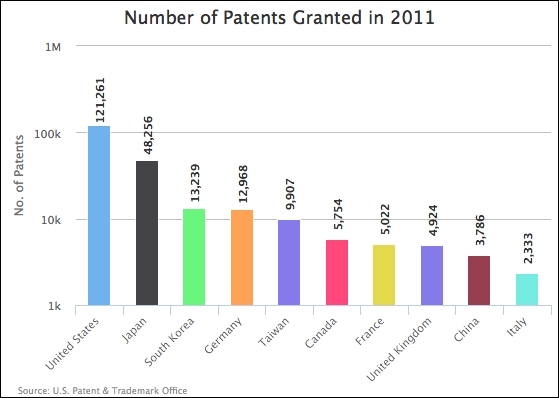
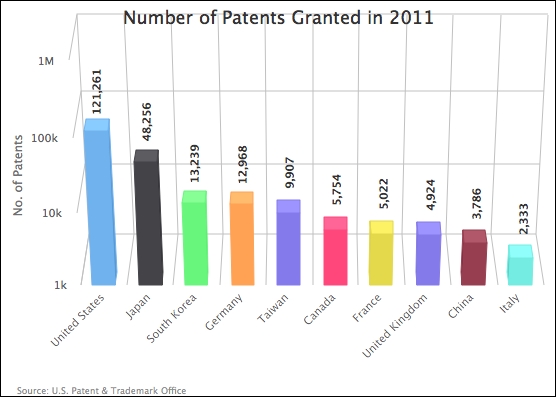
In the previous diagram, we showed the direction of orientation. Let's experiment with a column chart. We are going to use a chart from Chapter 4, Bar and Column Charts, which looks as follows:
We then add the 3D options to the chart as follows:
chart: {
renderTo: 'container',
type: 'column',
borderWidth: 1,
options3d: {
alpha: 0,
beta: 0,
enabled: true
}
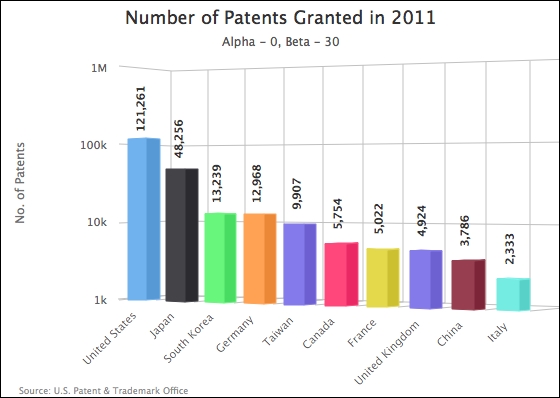
},We switch the chart to 3D display mode with the enabled option and no rotation in both axles, which produces the following chart:
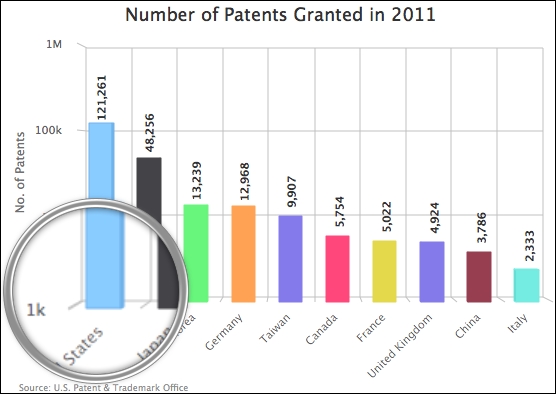
Notice that without any rotation, the chart looks almost the same as the original, as expected. When we look closer, the columns are actually constructed in 3D, with depth. Let's set the alpha axle to 30 degrees and the beta axle to remain at zero:
We can see the 3D structure more clearly as the alpha axle increases, as we are leaning towards a top-down view of the chart. Let's reset alpha back to zero and set the beta axle to 30 degrees:
The chart is rotated horizontally on a vertical principal axis. Note that once the chart is rotated on the beta axle, a large gap appears between the title and the y axis. We can remove the gap by positioning the title with x and y options:
yAxis: {
title: {
text: 'No. of Patents',
x: 35,
y: -80
}
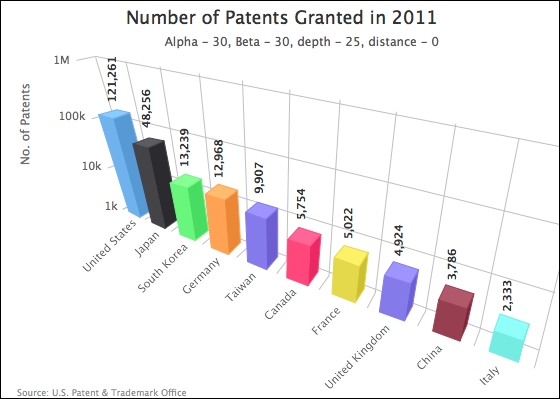
},Let's set both rotations together to 30:
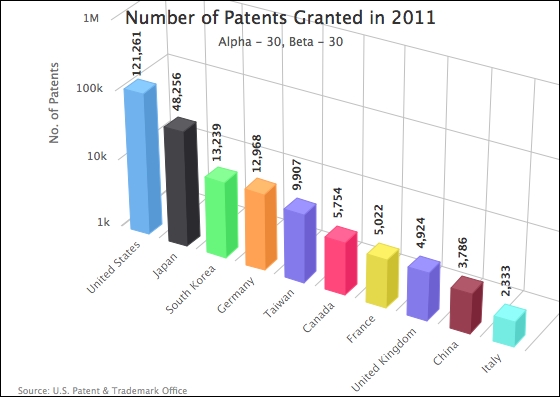
Notice that when we rotate a 3D chart, the plot area can interfere with other components, such as chart title and spacing on each side. In this case, we need to use the margin settings to manually accommodate the chart properly, depending on the size and view angle. Here is an example:
        var chart = new Highcharts.Chart({
              chart: {
                    ....,
                    marginTop: 105,
                    marginLeft: 35,
                    spacingBottom: 25
              }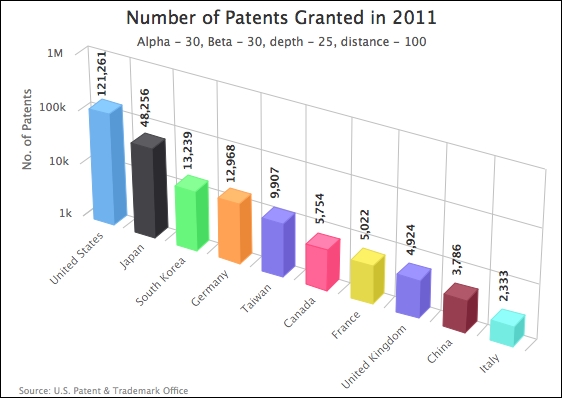
....Apart from alpha and beta options, we can use the depth option to control the distance between the data display and the 3D background. Let's set the depth option to be exactly the same as the default depth of the 3D columns, which is 25 pixels deep. We also specify the viewDistance option to the default value, 100 (at the time of writing, changing the depth value also changes the viewDistance value), as follows:
                options3d: {
                    alpha: 30,
                    beta: 30,
                    enabled: true,
                    viewDistance: 100,
                    depth: 25
                }
As we can see, the columns are backed up against the background frame:
Let's change the viewDistance option to 0 for a closer perspective: