In this section, we will investigate how you can interact with 3D charts. In Chapter 2, Highcharts Configurations, we have already explored the drill down feature and we will revisit it briefly in 3D charts. Another interaction specific to 3D charts is the impressive click-and-drag feature.
Let's convert our previous drill down example into a 3D chart. First, we add the options3d option (and other positioning options):
              options3d: {
                  enabled: true,
                  alpha: 25,
                  beta: 30,
                  depth: 30,
                  viewDistance: 100
              },
Here, we have our top level 3D chart:
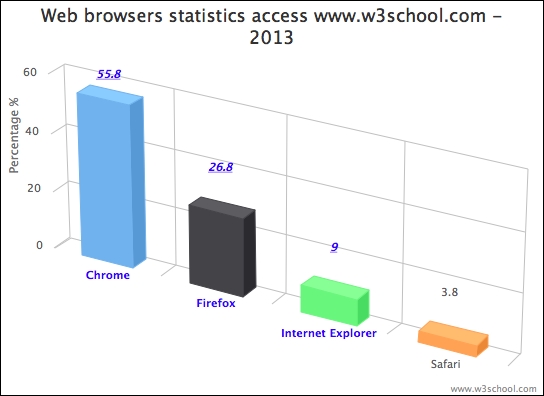
The next step is to improve our drill down pie chart in 3D with different orientation. Since the top level column is already configured in 3D, the drill down pie chart (defined in the drilldown.series option with matching id value) will also follow suit. However, we won't notice the pie in 3D because the default depth is 0. So, we need to set the thickness of the pie chart with the depth option:
                plotOptions: {
                    pie: {
                       depth: 30,
                       ....,
In order to set the drill down chart to a different rotation, we change the chart options in the drilldown event callback:
chart: {
renderTo: 'container',
....,
events: {
drilldown: function(e) {
....
if (e.point.name == 'Internet Explorer') {
// Create the '9%' string in the center of
// the donut chart
pTxt = chart.renderer.text('9%',
(chart.plotWidth / 2) + chart.plotLeft - 25,
(chart.plotHeight / 2) + chart.plotTop + 25).
css({
// font size, color and family
....,
'-webkit-transform':
'perspective(600) rotateY(50deg)'
}).add();
chart.options.chart.options3d.alpha = 0;
chart.options.chart.options3d.beta = 40;
}
},
drillup: function() {
// Revert to original orientation
chart.options.chart.options3d.alpha = 25;
chart.options.chart.options3d.beta = 30;
....
}
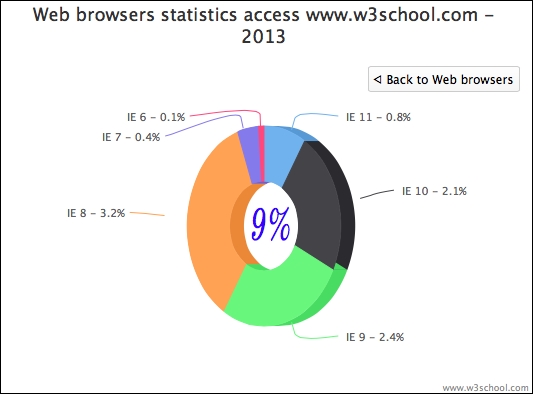
} When the drilldown event is triggered from the Internet Explorer column, which zooms down to a donut chart, we set the chart with new alpha and beta orientations to 0 and 40 respectively. We use the CSS3 -webkit-transform setting on the 9% sign to make it appear to have the same rotation as the donut chart. Finally, we reset the chart to its original orientation in the drillup callback, which is triggered when the user clicks on the Back to …. button. Here is the display of the zoom down donut chart:
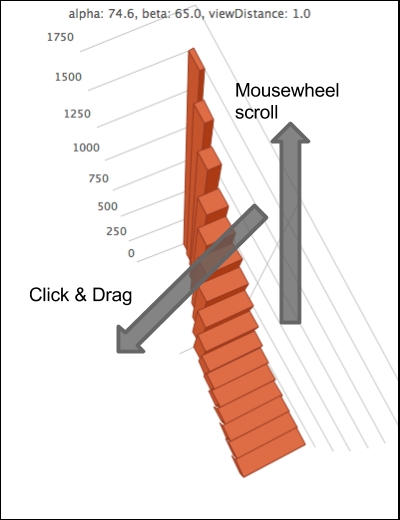
Another impressive interaction with 3D charts is the click-and-drag function which we can use to drag the chart into any orientation. This interaction is actually from the Highcharts 3D scatter online demo, (http://www.highcharts.com/demo/3d-scatter-draggable). Here, we are going to explore how this is achieved. Before we do that, let's reuse our infographics example and copy the click-and-drag jQuery demo code into this exercise. The following is the click-and-drag code with minor modifications:
    $(function () {
        $(document).ready(function() {
            document.title = "Highcharts " + Highcharts.version;

            var chart = new Highcharts.Chart({
                ....
            });
            // Add mouse events for rotation
            $(chart.container).bind('mousedown.hc touchstart.hc',
              function (e) {
                e = chart.pointer.normalize(e);

                var posX = e.pageX,
                    posY = e.pageY,
                    alpha = chart.options.chart.options3d.alpha,
                    beta = chart.options.chart.options3d.beta,
                    newAlpha,
                    newBeta,
                    sensitivity = 5; // lower is more sensitive

                $(document).bind({
                    'mousemove.hc touchdrag.hc':
                       function (e) {
                          // Run beta
                          newBeta =
                            beta + (posX - e.pageX) / sensitivity;
                          newBeta =
                            Math.min(100, Math.max(-100,
                                     newBeta));
                          chart.options.chart.options3d.beta =
                            newBeta;

                        // Run alpha
                        newAlpha =
                           alpha + (e.pageY - posY) / sensitivity;
                        newAlpha = Math.min(100, Math.max(-100,
                                    newAlpha));
                        chart.options.chart.options3d.alpha =
                            newAlpha;

                        // Update the alpha, beta and viewDistance
                        // value in subtitle continuously
                        var subtitle = "alpha: " +
                            Highcharts.numberFormat(newAlpha, 1) +
                            ", beta: " +
                            Highcharts.numberFormat(newBeta, 1) +
                            ", viewDistance: " +
                            Highcharts.numberFormat(
                  chart.options.chart.options3d.viewDistance, 1);
                        chart.setTitle(null,
                               { text: subtitle }, false);

                        chart.redraw(false);
                    },

                    'mouseup touchend': function () {
                        $(document).unbind('.hc'),
                    }
                });
            });
The chart container's element is bound with the mousedown and touchstart events. The event names suffixed by '.hc' mean that the event handlers are grouped into the same name space, '.hc'. This is later used to unbind the event handlers declared under the name space.
So when the user performs a mousedown or touchstart event in the chart container, it executes the handler. The function first normalizes the event object for cross-browser event compatibility. Then it records the current pointer position values (pageX, pageY) as well as alpha and beta values under the mousedown event. Further under the mousedown or touchstart events, we bind an additional handler with the mousemove and touchdrag events in the same '.hc' name space. In other words, this means that under the mousedown or touchstart action, moving the mouse and dragging via touch will bind the second handler to the container.
The second handler implementation is to calculate the movement in x and y directions by comparing the current movement coordinates to the initial position recorded in the mousedown handler. Then, it transforms the scroll distance into orientation and updates the new alpha and beta values. The Math.max and Math.min expressions are to limit the alpha and beta into a range between -100 and 100. Note that the code doesn't restrict us to only using pageX/Y from the event object. We can use other similar properties such as screenX/Y or clientX/Y, as long as both handlers are referring to the same.
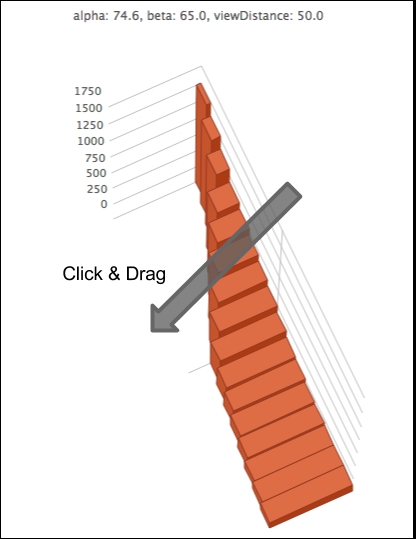
Finally, we call chart.draw(false) to redraw the chart with the new orientation but without animation. The reason for a lack of animation is that the movement handler is being called frequently with scroll action and animation, which will require extra overhead, degrading the responsiveness of the display.
The following screenshot illustrates the chart after the click-and-drag action:
We can improve the experience by introducing another interaction, mousewheel, so that the view distance of the chart responds to the mousewheel actions. For the sake of a cross-browser compatibility solution, we use a jQuery mousewheel plugin by Brandon Aaron (http://github.com/brandonaaron/jquery-mousewheel/).
The following is the handler code:
// Add mouse events for zooming in and out view distance
$(chart.container).bind('mousewheel',
     function (e) {
         e = chart.pointer.normalize(e);
         var sensitivity = 10; // lower is more sensitive
         var distance =
             chart.options.chart.options3d.viewDistance;

         distance += e.deltaY / sensitivity;
         distance = Math.min(100, Math.max(1, distance));

         chart.options.chart.options3d.viewDistance = distance;

         var subtitle = "alpha: " +
              Highcharts.numberFormat(
              chart.options.chart.options3d.alpha, 1) +
                ", beta: " +
              Highcharts.numberFormat(
             chart.options.chart.options3d.beta, 1) +
                ", viewDistance: " +
              Highcharts.numberFormat(distance, 1);

            chart.setTitle(null, { text: subtitle }, false);

            chart.redraw(false);
     });
In a similar fashion, deltaY is the mousewheel scroll value and we apply the change to the viewDistance option. Here is the result when we apply click-and-drag and mousewheel scroll actions: