
Highcharts offers a small set of APIs designed for plotting charts with dynamic interactions. In order to understand how the APIs work, we must first familiarize ourselves with the chart's internal objects and how they are organized inside a chart. In this chapter, we will learn about the chart class model and how to call the APIs by referencing the objects. Then we build a simple stock price application with PHP, jQuery, and jQuery UI to demonstrate the use of Highcharts APIs. After that, we turn our attention to four different ways of updating a series. We experiment with all the series update methods with the purpose of building an application to illustrate variations in visual effects, and the difference in CPU performance between them. Finally, we investigate performance when updating a series with popular web browsers, in terms of different sizes of datasets. In this chapter, we will cover the following topics:
- Understanding the Highcharts class model
- Getting data in Ajax and displaying new series with
Chart.addSeries - Displaying multiple series with simultaneous Ajax calls
- Using
Chart.getSVGto format SVG data into an image file - Using the
Chart.renderermethods - Exploring different methods to update series and their performance
- Experimenting with Highcharts performance with large datasets
The relationship between Highcharts classes is very simple and obvious. A chart is composed of five different classes—Chart, Axis, Series, Point, and Renderer. Some of these classes contain an array of lower-level components and an object property to back-reference to a higher level-owner component. For example, the Point class has the series property pointing back to the owner Series class. Each class also has a set of methods for managing and displaying its own layer. In this chapter, we will focus on the set of APIs for dynamically modifying charts. The following class diagram describes the association between these classes:
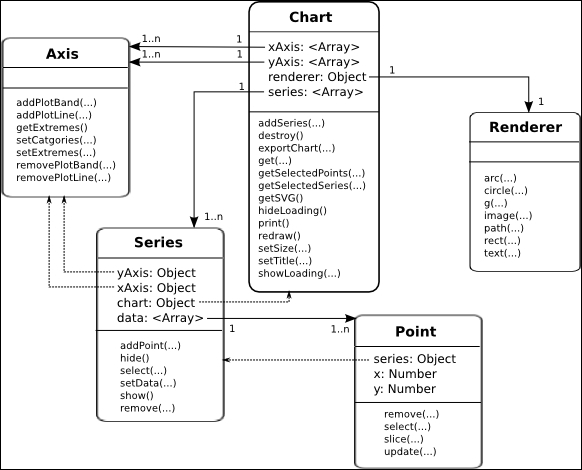
The Chart class is the top level class representing the whole chart object. It contains method calls to operate the chart as a whole—for example, exporting the chart into SVG or other image formats and setting the dimension of the chart. The Chart class has multiple arrays of Axis and Series objects; that is, a chart can have one or more x axes, y axes, and series. The Renderer class is a utility class that has a one-to-one relationship per chart and provides a common interface for drawing in SVG and VML-based browsers.
The Series class has an array of Point objects. The class has back-reference properties towards the Chart and Axis objects (see the dotted lines in the previous diagram) and provides functions for managing its list of Point objects. The yAxis and xAxis properties in the Series class are necessary, as a chart can have multiple axes.
The Point class is just a simple object containing x and y values and a back-reference to its series object (see the dotted line). The APIs are for managing the data points in the chart.
Needless to say, the most important method in the APIs is the Highcharts.Chart method, with which we have seen plenty of action so far. However, there is more to this constructor call. Highcarts.Chart creates and returns a chart object but it also has a second optional parameter known as callback:
Chart(Object options, [ Function callback ])
The callback function is called when a chart is created and rendered. Inside the function, we can either call the component methods or access the properties inside the chart object. The newly created chart object is passed via the only callback function parameter. We can also use the 'this' keyword inside the callback function, which also refers to the chart object. Instead of using the Highcharts.Chart callback parameter, we can achieve the same result by declaring our code inside the chart.events.load handler, which will be explored in the next chapter.
In order to use the Highcharts API, we must navigate to the right object inside the class hierarchy. There are several ways to traverse within the chart object: through the chart hierarchy model, retrieving the component directly with the Chart.get method, or a mixture of both.
Suppose that the chart object is created, as follows:
<script type="text/javascript">
  $(document).ready(function() {
    var chart = new Highcharts.Chart({
      chart: {
          renderTo: "container"
      },
      yAxis: [{
        min: 10,
        max: 30
      }, {
        min: 40,
        max: 60
      }],
      series: [{
        data: [ 10, 20 ]
      }, {
        data: [ 50, 70 ],
        yAxis: 1
      }],
      subtitle: {
          text: "Experiment Highcharts APIs"
      }

    });
  }, function() {
   ...
  });
</script>
We can then access the first position of the series' object with the index 0 from the chart. Inside the callback handler, we use the this keyword to refer to the chart object as follows:
var series = this.series[0];
Suppose there are two y axes in the configuration. To retrieve the second y axis, we can do as follows:
var yAxis = this.yAxis[1];
To retrieve the third data point object from the second series of the chart, type the following:
var point = this.series[1].data[2];
Supposing multiple charts are created on the page, a chart object can be accessed via the Highcharts namespace:
var chart = Highcharts.charts[0];
We can also retrieve the chart's container element through the container option:
var container = chart.container;
To examine the options structure of a created chart, use the options property:
// Get the chart subtitle
var subtitle = chart.options.subtitle.text;
Instead of cascading down the object hierarchy, we can directly retrieve the component using the Chart.get method (the get method is only available at the chart level, not in each component class). Assigning components with IDs will allow you to access them directly using the get method instead of traversing nodes in the object's hierarchical structure. The configuration uses the option key id, so this value must be unique.
Suppose we have created a chart with the following configuration code:
xAxis: {
  id: 'xAxis',
  categories: [ ... ]
},
series: [{
  name: 'UK',
  id: 'uk',
  data: [ 4351, 4190,
      { y: 4028, id: 'thirdPoint' },
      ... ]
}]
We can retrieve the components as follows:
var series = this.get('uk'),
var point = this.get('thirdPoint'),
var xAxis = this.get('xAxis'),
If the id option is not previously configured, we can use the JavaScript filter method to search for the item based on the property:
this.series.filter(function(elt) {return elt.name == 'uk';})[0];