This application extends the historical stock chart in the previous chapter with an additional investment portfolio feature. The frontend is implemented with jQuery and jQuery UI, and the following events are covered in this example:
chart.events:click,load,redraw, andselectionplotOptions.series.points.events:mouseover,mouseout,select, andunselectxAxis/yAxis.plotLines.events:mouseoverandclick
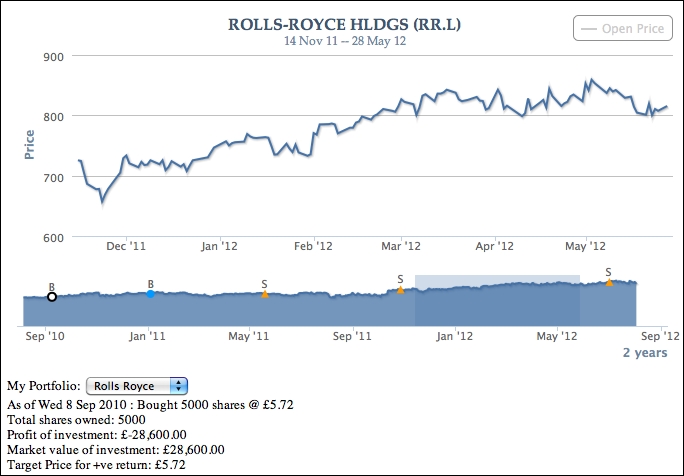
The following is the startup screen of the demo, with the components labeled:
The application contains a pair of time series charts. The bottom chart is the top-level graph that shows the entire historic price movement and points to when company shares are bought and sold. The top chart is the detail chart that zooms in to the finer details when a selected area is made in the bottom graph.
As soon as the web application is loaded in a browser, both charts are created. The top-level chart is configured with a load event that automatically requests a stock historic price and portfolio history from the web server.
The following screenshot shows a graph after the top-level chart is auto-loaded:
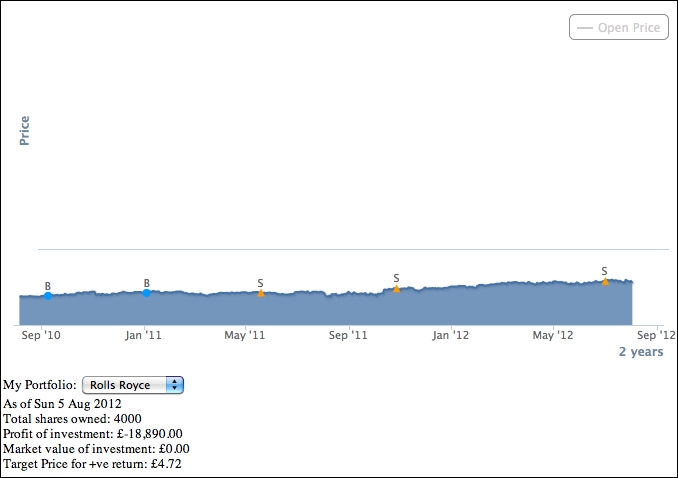
There are circular and triangular data points on top of the top-level chart. These denote the trade history. The B symbol indicates when the shares have been bought, whereas S signifies when they are sold. The information below the top-level chart is the portfolio detail for the stock as of the current date.
If we click on one of these trade history points, the portfolio detail section is updated to reflect the investment history as of the selected date. Moreover, when we select an area, it zooms in and displays the stock price movement in the detail chart. There are other features involved in event handling and we will discuss them in later sections.
The following is the configuration code for the top-level chart (the bottom chart shows the entire historic price movement) and we store the chart object in the myApp namespace, as follows:
     $.myApp.topChart = new Highcharts.Chart({
         chart: {
             zoomType: 'x',
             spacingRight: 15,
             renderTo: 'top-container',
             events: {
                 // Load the default stock symbol of
                 // the portfolio
                 load: function() {  ....  },

                 // The top level time series have
                 // been redrawn, enable the portfolio
                 // select box
                 redraw: function() { .... },

                 // Selection - get all the data points from
                 // the selection and populate into the
                 // detail chart
                 selection: function(evt) {  ....  },
             }
         },
         title: { text: null },
         yAxis: {
             title: { text: null },
             gridLineWidth: 0,
             labels: { enabled: false }
         },
         tooltip: { enabled: false },
         xAxis: {
             title: { text: null },
             type: 'datetime'
         },
         series: [ ... ],
         legend: { enabled: false },
         credits: { enabled: false }
     });
There is a lot going on in this configuration. The chart is defined with most of the features disabled, such as legend, title, tooltip, and y-axis label. More importantly, the chart is configured with a zoomType option, which enables the chart to be zoomable along the x-axis direction; hence, we can use the select event. The series array is composed of multiple series that also contain event configurations.
In the series array, multiple series are defined with close and open price, bought and sold trade dates, and a hidden series for tracking mouse movement in the detail chart:
        series: [{
             // Past closed price series
             type: 'areaspline',
             marker: { enabled: false },
             enableMouseTracking: false
        }, {
             // This is the open price series and never shown
             // in the bottom chart. We use it to copy this
             // to the detail chart
             visible: false
        }, {
             // Series for date and price when shares
             // are bought
             type: 'scatter',
             allowPointSelect: true,
             color: $.myApp.boughtColor,
             dataLabels: {
                 enabled: true,
                 formatter: function() { return 'B'; }
             },
             point: {
                 events: { .... }
             }
        }, {
             // Series for date and price when shares are sold
             type: 'scatter',
             allowPointSelect: true,
             color: $.myApp.soldColor,
             dataLabels: {
                 enabled: true,
                 formatter: function() { return 'S'; }
             },
             point: {
                 events: { .... }
             }
        }, {
             // This is the tracker series to show a single
             // data point of where the mouse is hovered on
             // the detail chart
             type: 'scatter',
             color: '#AA4643'
         }]
The first series is the historic stock price series and is configured without data point markers. The second series is hidden and acts as a placeholder for historic open price data in the detail chart. The third (bought) and fourth (sold) series are the scatter series revealing the dates when shares have been traded. Both series are set with the allowPointSelect option, so that we can define the select and unselect events in the point.events option. The final series is also a scatter series to reflect the mouse movement in the detail chart using the mouseover and mouseout events; we will see how all these are implemented later on.
As mentioned earlier, once the top-level chart is created and loaded on to the browser, it is ready to fetch the data from the server. The following is the chart's load event handler definition:
     chart: {
         events: {
             load: function() {
                 // Load the default stock symbol of
                 // the portfolio
                 var symbol = $('#symbol').val();
                 $('#symbol').attr('disabled', true);
                 loadPortfolio(symbol);
             },
We first retrieve the value from the My Portfolio selection box and disable the selection box during the query time. Then, we call a predefined function, loadPortfolio. The method performs several tasks, as follows:
- Launching an Ajax call,
$.getJSON, to load the past stock price and portfolio data. - Setting up a handler for the returned Ajax result that further executes the following steps:
Once the top-level chart is populated with data, we can then enable the My Portfolio selection box on the page. To do that, we can rely on the redraw event, which is triggered by the Series.setData call in sub-step 2 inside step 2:
       redraw: function() {
           $('#symbol').attr('disabled', false);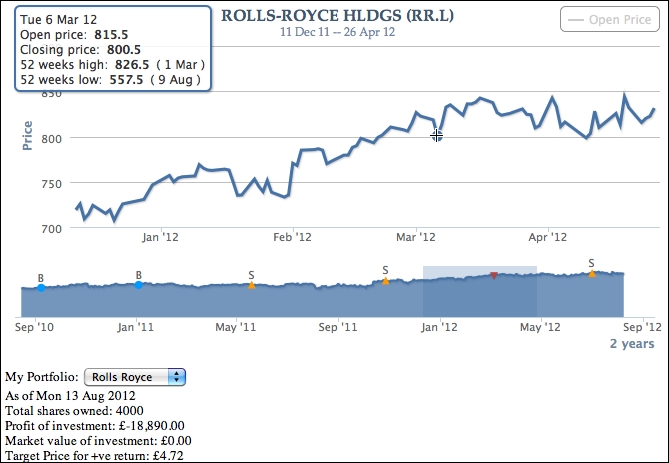
},The bought and sold series share the same events handling; the only differences between them are the color and the point marker shape. The idea is that, when the user clicks on a data point in these series, the Portfolio Detail section is updated to show the investment detail for the stock as of the trade date. The following screenshot shows the effect after the first bought trade point is selected:
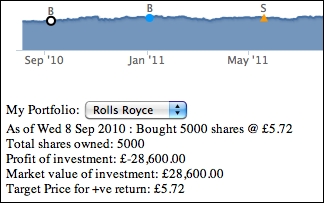
In order to keep the data point selected, we will use the allowPointSelect option, which allows us to define the select and unselect events. The following is the events configuration for the bought and sold series:
        point: {
            events: {
                select: function() {
                    updatePortfolio(this.x);
                },
                unselect: function() {
                    // Only default back to current time
                    // portfolio detail when unselecting
                    // itself
                    var selectPt =
                        $.myApp.topChart.getSelectedPoints();
                    if (selectPt[0].x == this.x) {
                        updatePortfolio(new Date().getTime());
                    }
                }
            }
        }
Basically, the select event handler calls a predefined function, updatePortfolio, that updates the Portfolio Detail section based on the selected data point time: this.x. The 'this' keyword in the handler refers to the selected point object, where x is the time value.
Unselecting the data point will call the unselect event handler. The preceding implementation means that, if the unselected data point (this.x) is the same as the previously selected point, then it indicates that the user has unselected the same point, so we want to show the portfolio detail as of the current date. Otherwise it will do nothing because it means the user has selected another trade data point; thus, another select event call is made with a different date.
The selection event forms the bridge between the top-level chart and the detail chart. When we select an area in the top-level chart, the selected area is highlighted and the data is zoomed in the detail chart. This action triggers the selection event and the following is the cut-down code of the event handler:
           selection: function(evt) {
               // Get the xAxis selection
               var selectStart = Math.round(evt.xAxis[0].min);
               var selectEnd   = Math.round(evt.xAxis[0].max);

               // We use plotBand to paint the selected area
               // to simulate a selected area
               this.xAxis[0].removePlotBand('selected'),
               this.xAxis[0].addPlotBand({
                   color: 'rgba(69, 114, 167, 0.25)',
                   id: 'selected',
                   from: selectStart,
                   to: selectEnd
               });
               for (var i = 0;
                    i < this.series[0].data.length; i++) {
                  var pt = this.series[0].data[i];
                  if (pt.x >= selectStart &&
                      pt.x <= selectEnd) {
                      selectedData.push([pt.x, pt.y]);
                  }

                  if (pt.x > selectEnd) {
                      break;
                  }
               }

               // Update the detail serie
               var dSeries = $.myApp.detailChart.series[0];
               dSeries.setData(selectedData, false);
               ....

               // Update the detail chart title & subtitle
               $.myApp.detailChart.setTitle({
                   text: $.myApp.stockName + " (" +
                         $.myApp.stockSymbol + ")",
                   style: { fontFamily: 'palatino, serif',
                            fontWeight: 'bold' }
                   }, {
                   text: Highcharts.dateFormat('%e %b %y',
                         selectStart) + ' -- ' +
                         Highcharts.dateFormat('%e %b %y',
                         selectEnd),
                   style: { fontFamily: 'palatino, serif' }
               });

               $.myApp.detailChart.redraw();
               return false;
          }
There are several steps taken in the handler code. First, we extract the selected range values from the handler parameters—evt.xAxis[0].min and evt.xAxis[0].max. The next step is to make the selected area stay highlighted in the top-level chart. To do that, we create a plot band using this.xAxis[0].addPlotBand over the same area to simulate the selection.
The 'this' keyword refers to the top-level chart object. The next task is to give a fixed id, so that we can remove the old selection and highlight a new selection. Additionally, the plot band should have the same color as the selection being dragged on the chart. All we need to do is to assign the plot band color to be the same as the default value of the chart.selectionMarkerFill option.
After that, we copy the data within the selected range into an array and pass it to the detail chart using Series.setData. Since we called the setData method a couple of times, it is worth setting the redraw option to false to save resources and then calling the redraw method.
Finally, the most important step is to return false at the end of the function. Returning the false Boolean value tells Highcharts not to take the default action after the selection has been made. Otherwise the whole top-level chart is redrawn and stretched (alternatively, we can call event.preventDefault()).
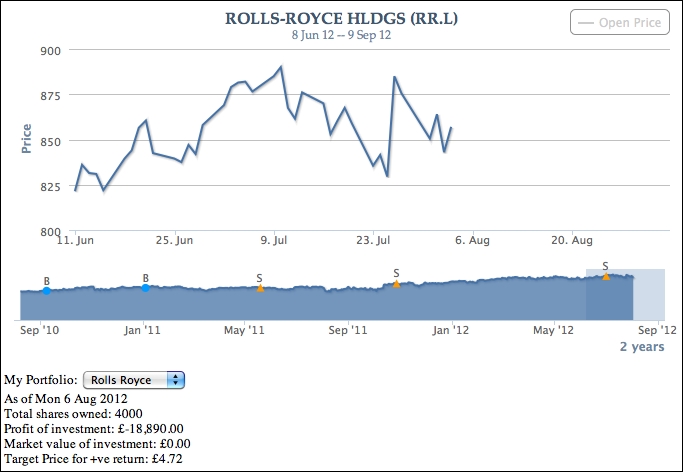
The following screenshot zooms and displays the detail in another chart:
The detail chart is simply a line chart showing the selected region from the top-level chart. The chart is configured with a tool tip fixed in the upper-left corner and a number of events that we will discuss later:
       $.myApp.detailChart = new Highcharts.Chart({
            chart: {
                showAxes: true,
                renderTo: 'detail-container',
                events: {
                    click: function(evt) {
                        // Only allow to prompt stop order
                        // dialog if the chart contains future
                        // time
                        ....
                    }
                },
             },
             title: {
                margin: 10,
                text: null
             },
             credits: { enabled: false },
             legend: {
                enabled: true,
                floating: true,
                verticalAlign: 'top',
                align: 'right'
             },
             series: [ ... ],
             // Fixed location tooltip in the top left
             tooltip: {
                shared: true,
                positioner: function() {
                    return { x: 10, y: 10 }
                },
                // Include 52 week high and low
                formatter: function() {  .... }
             },
             yAxis: {
                title: { text: 'Price' }
             },
             xAxis: { type: 'datetime' }
        });
The following is a screenshot showing a data point being hovered over and the tool tip shown in the upper-left corner:
There are two series configured in the detail chart. The main focus is the first series, which is the stock closed price. The series is defined without data point markers and has 'crosshair' as the cursor option, as we can see in the preceding screenshot. In addition, the mouseout and mouseover events are defined for the data points that create a marker to the tracker series in the top-level chart. We will go through these events in the next section. The series array is defined as follows:
           series: [{
               marker: {
                   enabled: false,
                   states: {
                       hover: { enabled: true }
                   }
               },
               cursor: 'crosshair',
               point: {
                   events: {
                       mouseOver: function() { ... },
                       mouseOut: function() { ... }
                   }
               },
               stickyTracking: false,
               showInLegend: false
           }, {
               name: 'Open Price',
               marker: { enabled: false },
               visible: false
}],When we move the mouse pointer along the series in the detail chart, the movement is also reflected in the top-level chart within the selected area. The following screenshot shows the tracker point (the inverted triangle) displayed in the top-level chart:
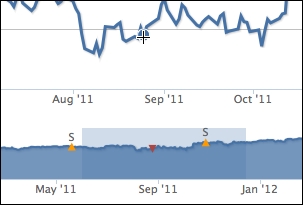
The inverted triangle indicates where we are browsing in the top-level chart. To do that, we will set up the mouseOut and mouseOver point event options in the detail chart series, as follows:
        point: {
            events: {
                mouseOver: function() {
                    var series = $.myApp.topChart.series[4];
                    series.setData([]);
                    series.addPoint([this.x, this.y]);
                },
                mouseOut: function() {
                     var series = $.myApp.topChart.series[4];
                     series.setData([]);
                }
            }
        },
Inside the mouseOver handler, the 'this' keyword refers to the hovered data point object and the x and y properties refer to the time and price values. Since both the top-level and detail charts share the same data type along both x and y axes, we can simply add a data point into the tracker series in the top-level chart. As for the mouseOut event, we reset the series by emptying the data array.
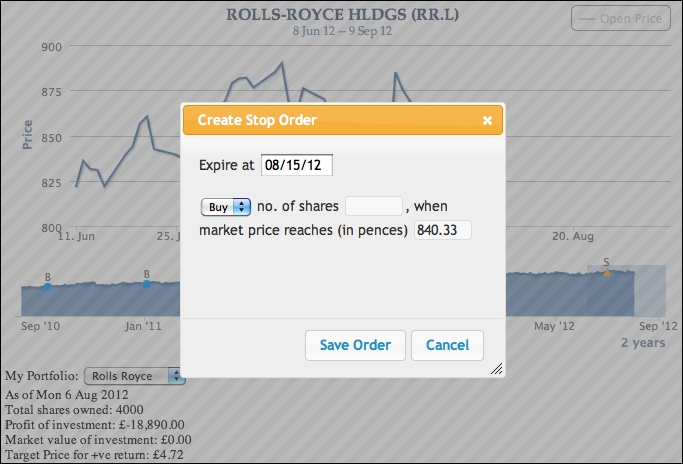
In this section, we will apply the chart click event to create a stop order for investment portfolios. Stop order is an investment term for selling or buying a stock when it reaches the price threshold within a specified date/time range in the future. It is generally used to limit a loss or protect a profit.
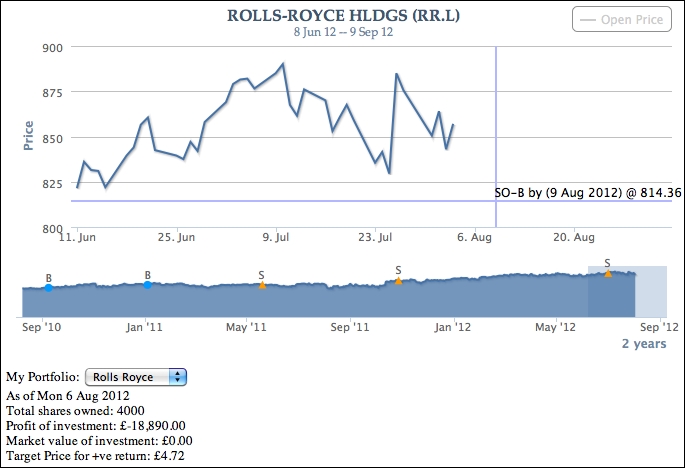
Notice that there is an empty space at the right-hand side of the top-level chart. In fact, this is deliberately created for the next 30-day range from the current date. Let's highlight that area, so that the future date appears in the detail chart:
As we can see, the line series in the detail chart stops as soon as it hits the current date. If we click on the zone for future dates in the detail chart, a Create Stop Order dialog box appears. The x, y position of the click on the chart is then converted into date and price, which then populates the values into the dialog box. The following is the screenshot of the dialog box:

The expiry date and price fields can be further adjusted if necessary. Once the Save Order button is clicked, a stop order is created and a pair of x and y plot lines are generated to mark the chart. The following is a screenshot showing two stop orders on the chart:
Let's see how all these actions can be derived from the code. First, the jQuery UI dialog is created based on an HTML form declared on the page:
  <div id='dialog'>
     <form>
        <fieldset>
           <label for="expire">Expire at</label>
           <input type=text name="expire" id="expire" size=9 ><br/><br/>
           <select name='stopOrder' id='stopOrder'>
              <option value='buy' selected>Buy</option>
              <option value='sell'>Sell</option>
           </select>
           <label for="shares">no. of shares</label>
           <input type="text" name="shares" id="shares" value="" size=7 class="text ui-widget-content ui-corner-all" />,
           <label for="price">when market price reaches (in pences)</label>
           <input type="text" name="price" id="price" value="" size=7 class="text ui-widget-content ui-corner-all" />
        </fieldset>
     </form>
  </div>
The click event handler for the detail chart is then defined, as follows:
           click: function(evt) {

               // Only allow to prompt stop order dialog
               // if the chart contains future time
               if (!$.myApp.detailChart.futureDate) {
                   return;
               }

               // Based on what we click on the time, set
               // input field inside the dialog
               $('#expire').val(
                   Highcharts.dateFormat("%m/%d/%y",
                   evt.xAxis[0].value));
               $('#price').val(
                   Highcharts.numberFormat(
                   evt.yAxis[0].value, 2));

               // Display the form to setup stop order
               $('#dialog').dialog("open");
           }
The first guard condition is to see whether the detail chart contains any future dates. If a future date exists, then it extracts the x and y values from the click event and assigns them into the form input fields. After that, it calls the jQuery UI dialog method to lay out the HTML form in a dialog box and displays it.
The following code snippet shows how we define the jQuery UI dialog box and its action buttons. The code is edited for readability:
           // Initiate stop order dialog
           $( "#dialog" ).dialog({
              // Dialog startup configuration –
              // dimension, modal, title, etc
              .... ,
              buttons: [{
                 text: "Save Order",
                 click: function() {
                     // Check whether this dialog is called
                     // with a stop order id. If not, then
                     // assign a new stop order id
                     // Assign the dialog fields into an
                     // object - 'order'
                     ....
                     // Store the stop order
                     $.myApp.stopOrders[id] = order;
                     // Remove plotlines if already exist.
                     // This can happen if we modify a stop
                     // order point
                     var xAxis = $.myApp.detailChart.xAxis[0];
                     xAxis.removePlotLine(id);
                     var yAxis = $.myApp.detailChart.yAxis[0];
                     yAxis.removePlotLine(id);

                     // Setup events handling for both
                     // x & y axis plotlines
                     var events = {
                         // Change the mouse cursor to pointer
                         // when the mouse is hovered above
                         // the plotlines
                         mouseover: function() { ... },

                         // Launch modify dialog when
                         // click on a plotline
                         click: function(evt) { ... }
                     };

                     // Create the plot lines for the stop
                     // order
                     xAxis.addPlotLine({
                         value: order.expire,
                         width: 2,
                         events: events,
                         color: (order.stopOrder == 'buy') ? $.myApp.boughtColor : $.myApp.soldColor,
                         id: id,
                         // Over both line series and
                         // plot line
                        zIndex: 3
                     });

                     yAxis.addPlotLine({
                         value: order.price,
                         width: 2,
                         color: (order.stopOrder == 'buy') ? $.myApp.boughtColor : $.myApp.soldColor,
                         id: id,
                         zIndex: 3,
                         events: events,
                         label: {
                             text: ((order.stopOrder == 'buy') ? 'SO-B by (' : 'SO-S by (')  + Highcharts.dateFormat("%e %b %Y", parseInt(order.expire)) + ') @ ' + order.price,
                             align: 'right'
                         }
                      });

                      $('#dialog').dialog("close");
                 }
              }, {
                 text: "Cancel",
                 click: function() {
                      $('#dialog').dialog("close");
                 }
              }]
           });
The dialog box setup code is slightly more complicated. In the Save Order button's handler, it performs several tasks, as follows:
- It extracts the input values from the dialog box.
- It checks whether the dialog box is opened with a specific stop order
id. If not, then it assigns a new stop orderidand stores the values withidinto$.myApp.stopOrders. - It removes any existing plot lines that match with
id, in case we modify an existing stop order. - It sets up the
clickandmouseoverevents handling for both x- and y-axis plot lines. - It creates x and y plot lines in the detail chart with the events definitions constructed in step 4.
One scenario with stop orders is that users may want to change or delete a stop order before the condition is fulfilled. Therefore, in step 4 the purpose of the click event on plot lines is to bring up a modify dialog box. Additionally, we want to change the mouse cursor to a pointer when hovering over the plot lines to show that it is clickable.
To change the mouse cursor over the plot lines, we define the mouseover event handler, as follows:
mouseover: function() {
$.each(this.axis.plotLinesAndBands,
function(idx, plot) {
if (plot.id == id) {
plot.svgElem.element.style.cursor =
'pointer';
return false;
}
}
);
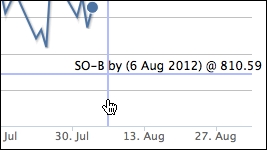
},The 'this' keyword contains an axis object that the hovered plot line belongs to. Since there can be multiple plot lines in each axis, we need to loop through the array of plot lines and plot bands that can be found in the plotLinesAndBands property inside the axis object. Once we have found the target plot line by matching id, we will dig into the internal element and set the cursor style to 'pointer'. The following screenshot shows a mouse cursor hovered over the plot line:
The click event for plot lines launches the Modify Stop Order dialog box for a stop order:
           // Click on the prompt line
           click: function(evt) {
               // Retrieves the stop order object stored in
               // $.myApp.stopOrders
               $('#dialog').dialog("option",
                                   "stopOrderId", id);
               var stopOrder = $.myApp.stopOrders[id];

               // Put the settings into the stop order form
               $('#dialog').dialog("option", "title",
                                   "Modify Stop Order");
               $('#price').val(
                   Highcharts.numberFormat(
                            stopOrder.price, 2));

               $('#stopOrder').val(stopOrder.stopOrder);
               $('#shares').val(stopOrder.shares);
               $('#expire').val(
                   Highcharts.dateFormat("%m/%d/%y",
                            stopOrder.expire));

               // Add a remove button inside the dialog
               var buttons =
                   $('#dialog').dialog("option", "buttons");
               buttons.push({
                   text: 'Remove Order',
                   click: function() {
                       // Remove plot line and stop order
                       // settings
                       delete $.myApp.stopOrders[id];
                       var xAxis =
                           $.myApp.detailChart.xAxis[0];
                       xAxis.removePlotLine(id);
                       var yAxis =
                           $.myApp.detailChart.yAxis[0];
                       yAxis.removePlotLine(id);

                       // Set the dialog to original state
                       resetDialog();
                       $('#dialog').dialog("close");
                   }
               });

               $('#dialog').dialog("option",
                                   "buttons", buttons);

               $('#dialog').dialog("open");
           }
The click event handler simply retrieves the stop order settings and puts the values inside the Modify Stop Order dialog box. Before launching the dialog box, add a Remove Order button into the dialog box that the button handler calls removePlotLine, with the plot line id. The following is a screenshot of the Create Stop Order dialog box: