In the first edition of this book, we mentioned a number of technologies that can be used to produce chart images purely on the server side. Within those technologies, PhantomJS is the most prominent. In a nutshell, it is a standalone program that is capable of running JavaScript on the server. Besides this, it is easy to use, has minimum setup, and is programmable and robust.
The alternative approach was to use Rhino, a Java implementation of the JavaScript engine, to run JavaScript on the server side so that Highcharts can be run on the server side to export a chart into an SVG file. Then, the SVG file is forwarded to Batik, a generic Java-based SVG toolkit, to produce an image file from SVG.
Since then, Highcharts have extensively experimented with different approaches and concluded that incorporating PhantomJS is the solution moving forward. There are a number of reasons for this decision. First, Rhino has rendering problems compared to PhantomJS, which makes PhantomJS a better choice. Moreover, PhantomJS can also export images, although it has scalability issues in rendering charts when the number of data points increases to around 1,500. ImageMagick, the image converter, was also considered, but it also has specific performance and reliability issues. For details of the findings, please see http://www.highcharts.com/component/content/article/2-articles/news/52-serverside-generated-charts#phantom_usage.
For a server-side solution required to implement in Java, Batik is a more natural choice for formatting SVG, whereas PhantomJS is launched to run Highcharts for SVG content. As for a non-Java approach, PhantomJS itself is good enough to drive the whole server-side solution.
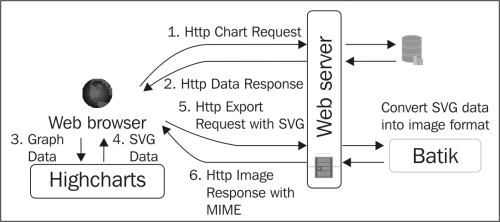
Batik is part of the Apache foundation projects, http://xmlgraphics.apache.org/batik/. Its purpose is to provide a web service to view, generate, and transform SVG data. For instance, Highcharts uses this third-party software to convert SVG data into an image format. When the user clicks on the export button, Highcharts internally forwards the chart's SVG data and the user-selected image format request to Batik.
Then, Batik receives the SVG data and transforms the data into the desired image format. The following diagram summarizes how a normal Highcharts chart uses the export service with Batik:
To install Batik, download the latest distribution from http://xmlgraphics.apache.org/batik/download.html#binary and follow the installation instructions. As for Ubuntu, simply do:
apt-get install libbatik-java
Out of the entire Batik package, we only need the image converter component, which is the batik-rasterizer.jar file. To transcode from an SVG to a PNG file, we can use the following command:
java -jar batik-rasterizer.jar chart.svg
The preceding command will convert chart.svg and create chart.png in the same directory.
A webkit is basically the backend engine that drives browsers such as Safari and Google Chrome. It implements almost everything in HTML5 except the browser's user interface. PhantomJS (found at http://phantomjs.org/, created and maintained by Ariya Hidayat) is a headless webkit, which means that the webkit engine can be run as a standalone program. It is useful in a number of ways, and one of them is server-side SVG rendering.
Although Highcharts released a PhantomJS script to export charts on the server side, it is worth understanding the concept of PhantomJS and how it works. Suppose we already have a web server and PhantomJS installed and running. To run an HTML page on PhantomJS from a command line, run the following command:
phantomjs loadPage.js
The loadPage.js page can be as simple as this:
var page = require('webpage').create();

page.onError = function(msg, trace) {
    console.error(msg);
    phantom.exit(1);
};

page.onConsoleMessage = function(msg) {
    console.log(msg);
};

page.open('http://localhost/mychart.html', function(status) {
    if (status === 'success') {
        console.log('page loaded'),
        phantom.exit();
    }
});
Inside the PhantomJS process, it first loads the webpage module and creates a page object.
The page.onError and page.onConsoleMessage methods redirect the page's error and output messages to the terminal output via console.log. Note that console.log in this instance is referring to our terminal console. If console.log is called inside a page, it will only stay within the page object life cycle and we will never see those messages unless page.onConsoleMessage is defined to redirect them.
The preceding script only opens the HTML page into a webpage object and then terminates, which is not particularly useful.
Let's use PhantomJS in a slightly more advanced way. In PhantomJS, we don't need to rely on a web server to serve a page. Instead, we load a Highcharts page file locally and include the series data from another JSON file. Then, we render the result into an image file. So here is how we will run the server-side script on a command line:
phantomjs renderChart.js chart.html data.json chart.png
The chart.html page is just a simple Highcharts page that we would normally create. In this exercise, we will leave the series data as a variable, seriesData. The following shows how we structure the chart.html page:
<html>
<head>
<meta> ....
<script src='..../jquery.min.js'></script>
<script src='..../Highcharts.js'></script>
<script type='text/javascript'>
$(function () {
$(document).ready(function() {
chart = new Highcharts.Chart({
chart: {
....
},
plotOptions: {
....
},
....,
series: [{
name: 'Nasdaq',
data: seriesData
}]
});
});
});
</script>
</head>
<body>
<div id="container" ></div>
</body>
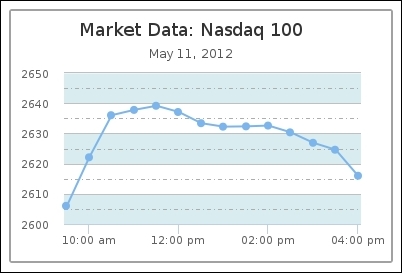
</html>Then, data.json is just a simple JSON file containing the array of x and y series data. Here is some of the content:
[[1336728600000,2606.01],[1336730400000,2622.08],
 [1336732200000,2636.03],[1336734000000,2637.78],
 [1336735800000,2639.15],[1336737600000,2637.09],
 ....
For the PhantomJS file, renderChart.js, it is surprising how little extra code (highlighted in bold) we need to add to achieve the result:
var page = require('webpage').create(),
    system = require('system'),
    fs = require('fs'),

// Convert temporary file with series data – data.json
var jsonData = fs.read(system.args[2]);
fs.write('/tmp/data.js', 'var seriesData = ' + jsonData + ';'),

page.onError = function(msg, trace) {
    console.error(msg);
    phantom.exit(1);
}

page.onConsoleMessage = function(msg) {
    console.log(msg);
};

// initializes the seriesData variable before loading the script
page.onInitialized = function() {
     page.injectJs('/tmp/data.js'),
};

// load chart.html
page.open(system.args[1], function(status) {
    if (status === 'success') {
        // output to chart.png
        page.render(system.args[3]);
        phantom.exit();
    }
});
We first load the system and fs modules, which are used in this example to select command-line arguments and process file I/O on the JSON file. The script basically reads (fs.read) the content of the JSON file and converts the content into a JavaScript expression and saves (fs.write) it in a file. Then, we define the onInitialized event handler for the page object that is triggered before the URL is loaded. So, we insert (injectJs) the JavaScript expression of seriesData before the page object loads the chart.html page. Once the page is loaded, we export (page.render) the page content into an image file.
Notice that the resulting image file is not quite correct in that the line series is actually missing. However, if we observe the image more carefully, actually the line has just started being drawn (see the following screenshot):
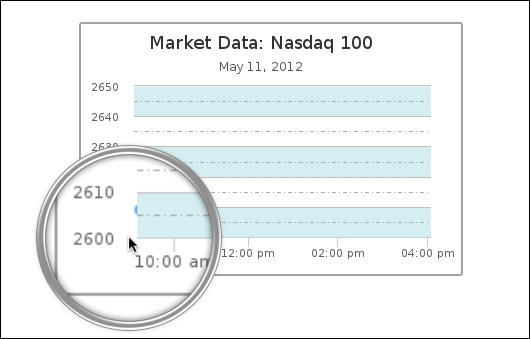
This is because of the chart default animation settings. After we turn the initial animation off by setting the plotOptions.series.animation option to false, the line series appears: