
Ready to dive a little deeper into understanding the Bluemix platform? Yes? Great! Let us get started by looking at what you will get to learn in this chapter. In this chapter, you will learn how to compose an extensible application by using services from the Bluemix catalog; we will take you through this using a sample application. We will also learn what continuous delivery is and how would you should be configuring your application to achieve continuous delivery using the DevOps services provided on the Bluemix platform. You will also learn how to extend this application easily to incorporate more functional capabilities.
In this chapter, we will be covering the following topics:
- DevOps services and the delivery pipeline
- Configuring the delivery pipeline for your application
- Configuring continuous delivery for your application
- Extending the application
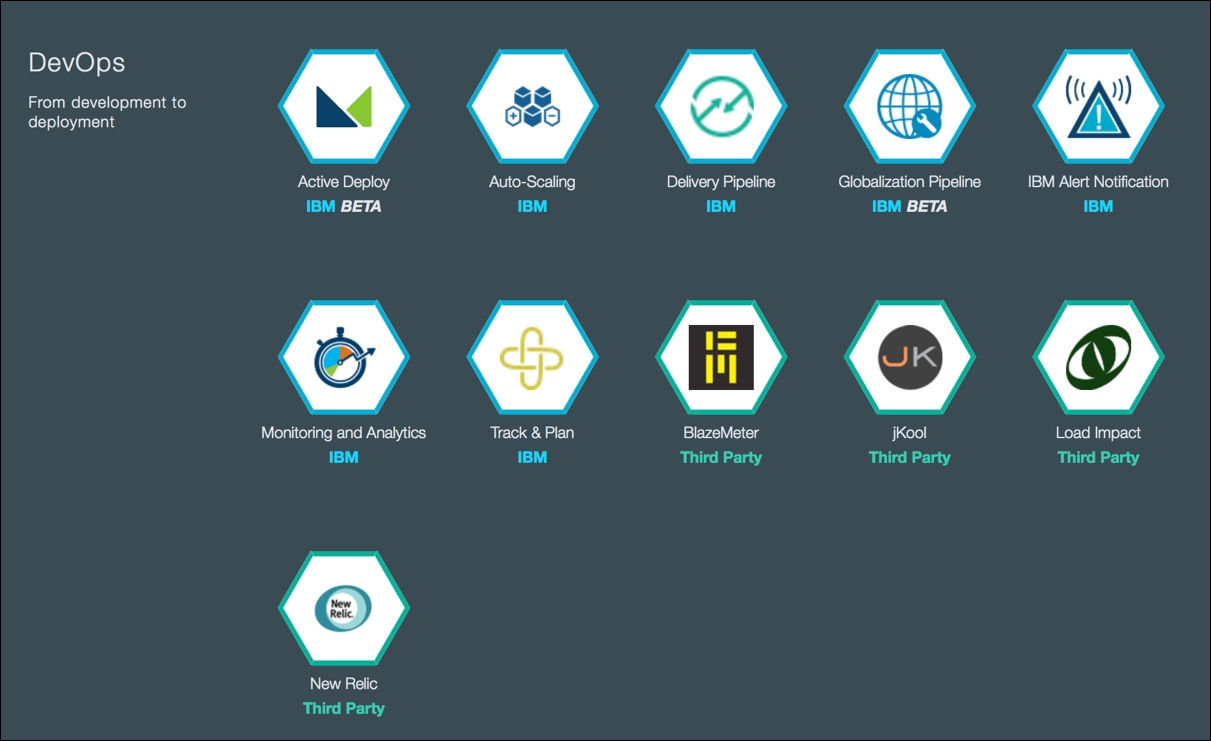
The delivery pipeline is the mechanism for configuring continuous delivery in the agile application development and deployment lifecycle. The delivery pipeline is a service in the DevOps category. A suite of other services are also available under the DevOps category on Bluemix. The services available in this category at the time of writing this book is as shown in the following screenshot:
Before we look at how to configure the delivery pipeline, we will need to create an application that we will use for illustration. So let us get started by creating a starter application by using a boilerplate, as we did in the previous chapter. This time, we will use the Internet of Things boilerplate to create the starter application. We have chosen this boilerplate for few reasons, as follows:
- Understanding how to write applications that are wired and not coded
- Getting a feel for writing or wiring applications in Node-RED
- Using IBM's Internet of Things capabilities, which can be used to create applications that work with device data.
Having finished Chapter 2 , Building and Deploying Your First Application on IBM Bluemix, you will be now well-versed in creating an application using boilerplate; hence, we will not be going through all the steps of application creation in detail in this section.
URLs for accessing the new Bluemix console are as follows:
|
Datacenter |
URL |
|
United States | |
|
United Kingdom | |
|
Sydney |
Follow these steps to create the sample application; the sample application will be an Internet of Things example application:
- Log in to your Bluemix account and choose the Space where you want to create your application:

- Make sure the region you are in is either US South or United Kingdom. Switch the region if you are in the Sydney region.
- Click Compute.
- Choose Cloud Foundry Applications.
- Click the + icon above Get Started Now:

- In the Search field, type
Internet of Things. - Click the boilerplate displaying Internet of Things Platform Starter:

- Fill out the fields as shown in the following screenshot. Make sure your App name is unique if your Host name is defaulted to the App name field:

- You will see that SDK for Node.js is the runtime created, and Cloudant NoSQL DB is the database service that will be added to your Space once you click CREATE.
Your application is created and started along with the services in the boilerplate-Cloudant NoSQL DB, in this case:

Before we look at the application we just deployed, let us understand what Node-RED is and how to compose applications using the Node-RED editor.
Node-RED is a community-based tool that is used to wire APIs, services, or devices in ways that create innovative applications. Applications developed with Node-RED run on Node.js runtime.
Note
Find out more about Node-RED by going to http://nodered.org .
Node-RED provides a browser-based editor to compose or wire applications. The components that can be wired together are displayed in the editor palette and are called nodes. The list of nodes available in the palette is extensible; you can write your own nodes, add them to your Node-RED package, and even contribute them to the community.
Note
To find out more about how to extend your Node-RED palette, you can refer to http://nodered.org/docs/creating-nodes/ .
With this introduction to Node-RED, let us start from where we left off in our previous section:
- Click the route that is created for your application, which is http://bm-learning-03-01.eu-gb.mybluemix.net, in the case of the following screenshot:

- On the page that is displayed after clicking the application route, click Go to your Node-RED flow editor:

This welcome page can be modified to suit your application, if you desire.
- Click Go to your Node-RED flow editor to open the Node-RED editor:
- Double-click on each node to configure it.
- Click Deploy to deploy your application on Bluemix.
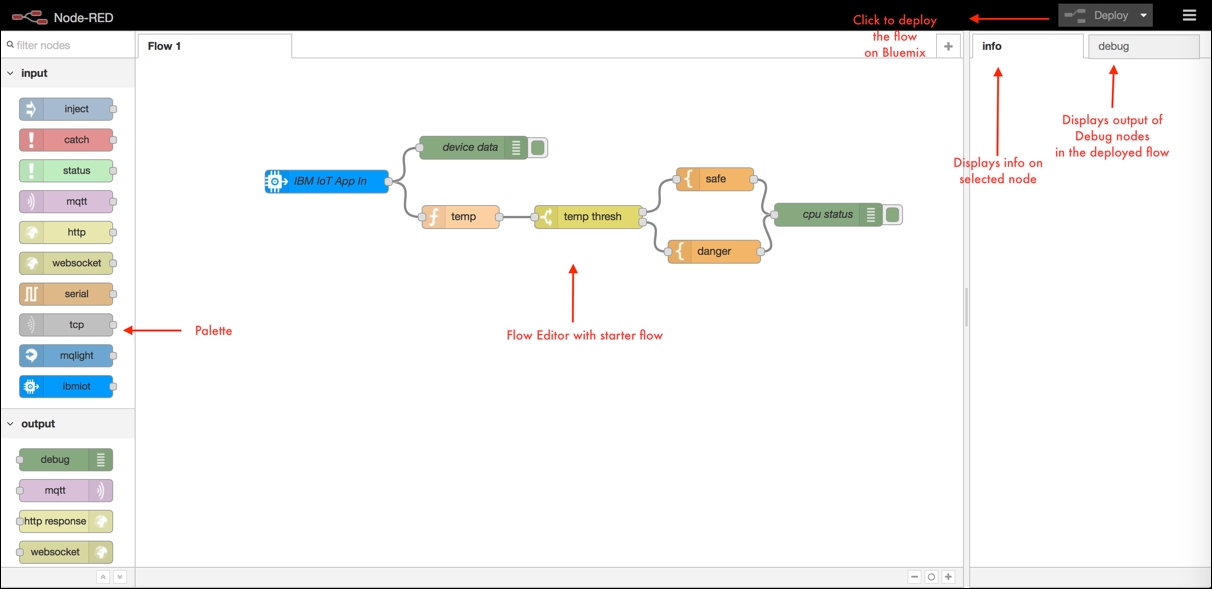
Since we have used the Internet of Things boilerplate to reach the Node-RED editor, you will see that a starter application has already been created by Bluemix.
This starter application reads device data using the IBM Internet of Things node. The device data is expected to push temperature readings to the flow. This is then checked for its value, and if the value is below a certain reference value, the output indicates safe limits. If the temperature is above the reference range, the output indicates it as critical. In the starter application, the output is pushed to the debug node, which can be seen in the debug window. Let us first understand this flow in detail by looking at each node and its configuration:

The ibmiot node is an input node that receives data from devices using IBM Internet of Things Foundation. The detailed information on this node can be seen in the info tab after selecting the node in the flow editor.
Configuring the ibmiot node
Double-click on the node to open its configuration window, which is as shown in the following screenshot:

You will see that you can specify the Authentication mechanism to connect to your device, define the Input type for the trigger or data that you want to listen to, configure the Device Id of the device you want to receive data from, and the node Name field, where you can specify the name of your ibmiot node in the flow.
In this starter application example, we will be using a mock device for which we will be using the quickstart facility of the IBM Internet of Things Foundation. Hence, you will see that the Authentication field is left with the value of Quickstart, Input Type with the value of Device Event, and Name with the value of IBM Iot App In. To configure the Device Id field, go to
https://quickstart.internetofthings.ibmcloud.com/iotsensor/
to get a mock device.
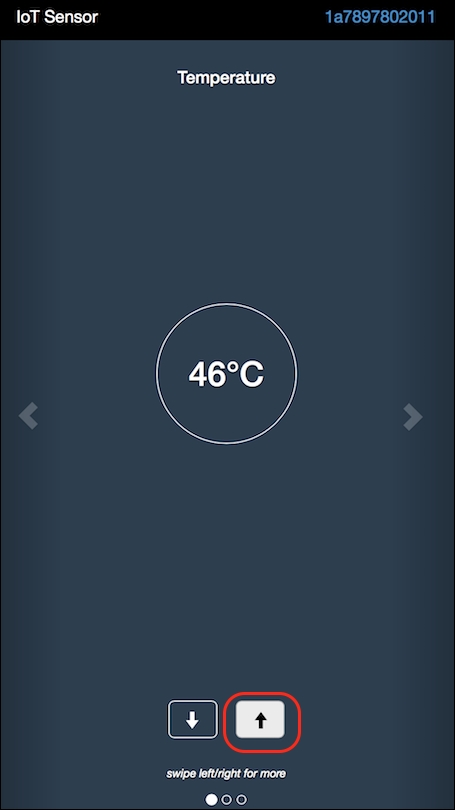
You will be provided with a simulated sensor device that outputs temperature, humidity, and object temperature:

The identifier on the top right-hand corner, as shown in the following screenshot, is the device identifier for this simulated device. This is the identifier that you will need to input to the Device Id field in the ibmiot configuration dialog box:

Click Ok. This will enable the Deploy button. Click Deploy to deploy the change to Bluemix:

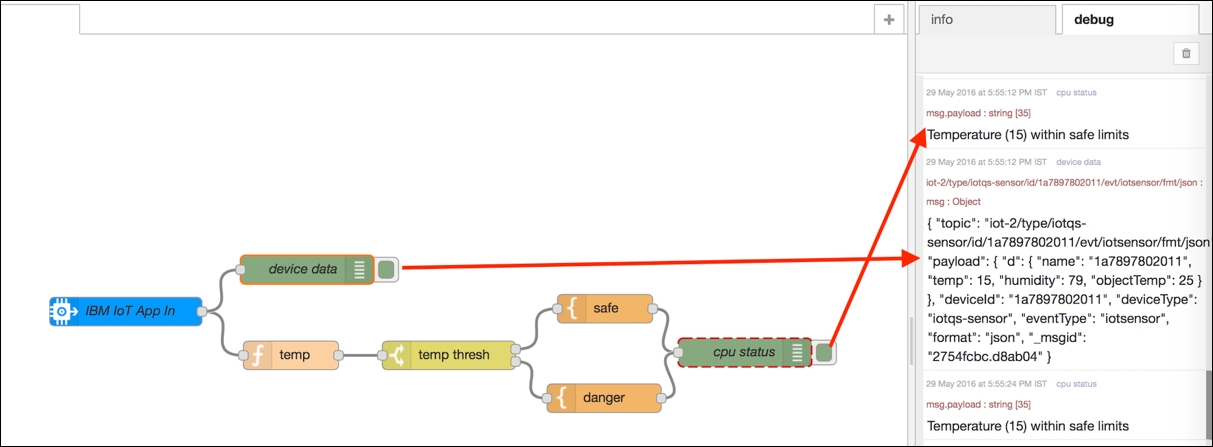
The output of any node is displayed on the debug tab of the sidebar of the flow editor by using the debug node in the flow, as shown. In this starter application flow, two debug nodes are wired, named device data and cpu status. The device data debug node outputs the device data received by the ibmiot node. The cpu status debug node outputs the final results as a result of execution of the logic written within the function nodes and formats specified within the template nodes.
The following screenshot shows the output from the two debug nodes in the flow, in the debug editor, after the Device Id field is configured in the ibmiot node:
You can use the function node to write code to manipulate the message passed as a JavaScript Object. For this starter application, the function node carries the code, as shown in the following screenshot. The temperature is extracted from the message payload and passed on to the next node:

Note
For more information about working with the function node, you can refer to http://nodered.org/docs/writing-functions.html .
This node is used to route messages based on the value of the property in the message object. Routes are defined by defining rules on the switch node. The number of rules defined creates an equal number of output endpoints on the node, which can be wired to define individual flows paths. In this starter application, the switch node is used to check the temperature value from the input message object and define rules based on the temperature threshold value of 40 degrees:

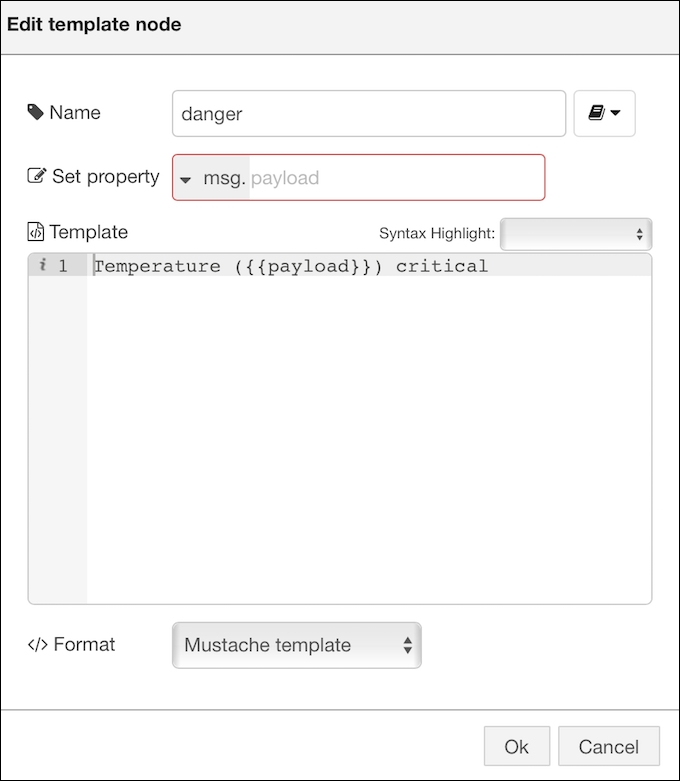
This node is used to display the property based on the template provided. In the starter application flow, we see there are two template nodes, safe and danger. Both of these nodes display the temperature property based on the template definition; the following screenshot shows the configuration for the safe node:

The following screenshot shows the configuration for the danger node:
Let us see how we can configure the delivery pipeline for the application we just created, so that any changes to the application can reflect automatically in the deployed application. Complete the following steps to configure the delivery pipeline:
- From the application Overview page, as described previously, click the Add Git Repo and Pipeline option, as shown in the following screenshot:

- This will create a Git Repository for you. You will need to provide an alias to associate your IBM ID with; this alias is used in Git repository paths and so on:

- Once your alias is created and associated with your IBM ID, click Continue, as shown in the following screenshot:

- Ensure that the checkbox next to Populate the repo with starter app package and enabe the Build & Deploy pipeline is checked. This will populate the Git repository with the source code corresponding to this starter application:

- It will take few seconds to create your Git repository. Once the repository is created, you will see the Git URL below the GIT URL option for your application repository from the Overview page under Continuous Delivery:

- Click on the Git URL. This will take you to the Git repository for your application. You can see the source for this starter application in your repository:

- You can work on the source by clicking the EDIT CODE option. TRACK & PLAN can be used to configure capabilities to project manage your application. This includes creating work items, assigning and tracking them, creating agile sprint plans, and so on:

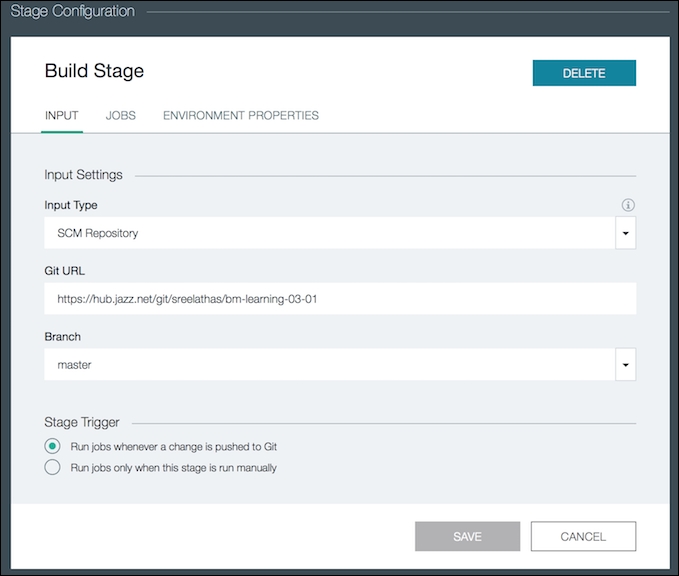
- To configure the continuous delivery pipeline for building and deploying your application on Bluemix triggered by a source change, you can configure the delivery pipeline by clicking BUILD & DEPLOY. The default pipeline configured for your application is as shown in the following screenshot. You will see that a build stage and a deploy stage is configured. The deploy stage contains a deployment script, which has nothing but the cloud foundry commands (cf commands) to push the application to Bluemix:

The build stage is configured to be triggered when there is a Git commit in the repository identified by the Git URL.
- Go to JOBS from the screen shown in the following screenshot, to define the type of build you want to configure:
The available builder types are shown in the following screenshot:
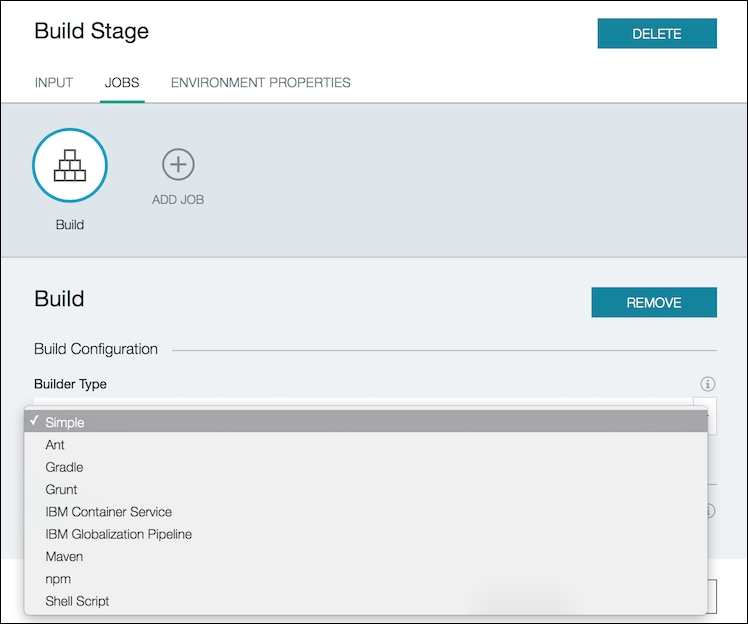
You can configure multiple jobs within the same stage by clicking ADD JOB, as shown in following screenshot:

The types of jobs that you can configure within a stage are as follows:
- Build
- Deploy
- Test
You can use the Test job type to configure tests that need to be run once the build for your application completes.
You can also use ENVIRONMENT PROPERTIES to define properties that need to be used across your jobs from the screen, as shown in the following screenshot:

For this illustration, we will use the default pipeline configuration with one build stage using a Simple Builder type and one deploy stage, which will deploy the built application to a space within your organization on Bluemix. Go to the deploy stage configuration by clicking on the stage configuration icon, as shown in the following screenshot, and clicking Configure Stage from the pop-up menu:

The deploy stage looks like the following screenshot:

The supported deployments, as configured using the Deployer Type values, are as follows:
- Cloud Foundry
- Active Deploy-Begin
- Deploys using IBM Active Deploy to deploy the application to Cloud Foundry or the IBM Container service
- Active Deploy-Complete
- Deploys using IBM Active Deploy to deploy the application to Cloud Foundry on Bluemix, the IBM Container service on Bluemix, or the IBM Virtual Machines infrastructure on Bluemix
- IBM Containers on Bluemix
You can edit the push command in the deployment script of the deploy stage for your application.
You can also configure the deployment of your application to another region, organization, and space by selecting the desired Target, Organization, and Space at the deploy stage.
You can edit the application source using any of the development editors of your choice locally, or you can also edit your application code using the web editor provided by IBM DevOps services. The web editor provided on Bluemix is based on the Eclipse Orion project:
- To edit the starter application code, click EDIT CODE on the page displayed by clicking on the Git URL for your application:

- You can navigate through your source files using the navigation on the left. Once you select the source file that you want to modify, it opens up in an editor to the right, as shown in the following screenshot:

- We will modify the
flow.jsonfile to illustrate the continuous delivery. Modify the template node when the temperature goes above the threshold value. Change the output fromTemperature ({{payload}}) is criticaltoTemperature ({{payload}}) is critical. You will need to take safety measures. Click File | Save:
- Click the Git icon, which is on the left-hand side of the editor, as shown in the screenshot. This will take you to the page that shows the changes to the files that you just made. You can enter a commit message in the box shown and click commit; this will make the changed file available under outgoing changes.
You can click Push to push your changes to the master repository:

- Go to Build & Deploy and you will see that the build stage has been triggered automatically with the source change pushed to master. Successful build has triggered the deploy stage. Successful completion of the deploy stage shows the updated application URL or route, as shown in the following screenshot:

- To be able to view the application update that we just made, we will need to increase the temperature beyond the threshold value, which is 40 degrees centigrade, as defined in the switch node, which we saw earlier.
- To change the temperature on the simulated device, go back to https://quickstart.internetofthings.ibmcloud.com/iotsensor/ and increase the temperature on your device:
- Click the application route to view the application update, by going back your Node-RED editor and viewing the output in the debug tab.
In this section, we looked at a simple example of how to achieve continuous delivery for your application by configuring the stages in the delivery pipeline.