
Delivering customer value
- The marketing and logistics interface
- Delivering customer value
- What is customer service?
- The impact of out-of-stock
- Customer service and customer retention
- Market-driven supply chains
- Defining customer service objectives
- Setting customer service priorities
- Setting service standards
In Chapter 1, the mission of logistics management was defined simply in terms of providing the means whereby customers’ service requirements are met at lowest cost. In other words, the ultimate purpose of any logistics system is to satisfy customers. It is a simple idea that is not always easy to recognise if you are a manager involved in activities such as production scheduling or inventory control, which may seem to be some distance away from the marketplace. The fact is of course that everybody in the organisation has a stake in customer service. Indeed, many successful companies have started to examine their internal service standards in order that everyone who works in the business understands that they must service someone – if they don’t, why are they on the payroll?
The objective should be to establish a chain of customers that links people at all levels in the organisation directly or indirectly to the marketplace.1 Xerox is a company that has worked hard to implement the idea of the internal customer. They have even extended the idea to the point of linking bonuses to an index of customer satisfaction. In organisations like Xerox, managing the customer service chain through the business and onwards is the central concern of logistics management.
The marketing and logistics interface
Even though textbooks describe marketing as the management of the ‘Four Ps’ – product, price, promotion and place – it is probably true to say that, in practice, most of the emphasis has always been placed on the first three. ‘Place’, which might better be described in the words of the old cliché, ‘the right product, in the right place at the right time’, was rarely considered part of mainstream marketing.
There are signs that this view is rapidly changing, however, as the power of customer service as a potential means of differentiation is increasingly recognised. In more and more markets the power of the brand has declined and customers are more willing to accept substitutes; even technology differences between products have been reduced so that it is harder to maintain a competitive edge through the product itself. In situations like this it is customer service that can provide the distinctive difference between one company’s offer and that of its competitors.
Two factors have perhaps contributed more than anything else to the growing importance of customer service as a competitive weapon. One is the continual increase in customer expectations: in almost every market the customer is now more demanding, more ‘sophisticated’, than, say, 50 years ago. Likewise, in industrial purchasing situations we find that buyers expect higher levels of service from vendors, particularly as more companies convert to JIT logistics systems.
The second factor is the slow but inexorable transition towards ‘commodity’ type markets. By this is meant that increasingly the power of the ‘brand’ is diminishing as the technologies of competing products converge, thus making product differences difficult to perceive – at least to the average buyer. Take, for example, the current state of the market for laptop computers. There are many competing models which in reality are substitutable as far as most would-be purchasers are concerned.
Faced with a situation such as this, the customer may be influenced by price or by ‘image’ perceptions, but overriding these aspects may well be ‘availability’ – in other words, is the product in stock, can I have it now? As availability is clearly an aspect of customer service, we are in effect saying that the power of customer service is paramount in a situation such as this. This trend towards the service-sensitive customer is as apparent in industrial markets as it is in consumer markets. Hence companies supplying the car industry, for example, must be capable of providing JIT deliveries direct to the assembly line; similarly a food manufacturer supplying a large supermarket chain must have an equivalent logistics capability, enabling it to keep the retail shelf filled whilst minimising the amount of inventory in the system. The evidence from across a range of markets suggests that the critical determinant of whether orders are won or lost, and hence the basis for becoming a preferred supplier, is customer service. Time has become a far more critical element in the competitive process. Customers in every market want ever-shorter lead-times; product availability will overcome brand or supplier loyalty – meaning that if the customer’s preferred brand is not available and a substitute is, then the likelihood is a lost sale.
Delivering customer value
Ultimately the success or failure of any business will be determined by the level of customer value that it delivers in its chosen markets. Customer value can be defined quite simply as the difference between the perceived benefits that flow from a purchase or a relationship and the total costs incurred. Another way of expressing the idea is as follows:

‘Total cost of ownership’ rather than ‘price’ is used here because in most transactions there will be costs other than the purchase price involved. For example, inventory carrying costs, maintenance costs, running costs, disposal costs and so on. In business-to-business markets particularly, as buyers become increasingly sophisticated, the total costs of ownership can be a critical element in the purchase decision. ‘Life-cycle costs’, as they are referred to in the military and defence industries, have long been a critical issue in procurement decisions in those markets. Figure 2.1 shows the ‘iceberg’ effect of total costs of ownership where the immediate purchase price is the only aspect of cost that is visible, whereas below the surface of the water are all the costs that will arise as a result of the purchase decisions.
Figure 2.1 The total cost of ownership

In the same way that the total cost of ownership is greater than the initial purchase price, so too the benefits that are perceived to flow from the purchase or the relationship will often be greater than the tangible product features or functionality. For example, there may be little difference between two competitive products in terms of technical performance, but one may be superior to the other in terms of the customer support that is provided.
One way to define ‘competitive advantage’ is simply that the successful companies will generally be those that deliver more customer value than their competitors. In other words, their ratio of benefits to costs is superior to other players in that market or segment.
Logistics management is almost unique in its ability to impact both the numerator and the denominator of the customer value ratio. This point becomes clearer if we expand the ratio as follows:

Source: Johansson, H.J. et al., Business Process Re-engineering, John Wiley, 1993.
Each of the four constituent elements can briefly be defined as follows:
| Quality: | The functionality, performance and technical specification of the offer. |
| Service: | The availability, support and commitment provided to the customer. |
| Cost: | The customer’s transaction costs including price and life cycle costs. |
| Time: | The time taken to respond to customer requirements, e.g. delivery lead-times. |
Each of these elements requires a continuous programme of improvement, innovation and investment to ensure continued competitive advantage.
One company that has built a global leadership position in its markets is Caterpillar, marketing machines and diesel engines for the construction and mining industries. Caterpillar has for many years focused on developing not just its manufacturing capabilities and innovative products but also its customer support and responsiveness. Underpinning these initiatives has been a continuing emphasis on creating superior logistics and supply chain management capabilities. Caterpillar has developed a world-class reputation for customer support, in particular its guarantee to provide 48-hour availability of parts no matter how remote the location. In the industries where Caterpillar’s equipment is used, the cost of ‘down-time’ can be significant, hence the importance of responsive service. Through close partnership with its worldwide network of dealers and distributors, and through advanced inventory and information management systems, Caterpillar offers levels of customer support – and thus customer value – that few companies in any industry can match.
What is customer service?
It has been suggested that the role of customer service is to provide ‘time and place utility’ in the transfer of goods and services between buyer and seller. Put another way, there is no value in the product or service until it is in the hands of the customer or consumer. It follows that making the product or service ‘available’ is what, in essence, the distribution function of the business is all about. ‘Availability’ is in itself a complex concept, impacted upon by a galaxy of factors which together constitute customer service. These factors might include delivery frequency and reliability, stock levels and order cycle time, for example. Indeed it could be said that ultimately customer service is determined by the interaction of all those factors that affect the process of making products and services available to the buyer.
In practice, we see that many companies have varying views of customer service. LaLonde and Zinszer2 in a major study of customer service practices suggested that customer service could be examined under three headings:
- Pre-transaction elements
- Transaction elements
- Post-transaction elements
The pre-transaction elements of customer service relate to corporate policies or programmes, e.g. written statements of service policy, adequacy of organisational structure and system flexibility. The transaction elements are those customer service variables directly involved in performing the physical distribution function, e.g. product and delivery reliability. The post-transaction elements of customer service are generally supportive of the product while in use, for instance, product warranty, parts and repair service, procedures for customer complaints and product replacement.
Table 2.1 indicates some of the many elements of customer service under these three headings.
Table 2.1 The components of customer service
In any particular product/market situation, some of these elements will be more important than others and there may be factors other than those listed above which have a significance in a specific market. Indeed the argument that will be developed later is that it is essential to understand customer service in terms of the differing requirements of different market segments and that no universally appropriate list of elements exists: each market that the company services will attach different importance to different service elements.
It is because of the multivariate nature of customer service and the widely differing requirements of specific markets that it is essential for any business to have a clearly identified policy towards customer service. It is surprising perhaps that so few companies have defined policies on customer service, let alone an organisation flexible enough to manage and control that service, when it is considered that service can be the most important element in the company’s marketing mix. A considerable body of evidence exists which supports the view that if the product or service is not available at the time the customer requires it and a close substitute is available then the sale will be lost to the competition. Even in markets where brand loyalty is strong a stock-out might be sufficient to trigger brand switching.
The impact of out-of-stock
One study3 identified that a significant cost penalty is incurred by both manufacturers and retailers when a stock-out occurs on the shelf. The research found that on a typical day a shopper in the average supermarket will face stock-outs on 8 per cent of items in the categories studied. The reaction of customers when faced with a stock-out was highlighted by the same study. As Figure 2.2 illustrates, over one-quarter of shoppers bought a different brand and 31 per cent said they would shop elsewhere for that product. This represents bad news for both the manufacturer and the retailer. Even worse, other research4 has suggested that over two-thirds of shopping decisions are made at the point of purchase, i.e. the purchase is triggered by seeing the product on the shelf. If the product is not on the shelf then the purchase will not be triggered. Persistent stock-outs can also permanently drive customers away from the brand and/or the store. The potential loss of business for both manufacturers and retailers caused by out-of-stock situations is clearly significant.
Figure 2.2 Shopper behaviour when faced with a stock-out

Source: Reprinted with permission of Harvard Business Review, from ‘Stock-outs cause walkouts’ by Corsten, D. and Gruen, T. Copyright © 2004 by Harvard Business Review
At Procter and Gamble (P&G), the global consumer packaged goods company, they have long focused on what they call ‘the two moments of truth’. The first occurs when the shopper enters the store: is the appropriate P&G product on the shelf? The second occurs when the product is used by the consumer – is the experience a good one? The argument is that the company will never get to the second moment of truth if they don’t achieve the first one. Hence for many years P&G have focused not just on product innovation – to ensure that the second moment of truth happens – but also on designing world-class supply chains so that on-the-shelf availability is maximised.
The impact of poor on-the-shelf availability is highlighted in the case of Sainsbury’s in the box below.
The impact of out-of-stock: Sainsbury’s
Sainsbury’s is one of the UK’s leading retailers with a large food and non-food business. Founded in 1869 the company was once the market leader until overtaken in the mid-1990s by Tesco. By the year 2000, the gap between Tesco and Sainsbury’s had widened further and the company took the decision that both new management and a new approach to their supply chain was required. Under the direction of the then CEO, Peter Davis, plans for a major supply chain transformation project were approved The actions to be taken included the building of four state-of-the-art fully automated warehouses (known as ‘fulfilment factories’) with more to follow, and a complete overhaul of the IT systems that underpinned the supply chain. The design and management of the IT system was outsourced to Accenture in one of the biggest deals of its type at the time.
Internally, the transformation programme came to be known as the ‘7 in 3’ project. The reason for this, reputedly, was that it was a project that everyone felt would need at least seven years to implement and yet the need was to do it in three years because of the competitive pressure.
Perhaps inevitably, when the system went live in 2003 there were major problems. The high-tech machines in the automated fulfilment factories were breaking down regularly and the information system was not delivering the expected benefits.
The impact of the problems on Sainsbury’s retail outlets was significant – in particular the effect on stock levels on the shelf. At the height of the problems as many as 2,000 of 25,000 items stocked in a typical Sainsbury’s store were out-of-stock. At the individual item level, the average stock availability was 90%, meaning that the company was losing 10% of possible sales for that item. The impact on profit was considerable and the company’s share price continued to fall. At the end of March 2004, a new CEO, Justin King, was appointed with a mandate to halt the slide in shareholder value.
King recognised that the continued decline in on-the-shelf product availability was driving customers away from the stores. Research amongst customers showed that the levels of product availability were of major concern. One of the features of the UK retail environment is the presence of a large number of ‘promiscuous’ shoppers, i.e. those who would shop regularly at different stores. For example, at the time it was estimated that Tesco and Sainsbury’s shared something like 30% of their shoppers. Hence any deterioration in the customer experience at the store level can easily lead to a large-scale shift in patronage.
One of King’s first actions was to halt the supply chain transformation programme and appoint a new Supply Chain Director, Lawrence Christensen, an experienced hands-on retail distribution professional. Christensen immediately set out to understand the root causes of the problems. The technical issues with the hardware were obvious. However, Christensen believed that a major cause of the stock-out problems was the inadequate in-store processes for monitoring on-the-shelf availability. It appeared that the accuracy of the data that was being captured was extremely low and as a result the new IT systems were making inappropriate replenishment decisions.
Upon re-engineering the fundamental in-store processes for checking stock levels at one pilot store, the number of out-of-stock items shrank from 2,000 to 700. These improved processes were rapidly rolled out over all Sainsbury’s stores. At the same time, the decision was taken to introduce hand-held electronic devices to all stores so that more frequent and more accurate monitoring of stock levels could be achieved.
Very quickly the volume of sales across the Sainsbury’s chain began to increase and improved availability was widely recognised as a critical factor in this improvement.
CEO Justin King was quoted as saying that ‘improved availability was a key factor in driving a 2.8 per cent rise in underlying sales excluding petrol in the 16 weeks to October, Sainsbury’s third consecutive quarter of growth’
(source: The Times, October 8, 2005).
In industrial markets, too, the same pressures for improved availability seem to be at work. It is perhaps not surprising that as more and more companies adopt ‘JIT’ strategies, with minimal inventories, they require even higher levels of response from suppliers. The demand is for ever-shorter delivery lead-times and reliable delivery. The pressure on suppliers is further increased as these same customers seek to rationalise their supplier base and to do business with fewer suppliers. Becoming a preferred supplier in any industry today inevitably means that a high priority must be placed on delivering superior customer service.
Many companies have suffered in this new competitive environment because in the past they have focused on the traditional aspects of marketing – product development, promotional activities and price competition. However, whilst these are still necessary dimensions of a successful marketing strategy they are not sufficient. Equally damaging has been the focus on cost reduction that has driven many companies’ operational and logistics strategy – particularly as a result of recession. Cost reduction is a worthy goal as long as it is not achieved at the expense of value creation. Low-cost strategies may lead to efficient logistics but not to effective logistics. More often than not, today the order-winning criteria are those elements of the offer that have a clearly identifiable positive impact upon the customers’ own value-creating processes.
One powerful way of highlighting the impact that customer service and logistics management can have on marketing effectiveness is outlined in Figure 2.3. The suggestion here is that customer service impacts not only on the ultimate end user but also on intermediate customers such as distributors. Traditionally, marketing has focused on the end customer – or consumer – seeking to promote brand values and to generate a ‘demand pull’ in the marketplace for the company’s products. More recently we have come to recognise that this by itself is not sufficient. Because of the swing in power in many marketing channels away from manufacturers and towards the distributor (e.g. the large concentrated retailers) it is now vital to develop the strongest possible relations with such intermediaries – in other words to create a customer franchise as well as a consumer franchise.

The impact of both a strong consumer franchise and a customer franchise can be enhanced or diminished by the efficiency of the supplier’s logistics system. It is only when all three components are working optimally that marketing effectiveness is maximised. To stress the interdependence of these three components of competitive performance it is suggested that the relationship is multiplicative. In other words the combined impact depends upon the product of all three.
Customer service and customer retention
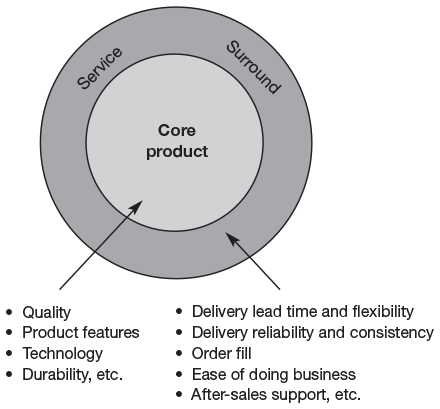
It will be apparent from what has been said that organisations that compete only on the product’s features will find themselves at a severe disadvantage to those companies that augment the basic product with added-value services. It was one of the leading thinkers in marketing, Theodore Levitt, who first said that ‘people don’t buy products, they buy benefits’.5 The idea behind this statement is that it is the totality of the ‘offer’ that delivers customer value. A simple example would be that a finished product in a warehouse is the same as a finished product in the hands of the customer in terms of its tangible features. Clearly, however, the product in the hands of the customer has far more value than the product in the warehouse. Distribution service in this case has been the source of added value. Figure 2.4 demonstrates this idea, with the concept of the ‘service surround’.
At the centre is the core product, which is the basic product as it leaves the factory. The outer ‘halo’ represents all the added value that customer service and logistics provide. Clearly it is not only customer service and logistics activity that add value; in many cases advertising, branding and the packaging can all enhance the perceived value of the product to the customer. However, it is increasingly evident, as we have seen, that it takes more than branding to differentiate the product.
One of the classic definitions of marketing is that it is concerned with ‘getting and keeping customers’. In practice, if we look at where most organisations’ marketing efforts focus, it is on the ‘getting’ of customers, rather than on the ‘keeping’ of them. Thus an examination of the typical marketing plan will show a bias towards increasing market share rather than towards customer retention. Whilst new customers are always welcome in any business, it has to be realised that an existing customer can provide a higher profit contribution and has the potential to grow in terms of the value and frequency of purchases.
The importance of customer retention is underlined by the concept of the ‘lifetime value’ of a customer. The lifetime value of a customer is calculated as follows:

Clearly if customers can be persuaded to remain loyal to a supplier, their lifetime value can be significantly increased. A further benefit comes from the fact that the longer the customer stays with us the more profitable they become. A study by consulting company Bain and Co6 found that higher customer retention rates correlated strongly with profitability. The reasons for this are that a retained customer typically costs less to sell to and to service. Also as the relationship develops there is a greater likelihood that they will give a greater part of their business to a supplier whom they are prepared to treat as a partner. This is the idea of ‘share of wallet’, whereby the goal is to increase the total spend that is captured by the company. Furthermore, satisfied customers tell others and thus the chance increases that further business from new customers will be generated through this source.
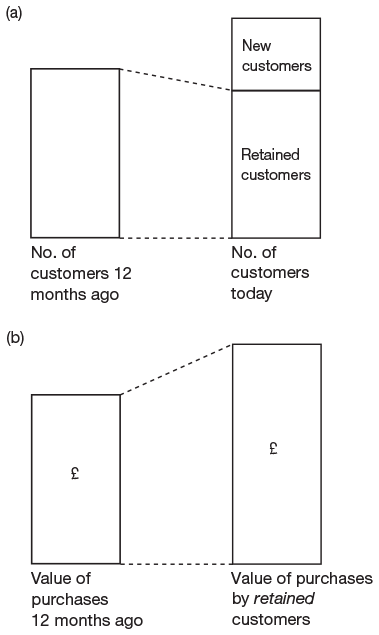
A simple measure of customer retention is to ask the question: ‘How many of the customers that we had 12 months ago do we still have today?’ This measure is the real test of customer retention. It can be extended to include the value of purchases made by the retained customer base to assess how successful the company has been in increasing the overall revenue from these accounts (see Figure 2.5).
A prime objective of any customer service strategy should be to enhance customer retention. Whilst customer service obviously also plays a role in winning new customers it is perhaps the most potent weapon in the marketing armoury for the keeping of customers.
There is rapidly emerging a new focus in marketing and logistics on the creation of ‘relationships’ with customers. The idea is that we should seek to create such a level of satisfaction with customers that they do not feel it necessary even to consider alternative offers or suppliers. Many markets are characterised by a high level of ‘churn’ or ‘promiscuity’ amongst the customer base. In these markets customers will buy one brand on one occasion and then are just as likely to buy another on the next occasion.
The principle behind ‘relationship marketing’ is that the organisation should consciously strive to develop marketing strategies to maintain and strengthen customer loyalty.7 So, for example, an airline might develop a frequent-flyer programme, or a credit card company might award points based upon the value of purchases made with the card that can then be redeemed for cash or awards. At the other extreme, a company like IBM will consciously seek to develop long-term relationships with its customers through training programmes, client seminars, frequent customer communication, and so on.
Market-driven supply chains
Most traditional supply chains were designed to optimise the internal operations of the supplying company. Thus a manufacturer might be motivated to establish supply and distribution arrangements that would enable production efficiencies to be maximised. Typically this would entail manufacturing in large batches, shipping in large quantities and buffering the factory, both upstream and downstream, with inventory. In this way the goal of becoming a ‘low-cost producer’ could be achieved.
Whilst this approach was fine from the perspective of the manufacturing organisation, it clearly did not come anywhere close to being ‘customer-centric’ in the sense of designing the supply chain around the needs of the customer. With the continuing transfer of power in the distribution channel from the producer to the consumer, this conventional philosophy has become less and less appropriate. Now, instead of designing supply chains from the ‘factory outwards’ the challenge is to design them from the ‘customer backwards’.
This new perspective sees the consumer not at the end of the supply chain but at its start. In effect this is the philosophical difference between supply chain management and what more properly might be called ‘demand chain management’.
As Baker8 has suggested:
Managing demand chains is … fundamentally different to managing supply chains. It requires turning the supply chain on its head, and taking the end user as the organisation’s point of departure and not its final destination.
Figure 2.6 shows an appropriate sequence of actions to create a market-driven supply chain.
This sequence begins with an understanding of the value that customers seek in the market in which the company competes. This customer insight will enable the identification of the real market segmentation, i.e. the clusters of customers who share the same value preferences. The Spanish fashion chain Zara provides an excellent example of how market understanding and supply chain excellence can create real value for its target customers.
ZARA: Linking supply chain processes to the value proposition
Zara is one of world’s most successful clothing manufacturers and retailers. They have achieved this leadership position through creating a value proposition around the idea of ‘Fast Fashion’. Almost uniquely, they have developed supply chain processes that enable them to capture ideas and trends in the apparel market and to translate them into products in amazingly short lead-times. Zara’s target time to take an idea from design to store is between three and four weeks.
To achieve this quick response capability, Zara have developed an agile network of closely integrated company-owned and independent manufacturing facilities that have the flexibility to produce in small batches at short notice. While this is not the cheapest way to make a garment, it ensures the achievement of their value proposition.

Identifying customers’ service needs
It is important to remember that no two customers will ever be exactly the same in terms of their service requirements. However, it will often be the case that customers will fall into groups or ‘segments’ that are characterised by a broad similarity of service needs. These groupings might be thought of as ‘service segments’. The logistics planner needs therefore to know just what the service issues are that differentiate customers. Market research can be of great assistance in understanding this service segmentation and it is often surprising to see how little formal research is conducted in this crucial area.
How might such a research programme be implemented?
The first point to emphasise is that customer service is perceptual. Whatever our own ‘hard’ internal measures of service might say our service performance is, perceptions are the reality. We might use measures which, whilst providing useful measures of productivity, do not actually reflect the things the customer values. For example, whilst ‘stock availability’ is a widespread internal measure of performance, a more appropriate external measure from the customer’s viewpoint could be ‘on-time delivery’. Hence it is critical that we develop a set of service criteria that are meaningful to customers.
The approach to service segmentation suggested here follows a three-stage process:
- Identify the key components of customer service as seen by customers themselves.
- Establish the relative importance of those service components to customers.
- Identify ‘clusters’ of customers according to similarity of service preferences.
1 Identifying the key components of customer service
A common failing in business is to assume that ‘we know what our customers want’. However, the truth is that it is so easy to become divorced from the reality of the marketplace when management is consumed with the day-to-day pressures of running a business. How should we know which aspects of service are most highly rated by the customer? Given the complexity of the market that the typical company serves, how might it better understand the segmentation of those markets in terms of service requirements? What does it take for a company to become the supplier of choice?
Clearly it is important to develop an understanding of the service needs of customers through detailed research.
The first step in research of this type is to identify the key sources of influence upon the purchase decision. If, for example, we are selling components to a manufacturer, who in that company will make the decision on the choice of supplier? This is not always an easy question to answer as in many cases there will be several people involved. The purchasing manager of the company to which we are selling may only be acting as an agent for others within the firm. In other cases his or her influence will be much greater. Alternatively, if we are manufacturing products for sale through retail outlets, is the decision to stock made centrally or by individual store managers? The answers can often be supplied by the sales force. The sales representative should know from experience who are the decision makers.
Given that a clear indication of the source of decision-making power can be gained, the customer service researcher at least knows who to research. The question remains as to which elements of the vendor’s total marketing offering have what effect upon the purchase decision.
Ideally once the decision-making unit in a specific market has been identified, an initial, small-scale research programme should be initiated based upon personal interviews with a representative sample of buyers. The purpose of these interviews is to elicit, in the language of the customers, first the importance they attach to customer service vis-à-vis the other marketing mix elements such as price, product quality, promotion, etc., and second the specific importance they attach to the individual components of customer service.
The importance of this initial step in measuring customer service is that relevant and meaningful measures of customer service are generated by the customers themselves. Once these dimensions are defined we can identify the relative importance of each one and the extent to which different types of customer are prepared to trade-off one aspect of service for another.
2 Establishing the relative importance of customer service components
One of the simplest ways of discovering the importance a customer attaches to each element of customer service is to take the components generated by means of the process described in step 1 and to ask a representative sample of customers to rank order them from the ‘most important’ to the ‘least important’. In practice this is difficult, particularly with a large number of components, and would not give any insight into the relative importance of each element. Alternatively a form of rating scale could be used. For example, the respondents could be asked to place a weighting from 1 to 10 against each component according to how much importance they attached to each element. The problem here is that respondents will tend to rate most of the components as highly important, especially since those components were generated on the grounds of importance to customers in the first place. A partial solution is to ask the respondent to allocate a total of 100 points amongst all the elements listed, according to perceived importance. However, this is a fairly daunting task for the respondent and can often result in an arbitrary allocation.
Fortunately a relatively recent innovation in consumer research technology now enables us to evaluate very simply the implicit importance that a customer attaches to the separate elements of customer service. The technique is based around the concept of trade-off and can best be illustrated by an example from everyday life. In considering, say, the purchase of a new car, we might desire specific attributes, e.g. performance in terms of speed and acceleration, economy in terms of petrol consumption, size in terms of passenger and luggage capacity and, of course, low price. However, it is unlikely that any one car will meet all of these requirements so we are forced to trade-off one or more of these attributes against the others.
The same is true of the customer faced with alternative options of distribution service. The buyer might be prepared to sacrifice a day or two of lead-time in order to gain delivery reliability, or to trade-off order completeness against improvements in order entry, etc. Essentially the trade-off technique works by presenting the respondent with feasible combinations of customer service elements and asking for a rank order of preference for those combinations. Computer analysis then determines the implicit importance attached by the respondent to each service element.9
Whatever technique is used, it is important to understand what are the ‘qualifiers’ and the ‘order winners’ amongst the different customer groups. This understanding must then drive the design of the supply chain processes that will enable success in the marketplace.
3 Identifying customer service segments
Now that we have determined the importance attached by different respondents to each of the service attributes previously identified, the final step is to see if any similarities of preference emerge. If one group of respondents, for example, has a clearly distinct set of priorities from another then it would be reasonable to think of them both as different service segments.
How can these customer service segments be identified? One technique that has been successfully used in this connection is cluster analysis, a computer-based method for looking across a set of data and seeking to ‘match’ respondents across as many dimensions as possible. Thus if two respondents completed the step 2 trade-off analysis in a similar way, their importance scores on the various service dimensions would be similar and hence the cluster analysis would assign them to the same group.
One study in an industrial market suggested that the traditional way of segmenting customers according to ‘Standard Industrial Classification’ (SIC) had little relevance to purchasing behaviour. The classic categorisation of customers according to industry sector did not correlate with the attributes they sought from suppliers. Instead it seemed that some companies were very time-sensitive in terms of delivery reliability – a ‘JIT’ segment – regardless of the industry they were in. In the same way there was a very clear ‘price’ segment, which also cut across conventional industrial classifications. A further segment was much more responsive to a ‘relationship’ approach, valuing technical support and close supplier liaison much more highly. As a result of this research, the supplier was better able to focus its marketing efforts and to re-engineer its supply chain strategy to achieve a better match with customer requirements.
The challenge to logistics management is to create appropriate supply chain solutions to meet the needs of these different value segments. More than likely there will be the need for multiple supply chain solutions because ‘one size will not fit all’. This issue will be dealt with in detail in Chapter 6, where the concept of supply chain agility is discussed.
Defining customer service objectives
The whole purpose of supply chain management and logistics is to provide customers with the level and quality of service that they require and to do so at less cost to the total supply chain. In developing a market-driven logistics strategy the aim is to achieve ‘service excellence’ in a consistent and cost-effective way.
The definition of appropriate service objectives is made easier if we adopt the concept of the perfect order. The perfect order is achieved when the customer’s service requirements are met in full. Clearly such a definition is specific to individual customers, but it is usually possible to group customers into segments and then to identify, along the lines described earlier, the key service needs of those segments. The perfect order is achieved only when each of those service needs is met to the customer’s satisfaction.
The measure of service is therefore defined as the percentage of occasions on which the customer’s requirements are met in full. Normally this percentage would be measured across all customers over a period of time. However, it can also be used to measure service performance at the individual customer level and indeed at any level, e.g. segment, country or by distribution centre.
One frequently encountered measure of the perfect order is ‘on-time, in-full’ (OTIF). An extension of this is on-time, in-full and error-free. This latter element relates to documentation, labelling and damage to the product or its packaging. To calculate the actual service level using the perfect order concept requires performance on each element to be monitored and then the percentage achievement on each element to be multiplied together.
For example, if the actual performance across all orders for the last 12 months was as follows:
| On-time | : | 90% |
| In-full | : | 80% |
| Error-free | : | 70% |
the actual perfect order achievement would be:
In other words the likelihood that a perfect order was achieved during the period under review was only 50.4 per cent!
The cost benefit of customer service
All companies have to face a basic fact: there will be significant differences in profitability between customers. Not only do different customers buy different quantities of different products, but the cost to service these customers will typically vary considerably. This issue will be explored more fully in Chapter 4.
The 80/20 rule will often be found to hold: 80 per cent of the revenue of the business come from 20 per cent of the customers. Furthermore, 80 per cent of the total costs to serve will be generated from 20 per cent of the customers (but probably not the same 20 per cent!) Whilst the proportion may not be exactly 80/20, it will generally be in that region. This is the so-called Pareto Law, named after a nineteenth century Italian economist.
The challenge to customer service management therefore is, firstly, to identify the real profitability of customers and then, secondly, to develop strategies for service that will improve the profitability of all customers. What has to be recognised is that there are costs as well as benefits in providing customer service and that therefore the appropriate level and mix of service will need to vary by customer type.
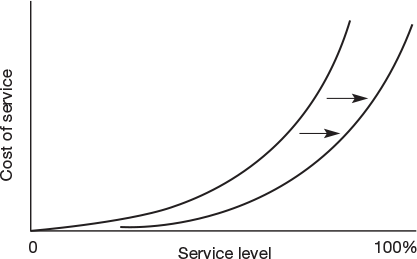
The basic relationship between the level of service and the cost is often depicted as a steeply rising curve (Figure 2.7).
The curve assumes that demand for the item is ‘normally’ distributed, i.e. it takes on the classic bell-shape. A feature of the normal distribution is that once its two key parameters, the mean (![]() ) and standard deviation (σ), are known, the probability of a given value occurring can be easily calculated. Thus, as Figure 2.8 shows, if the distribution depicted describes daily sales for a particular product, it can be calculated that on approximately 68 per cent of occasions total demand would be within plus or minus one standard deviation either side of the mean; on approximately 95 per cent of occasions total demand would lie within plus or minus two standard deviations either side of the mean and on 99 per cent of occasions three standard deviations either side of the mean.
) and standard deviation (σ), are known, the probability of a given value occurring can be easily calculated. Thus, as Figure 2.8 shows, if the distribution depicted describes daily sales for a particular product, it can be calculated that on approximately 68 per cent of occasions total demand would be within plus or minus one standard deviation either side of the mean; on approximately 95 per cent of occasions total demand would lie within plus or minus two standard deviations either side of the mean and on 99 per cent of occasions three standard deviations either side of the mean.

Figure 2.8 Probability of level of sales being within given limits

In calculating how much safety stock is required the inventory manager is only concerned with those occasions when demand is greater than average. If sales are approximately normally distributed, demand will be lower than average approximately 50 per cent of the time, and thus a 50 per cent service level would be maintained with no safety stock. It is on those occasions when demand exceeds the average that safety stock is required. In other words we must focus attention on the area of the curve to the right of the mean. Thus, by setting a stock level one standard deviation greater than the mean, the manager can achieve a service level of approximately 84 per cent. By setting the level two standard deviations greater than the mean the service level would be approximately 98 per cent and with three standard deviations it would be 99.9 per cent (Figure 2.9).
Figure 2.9 Service levels and the normal distribution

What this highlights is that as the desired service level rises, it takes a disproportionate investment in inventory to achieve small incremental improvements in availability.
Table 2.2 below illustrates this effect:
Table 2.2 The relationship between service levels and inventory
| Inventory level | Service level |
| |
50% |
| |
84% |
| |
98% |
| |
99.9% |
- If inventory equivalent to average expected daily demand (
 ) is held then the service level would be 50 per cent.
 - If safety stock equivalent to one standard deviation of demand (σ) is held then the service level would be 84 per cent, etc.
However, if it is possible to find alternative service strategies for servicing customers, say, for example, by speeding up the flow of information about customer requirements and by using faster modes of transport, then the same level of service can be achieved with less inventory – in effect pushing the curve to the right (Figure 2.10). This is the idea of substituting information and responsiveness for inventory. In other words if we can gain earlier warning of customer requirements and our lead-times are short, then we can reduce our reliance on inventory.
Setting customer service priorities
Whilst it should be the objective of any logistics system to provide all customers with the level of service that has been agreed or negotiated, it must be recognised that there will inevitably need to be service priorities. In this connection, the Pareto Law, or 80/20 rule, can provide us with the basis for developing a more cost-effective service strategy. Fundamentally, the service issue is that because not all our customers are equally profitable nor are our products equally profitable, should not the highest service be given to key customers and key products? As we can assume that money spent on service is a scarce resource then we should look upon the service decision as a resource allocation issue.
Figure 2.11 shows how a typical company might find its profits varying by customer and by product.
The curve is traditionally divided into three categories: the top 20 per cent of products and customers by profitability are the ‘A’ category; the next 50 per cent or so are labelled ‘B’; and the final 30 per cent are category ‘C’. The precise split between the categories is arbitrary as the shape of the distribution will vary from business-to-business and from market to market.
The appropriate measure should be profit rather than sales revenue or volume. The reason for this is that revenue and volume measures might disguise considerable variation in costs. In the case of customers this cost is the ‘cost-to-serve’ and we will later suggest an approach to measuring customer profitability. In the case of product profitability we must also be careful that we are identifying the appropriate service-related costs as they differ by product. One of the problems here is that conventional accounting methods do not help in the identification of these costs.

What we should be concerned to do at this stage in the analysis is to identify the contribution to profit that each product (at the individual stock keeping unit (SKU) level) makes. By contribution we mean the difference between total revenue accruing and the directly attributable costs that attach as the product moves through the logistics system.
Looking first at differences in product profitability, what use might be made of the A,B,C categorisation? Firstly it can be used as the basis for classic inventory control whereby the highest level of service (as represented by safety stock) is provided for the ‘A’ products, a slightly lower level for the ‘B’ products and lower still for the ‘Cs’. Thus we might seek to follow the stock holding policy shown below in Table 2.3:
Table 2.3 Stock holding policy
| Product category | Stock availability |
| A | 99% |
| B | 97% |
| C | 90% |
Alternatively, and probably to be preferred, we might differentiate the stock holding by holding the ‘A’ items as close as possible to the customer and the ‘B’ and ‘C’ items further up the supply chain. The savings in stock holding costs achieved by consolidating the ‘B’ and ‘C’ items as a result of holding them at fewer locations would normally cover the additional cost of despatching them to the customer by a faster means of transportation (e.g. overnight delivery).
Perhaps the best way to manage product service levels is to take into account both the profit contribution and the individual product demand.
We can bring both these measures together in the form of a simple matrix in Figure 2.12, which can be explained as follows.
Figure 2.12 Managing product service levels

Quadrant 1: Seek cost reductions
Because these products have high volume it would suggest that they are in frequent demand. However, they are also low in profit contribution and the priority should be to re-examine product and logistics costs to see if there is any scope for enhancing profit.
Quadrant 2: Provide high availability
These products are frequently demanded and they are more profitable. We should offer the highest level of service on these items by holding them as close to the customer as possible and with high availability. Because there will be relatively few of these items we can afford to follow such a strategy.
Quadrant 3: Review
Products in this category should be regularly appraised with a view to deletion from the range. They do not contribute to profits (or at least only marginally) and they are slow movers from a sales point of view. Unless they play a strategic role in the product portfolio of the firm then there is probably a strong case for dropping them.
Quadrant 4: Centralised inventory
Because these products are highly profitable but only sell at a relatively slow rate they are candidates for centralised management. In other words, they should be kept in some central location, as far back up the supply chain as possible in order to reduce the total inventory investment, and then shipped by express transport direct to customers.
This concept of service prioritisation by product can be extended to include customer priorities. Because the same 80/20 rule applies to customers as it does to products, it makes sense to focus resources on key accounts as well as key products.
Figure 2.13 shows that if the 80/20 rule applies both to products and customers then all businesses are actually very dependent upon a very few customers buying a few high profit lines. Indeed the arithmetic is easy:

Which provides:
In other words, just 4 per cent of transactions (measured order line by order line) gives us 64 per cent of all our profit!
How can we make use of this important fact? The first thing is obviously to offer the highest levels of service and availability to key customers ordering key products. At the other end of the spectrum we should constantly review the less profitable customers and the less profitable products. In between there is scope for a degree of pragmatism, perhaps based upon the ‘critical value’ of an item to the customer. This is particularly relevant when developing a service strategy for spare parts. The idea is that if certain items are essential for, say, the operation of a machine where the down-time costs are high then those parts would be accorded a high critical value. If appropriate a ‘weight’ could be assigned on the basis of criticality and the 80/20 ranking based on profit could be adjusted accordingly. Table 2.4 provides an example.
Figure 2.13 Customer service and the 80/20 rule
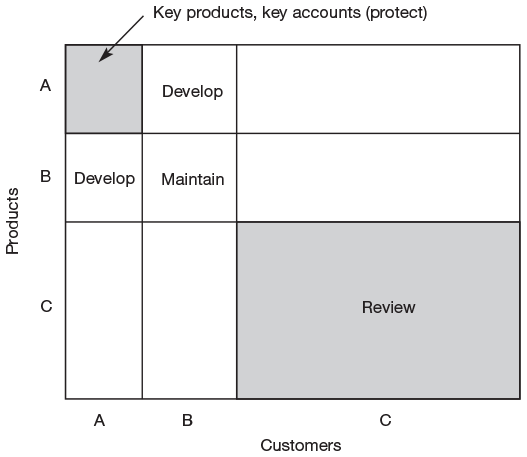
Table 2.4 Critical value analysis

Setting service standards
Obviously if service performance is to be controlled then it must be against predetermined standards.
Ultimately the only standard to be achieved is 100 per cent conformity to customer expectations. This requires a clear and objective understanding of the customers’ requirements and at the same time places an obligation upon the supplier to shape those expectations. In other words, there must be a complete match between what the customer expects and what we are willing and able to provide. This may require negotiation of service standards as clearly it is in neither party’s interest to provide service levels that would lead to a long-term deterioration in profitability – either for the supplier or the customer.
Ideally there should be a service level agreement (SLA) determined jointly by the supplier and the customer. This will provide the benchmark against which actual performance can be measured. What are the customer service elements for which performance standards should be set?
To be effective these standards must be defined by the customers themselves. This requires customer research and competitive benchmarking studies to be conducted so that an objective definition of customer service for each market segment may be identified.
However, for the moment we can indicate some of the key areas where standards are essential:
- Order cycle time
- Stock availability
- Order-size constraints
- Ordering convenience
- Frequency of delivery
- Delivery reliability
- Documentation quality
- Claims procedure
- Order completeness
- Technical support
- Order status information
Let us examine each of these in turn.
Order cycle time
This is the elapsed time from customer order to delivery. Standards should be defined against the customer’s stated requirements.
Stock availability
This relates to the percentage of demand for a given line item (SKU) that can be met from available inventory.
Order-size constraints
More and more customers seek JIT deliveries of small quantities. Do we have the flexibility to cope with the range of customer demands likely to be placed upon us?
Ordering convenience
Are we accessible and easy to do business with? How are we seen from the customers’ viewpoint? Do our systems talk to their systems?
Frequency of delivery
A further manifestation of the move to JIT is that customers require more frequent deliveries within closely specified time windows. Again it is flexibility of response that should be the basis for the performance standard.
Delivery reliability
What proportion of total orders are delivered on time? It is a reflection not just of delivery performance but also of stock availability and order processing performance.
Documentation quality
What is the error rate on invoices, delivery notes and other customer communications? Is the documentation ‘user friendly’? A surprisingly large number of service failures are from this source.
Claims procedure
What is the trend in claims? What are their causes? How quickly do we deal with complaints and claims? Do we have procedures for ‘service recovery’?
Order completeness
What proportion of orders do we deliver complete, i.e. no back orders or part shipments?
Technical support
What support do we provide customers with after the sale? If appropriate do we have standards for call-out time and first-time fix rate on repairs?
Order status information
Can we inform customers at any time on the status of their order? Do we have ‘hotlines’ or their equivalent? Do we have procedures for informing customers of potential problems on stock availability or delivery?
All of these issues are capable of quantification and measurement against customer requirements. Similarly they are all capable of comparison against competitive performance.
It must be recognised that from the customer’s perspective there are only two levels of service – either 100 per cent or 0 per cent. In other words either the customer gets exactly what they ordered at the time and place required or they don’t. It must also be remembered that 100 per cent order fill rates are extremely difficult to achieve – the laws of probability see to that! If there are ten items on a particular order and each item is carried in stock at the 95 per cent level of availability then the probability that the complete order can be filled is (0.95)10, which is 0.599. In other words, just over a 50/50 chance that we can satisfy the complete order.
Table 2.5 shows how the probability of order fill diminishes as the number of items on the customer order increases.
Ideally organisations should establish standards and monitor performance across a range of customer service measures. For example, using the pre-transaction, transaction and post-transaction framework, the following measures provide valuable indicators of performance:

Pre-transaction
- Stock availability
- Target delivery dates
- Response times to queries
Transaction
- Order fill rate
- On-time delivery
- Back orders by age
- Shipment delays
- Product substitutions
- First call fix rate
- Customer complaints
- Returns/claims
- Invoice errors
- Service parts availability
It is possible to produce a composite index based upon multiple service measures and this can be a useful management tool, particularly for communicating service performance internally. Such an index is shown in Table 2.6 where the weight attached to each service element reflects the importance that the customers attach to those elements.
Table 2.6 Composite service index

Customer service is one of the most powerful elements available to the organisation in its search for competitive advantage and yet it is often the least well managed. The key message of this chapter has been that the quality of customer service performance depends in the main upon the skill with which the logistics system is designed and managed. Put very simply, the output of all logistics activity is customer service.
References
1. Schonberger, R.J., Building a Chain of Customers, The Free Press, 1990.
2. LaLonde, B.J. and Zinszer, P.H., Customer Service: Meaning and Measurement, National Council of Physical Distribution Management, Chicago, 1976.
3. Corsten, D. and Gruen, T., ‘Stock-Outs Cause Walkouts’, Harvard Business Review, May 2004.
4. Bayle, M., ‘Brand Killers’, Fortune, 11 August 2003, pp. 51–56.
5. Reichheld, F.A., ‘Loyalty and the Renaissance of Marketing’, Marketing Management, Vol. 2, No. 4, 1994, pp. 10–21.
6. Levitt, T., The Marketing Mode, McGraw Hill, 1969.
7. Christopher, M., Payne, A. and Ballantyne, D., Relationship Marketing: Creating Stakeholder Value, Butterworth-Heinemann, 2002.
8. Baker, S., New Consumer Marketing, John Wiley & Sons, 2003.
9. Christopher, M. and Peck, H., Marketing Logistics, 2nd Edition, Butterworth-Heinemann, 2003.