
The synchronous supply chain
- The extended enterprise and the virtual supply chain
- The role of information in the virtual supply chain
- Laying the foundations for synchronisation
- ‘Quick response’ logistics
- Production strategies for QR
- Logistics systems dynamics
In conventional supply chains, each stage in the chain tends to be disconnected from the others. Even within the same company the tendency is for separate functions to seek to optimise their own performance. As a result the interfaces between organisations and between functions within those organisations need to be buffered with inventory and/or time lags. The effect of this is that end-to-end pipeline times are long, responsiveness is low and total costs are high.
To overcome these problems it is clear that the supply chain needs to act as a synchronised network – not as a series of separate islands. Synchronisation implies that each stage in the chain is connected to the other and that they all ‘march to the same drumbeat’. The way in which entities in a supply chain become connected is through shared information.
The information to be shared between supply chain partners includes demand data and forecasts, production schedules, new product launch details and bill of material changes.
To enable this degree of visibility and transparency, synchronisation requires a high level of process alignment, which itself demands a higher level of collaborative working. These are issues to which we shall return. The box below indicates some of the key processes that need to be linked, upstream and downstream, to provide the foundation for supply chain synchronisation.
- Planning and scheduling: Material positioning/visibility, advanced planning, scheduling, forecasting, capacity management.
- Design: Mechanical design, electrical design, design for supply chain, component selection.
- New product introduction: Bill of materials management, prototyping, design validation, testing, production validation, transfer to volume.
- Product content management: Change generation, change impact assessment, product change release, change cut-in/phase-out.
- Order management: Order capture/configuration, available to promise, order tracking, exception management.
- Sourcing and procurement: Approved vendor management, strategic sourcing, supplier selection, component selection.
Source: Cookson, C. ‘Linking Supply Chains to Support Collaborative Manufacturing’, Ascet, Vol. 3, 2001, www.ascet.com
Figure 8.1 depicts the difference between the conventional supply chain with limited transfer of information and the synchronous supply chain with network-wide visibility and transparency.
The extended enterprise and the virtual supply chain
The nature of business enterprise is changing. Today’s business is increasingly ‘boundaryless’, meaning that internal functional barriers are being eroded in favour of horizontal process management and externally the separation between vendors, distributors, customers and the firm is gradually lessening. This is the idea of the extended enterprise, which is transforming our thinking on how organisations compete and how value chains might be reformulated.
Underpinning the concept of the extended enterprise is a common information ‘highway’. It is the use of shared information that enables cross-functional, horizontal management to become a reality. Even more importantly it is information shared between partners in the supply chain that makes possible the responsive flow of product from one end of the pipeline to another. What has now come to be termed the ‘virtual enterprise’ or ‘supply chain’ is in effect a series of relationships between partners that is based upon the value-added exchange of information. Figure 8.2 illustrates the concept.
The notion that partnership arrangements and a mentality of co-operation are more effective than the traditional arm’s-length and often adversarial basis of relationships is now gaining credence. Thus the supply chain is becoming a confederation of organisations that agree common goals and who bring specific strengths to the overall value creation and value delivery system. This process is being accelerated as the trend towards outsourcing continues. Outsourcing should not be confused with ‘subcontracting’ where a task or an activity is simply handed over to a specialist. In a way it would be better to use the term ‘in-sourcing’ or ‘re-sourcing’, when we refer to the quite different concept of partnering that the virtual supply chain depends upon. These partnerships may not be for all time – quite possibly they exist only to exploit a specific market opportunity – but they will be ‘seamless’ and truly synergetic.
Figure 8.1 Achieving synchronisation through shared information: (a) before synchronisation; (b) after sychronisation

Figure 8.2 The extended enterprise and the virtual supply chain
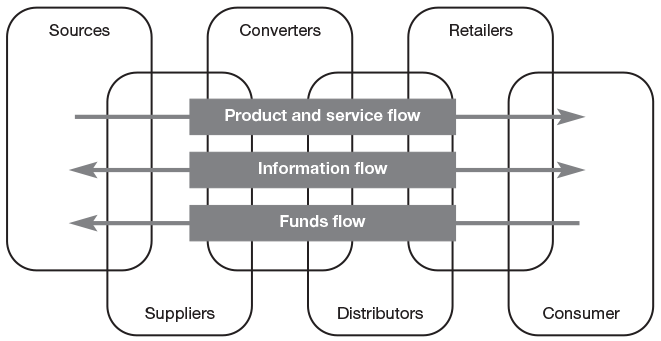
Source: A.T. Kearney
The role of information in the virtual supply chain
Leading organisations have long recognised that the key to success in supply chain management is the information system. However, what we are now learning is that there is a dimension to information that enables supply and demand to be matched in multiple markets, often with tailored products, in ever-shorter time-frames.
This extension of the information system beyond the classical dimensions of simple planning and control enables time and space to be collapsed through the ability to link the customer directly to the supplier and for the supplier to react, sometimes in real-time, to changes in the market. Rayport and Sviokla1 have coined the term ‘marketspace’ to describe the new world of electronic commerce, internets and virtual supply chains. In the marketspace, customer demand can be identified as it occurs and, through CAD/CAM and flexible manufacturing, products created in minimal batch sizes. Equally, networks of specialist suppliers can be joined together to create innovative yet cost-effective solutions for complex design and manufacturing problems. The way that Airbus now designs and assembles its advanced aeroplanes, for example, would not be possible without the use of global information networks that link one end of the value chain to the other.
The Internet has in many ways transformed the ways in which supply chain members can connect with each other.2 It provides a perfect vehicle for the establishment of the virtual supply chain. Not only does it enable vast global markets to be accessed at minimal cost and allow customers to shorten dramatically search time and reduce transaction costs, but it also enables different organisations in a supply chain to share information with each other in a highly cost-effective way. Extranets as they have come to be termed are revolutionising supply chain management. Organisations with quite different internal information systems can now access data from customers on sales or product usage and can use that information to manage replenishment and to alert their suppliers of forthcoming requirements.
One of Britain’s major retailers, Tesco, is using an extranet to link with its suppliers to share point-of-sale data. At the same time the company is successfully running a home shopping and delivery system for consumers over the Internet. Within the business, intranets are in place that enable information to be shared between stores and to facilitate communication across the business. We are probably even now only scraping the surface in terms of how the Internet and its associated technologies can be used to further exploit the virtual supply chain. Figure 8.3 highlights some of the current applications of Internet-based concepts to supply chain management.

The IT solutions now exist to enable supply chain partners to share information easily and at relatively low cost. A major benefit resulting from this greater transparency is that the internal operations of the business can become much more efficient as a result. For example, by capturing customer demand data sooner, improved utilisation of production and transport capacity can be achieved through better planning or scheduling. Figure 8.4 indicates some of the uses to which improved logistics information can be put.
Figure 8.4 Functions of a logistics information system

Increasingly, it seems that successful companies have one thing in common – their use of information and IT to improve customer responsiveness. Information systems are reshaping the organisation and also the nature of the linkages between organisations. Information has always been central to the efficient management of logistics but now, enabled by technology, it is providing the driving force for competitive logistics strategy.
We are now starting to see the emergence of integrated logistics systems that link the operations of the business, such as production and distribution, with the supplier’s operations on the one hand and the customer on the other.3 Already it is the case that companies can literally link the replenishment of product in the marketplace with their upstream operations and those of their suppliers through the use of shared information. The use of these systems has the potential to convert supply chains into demand chains in the sense that the system can now respond to known demand rather than having to anticipate that demand through a forecast.
One company that has recognised the importance of improving supply chain visibility through shared information is Cisco Systems, a market leader in telecommunications and network equipment (see box below).
Cisco Systems: creating a virtual supply chain through shared information
Cisco Systems, one of the world’s leading players in the networking and telecommunications markets, has created a virtual supply chain in which almost all manufacturing and physical logistics are outsourced to specialist contract manufacturers and third-party logistics companies. Only a very small proportion of their 20,000 different SKUs are actually ‘touched’ by Cisco.
Following a sudden collapse in sales as the Internet bubble of the closing years of the twentieth century finally burst, Cisco was forced to write-off over $2 billion of obsolete inventory. Subsequent investigations highlighted the reason for this spectacular fall from grace: inadequate visibility of real demand across the entire supply chain leading to significant over-ordering of components.
Determined not to see a repeat of this catastrophic event – the size of the inventory write-off created a new world record and led to a major financial set-back for the company – Cisco set out to build a state-of-the-art communications network to enable information to be shared across the ‘extended enterprise’ of their major tier 1 suppliers and logistics service providers. This has been achieved through the creation of an ‘e-hub’. The purpose of the e-hub is to act as the nerve centre and to ensure real-time visibility of demand, inventory levels and production schedules. Through its event management capability it can provide early warning of supply chain problems.
As a result of its investment in creating supply chain wide visibility through shared information, Cisco has enabled a highly synchronised network of global partners to act as if they were a single business.
Laying the foundations for synchronisation
In the same way that the conventional wisdom in production and manufacturing is to seek economies of scale through larger batch quantities, similar thinking can often be found in the rest of the supply chain. Thus companies might seek to ship by the container or truck load, customers are discouraged from ordering in smaller quantities by price penalties and delivery schedules are typically based on optimising the efficiency of routes and the consolidation of deliveries. Clearly such an approach runs counter to the requirements of a synchronous supply chain. Under the synchronisation philosophy the requirement is for small shipments to be made more frequently and to meet the precise time requirements of the customer.
The challenge to logistics management is to find ways in which these changed requirements can be achieved without an uneconomic escalation of costs. There may have to be trade-offs but the goal must be to improve total supply chain cost effectiveness.
The basic principle of synchronisation is to ensure that all elements of the chain act as one and hence there must be early identification of shipping and replenishment requirements and, most importantly of all, there must be the highest level of planning discipline.
In a synchronous supply chain the management of in-bound materials flow becomes a crucial issue. In particular the search for consolidation opportunities has to be a priority. Thus, for example, rather than one supplier making a series of deliveries in small quantities to a customer, the orders from a number of suppliers are combined into a single delivery. It is perhaps not surprising that the emergence of synchronous supply chains as a management philosophy has coincided with the growth of third-party distribution and logistics companies specialising in providing an in-bound consolidation service.
These logistics service companies can manage the pick-up of materials and components from suppliers on a ‘milk round’ basis, using a central ‘hub’ or transhipment centre for re-sorting and consolidating for in-bound delivery. They may also perform certain value-adding activities such as quality control, kitting, sequencing or final finishing. In complex assembly operations such as motor manufacture, the sequencing of parts and components prior to assembly is a crucial activity (see the example below of seat delivery to Nissan’s assembly line in north-east England).
Synchronised delivery: how Nissan Motors UK receives vehicle seats
Elapsed hours
| 0. | Painted body passes to trim line in Nissan |
| Precise vehicle specifications of next 12 vehicles transmitted by computer from Nissan to seat suppliers | |
| Supplier transfers information to picking lists | |
| Seat covers selected from range | |
| 1. | Covers prepared for assembly (in reverse order) |
| Seat assembly from synchronised manufacture of sub-assemblies (frames, foams, finishers, plastic parts) | |
| 2. | Quality audit and load |
| Delivery of seats to stock holding point by special purpose vehicle | |
| Stock to lineside | |
| 3. | Rear seats fitted followed by front seats (waiting stillages returned to empty wagon) |
| Delivery frequency now every 15–20 minutes |
Similar developments have enabled the transformation of retail logistics. The idea of ‘stockless distribution centres’ or ‘cross-docking’ enables a more frequent and efficient replenishment of product from manufacture to individual stores. Cross-docking, often facilitated by a logistics service provider, is a simple, but powerful, concept. Point-of-sale data from individual stores is transmitted to the retailer’s head office to enable them to determine replenishment requirements. This information is then transmitted directly to the suppliers who assemble orders for specific stores and the pallets or cases are then bar-coded (or increasingly electronically tagged). On a pre-planned basis these store orders are then collected by the logistics service provider and are taken to a transhipment centre (the ‘cross-dock’ facility) – possibly operated by the logistics service provider – where they are sorted for store delivery along with other suppliers’ orders. In effect, a JIT delivery is achieved, which enables minimum stock to be carried in the retail stores, and yet transport costs are contained through the principles of consolidation (see Figures 8.5 and 8.6).
Figure 8.5 Daily sales data drives the replenishment order system

‘Quick response’ logistics
An outgrowth of the synchronisation philosophy has emerged in recent years under the banner of ‘quick response’ logistics.4 The basic idea behind quick response (QR) is that in order to reap the advantages of time-based competition it is necessary to develop systems that are responsive and fast. Hence QR is the umbrella term for the information systems and the logistics systems that combine to provide ‘the right product in the right place at the right time’.
Figure 8.6 Acting on this information a consolidated pick-up and store delivery sequence is activated

What has made QR possible is the development of IT and in particular the rise of Internet-enabled data exchange, bar coding, the use of EPOS systems with laser scanners and so on.
Essentially the logic behind QR is that demand is captured in as close to real-time as possible and as close to the final consumer as possible. The logistics response is then made directly as a result of that information. An example of such an approach is provided in the United States by Procter & Gamble who receive sales data directly from the check-out counters of North America’s largest retailer, Wal-Mart. Making use of this information, P&G can plan production and schedule delivery to Wal-Mart on a replenishment basis. The result is that Wal-Mart carries less inventory yet has fewer stock-outs and P&G benefit because they get better economies in production and logistics as a result of the early warning and – most importantly – they have greatly increased their sales to Wal-Mart. Whilst the investment in the information system is considerable, so too is the payback.
A further feature in favour of QR systems is that by speeding up processing time in the system, cumulative lead-times are reduced. This can then result in lower inventory (see Figure 8.7) and thus further reduce response times. In effect a ‘virtuous circle’!
Figure 8.7 Quick response system can trigger a ‘virtuous circle’ in logistics

Quick response (QR) systems have begun to emerge in the fashion and apparel industry where the costs of traditional inventory-based systems based upon buyers’ prior purchase decisions (in effect a ‘push’ system) can be considerable. In the United States it is estimated that the annual costs to the US textile and apparel industry of conventional logistics systems is $25 billion. This comprises the following elements:
| Forced markdowns | $14.08bn |
| Stock-outs | $6.08bn |
| Inventory carrying costs | $5.08bn |
| Total: | $25.24bn |
There could be massive advantages to be gained by all parties in the supply chain if the concept of QR was adopted throughout the chain. Thus in the case of fashion garments the aim should be to link retail sales with the apparel manufacturers, who in turn are linked to the textile producers who themselves are linked to the suppliers of fibres. One such reported case is the linkage through shared information of the US textile company Milliken with the Seminole Manufacturing Company (a manufacturer of men’s slacks) and the retailer Wal-Mart. Information on end-user demand was captured at the point-of-sale and rapidly fed back up the supply chain, enabling dramatic reductions in lead-times to be achieved and hence substantial reductions in inventory.
Another case from the United States is provided by the chain of retail fashion stores, The Limited. Each of the several thousand stores in the chain tracks consumer preferences daily using their point-of-sale data. Based upon this, orders are sent by satellite links to the suppliers around the world. Using Hong Kong as a consolidation centre, goods are flown back to The Limited’s distribution centre in Columbus, Ohio. At the distribution centre the goods are price-marked and re-sorted for immediate onward shipment by truck and plane to the retail stores. The whole cycle from reorder to in-store display can be achieved in six weeks. Conventional systems take more like six months.
Production strategies for QR
As the demand by all partners in the supply chain for a QR increases, the greater will be the pressure placed upon manufacturing to meet the customer’s needs for variety in shorter and shorter time-frames.
The answer has to lie in flexibility. As we have already observed, if it were possible to reduce manufacturing and logistics lead-times to zero then total flexibility could be achieved. In other words the organisation could respond to any request that was technologically feasible in any quantity. Whilst zero lead-times are obviously not achievable, the new focus on FMS has highlighted the possibility of substantial progress in this direction.
The key to flexibility in manufacturing is not just new technology, e.g. robotics, although this can contribute dramatically to its achievement. The main barrier to flexibility is the time taken to change: from one level of volume to another and from making one variant to another. Typically we call this ‘set-up time’. It will be apparent that if set-up times can be driven as close as possible to zero then flexible response to customer requirements presents no problem.
The Japanese, not surprisingly, have led the way in developing techniques for set-up time reduction. ‘Single minute exchange of die’, or SMED, is the goal in many Japanese plants. In other words, continuous attention by management and the workforce is focused upon the ways in which set-up times can be reduced. Sometimes it will involve new technology, but more often than not it is achieved through taking a totally different look at the process itself. In many cases, set-up times have been reduced from hours down to minutes, simply by questioning the conventional wisdom.
What in effect we are seeing is a fundamental shift away from the economies of scale model, which is volume based and hence implies long production runs with few change-overs, to the economies of scope model, which is based upon producing small quantities of a wider range, hence requiring more change-overs.
It has been suggested that under the economies of scope model5:
… a single plant can produce a variety of output at the same cost as (if not lower than) a separate plant, dedicated to producing only one type of product at a given level. In other words an EOQ of one unit, and specific production designs, engender no additional costs. Economies of scope change the materials-driven, batch-system technology into a multi-functional, flow system configuration.
The marketing advantages that such flexibility brings with it are considerable. It means that in effect the company can cater for the precise needs of multiple customers, and they can offer even higher levels of customisation. In today’s marketplace, where customers seek individuality and where segments or ‘niches’ are getting ever smaller, a major source of competitive advantage can be gained by linking production flexibility to customers’ needs for variety.
A classic example is provided by Benetton, the Italian fashion goods manufacturer and distributor, who have created a worldwide business based upon responsiveness to fashion changes – with a particular emphasis upon colour. By developing an innovative process whereby entire knitted garments can be dyed in small batches, they reduced the need to carry inventory of multiple colours, and because of the small batch sizes for dying, they greatly enhanced their flexibility. Benetton’s speed of response is also assisted by the investment that they have made in high-speed distribution systems, which are themselves aided by rapid feedback of sales information from the marketplace.
Many companies are now seeking to construct supply chains to enable them to support a marketing strategy of mass customisation. The idea behind this is that today’s customers in many markets are increasingly demanding tailored solutions for their specific requirements. The challenge is to find ways of achieving this marketing goal without increasing finished goods inventory and without incurring the higher costs of production normally associated with make-to-order.
Often this can be achieved by postponing the final configuration or assembly of the product until the actual customer requirement is known – a strategy pursued by Dell and Hewlett Packard for example.
In other cases, high technology in the form of computer-aided design/computer-aided manufacturing (CAD/CAM) can provide the means for this mass customisation. The recent arrival of ‘3D printing’ or additive layer manufacturing whereby products can be ‘printed on demand’ has the potential to transform the ability to customise and postpone the production of products. The impact of this technology will be discussed in more detail in Chapter 16.
Logistics systems dynamics
Bottleneck management
One of the barriers to synchronisation of supply chain activities is the presence of bottlenecks which can impede the smooth flow through the systems. Every system will have a bottleneck which determines the rate of output of the system. It follows therefore that the effective management of bottlenecks is critical. Even if a bottleneck is removed, by definition another one will appear.
A significant contribution to the way in which we view bottlenecks has been made by Goldratt6 who developed the theory of constraints, sometimes known as optimised production technology (OPT).
The essence of OPT is that all activities in a logistics chain can be categorised as either ‘bottlenecks’ or ‘non-bottlenecks’. A bottleneck is the slowest activity in a chain and whilst it may often be a machine, it could also be a part of the information flow such as order processing. The throughput time of the entire system is determined by bottleneck activities. It follows therefore that to speed up total system throughput time it is important to focus on the bottlenecks, to add capacity where possible and to reduce set-ups and set-up times if applicable.
Equally important, however, is the realisation that non-bottlenecks should not be treated in the same way. It is unnecessary to improve throughput at non-bottlenecks as this will only lead to the build-up of unwanted inventory at the bottleneck. Consequently, the output of non-bottlenecks that feed bottlenecks must be governed by the requirements of the bottlenecks they serve.
These ideas have profound implications for the re-engineering of logistics systems where the objective is to improve throughput time overall, whilst simultaneously reducing total inventory in the system. The aim is to manage the bottlenecks for throughput efficiency, which implies larger batch quantities and fewer set-ups at those crucial points, whereas non-bottlenecks should minimise batch quantities even though more set-ups will be involved. This has the effect of speeding up the flow of work-in-progress and these ‘transfer batches’ merge into larger ‘process batches’ at the bottlenecks, enabling a faster flow through the bottleneck. It follows that idle time at a non-bottleneck need not be a concern, indeed it should be welcomed if the effect is to reduce the amount of work-in-progress waiting at a bottleneck.
Emerging from the theory of constraints is the idea of ‘drum-buffer-rope’. The drum is beating the pace at which the system as a whole should work. The buffer is placed before the bottleneck to ensure that this limiting factor in the system is always working to its full capacity. The rope is drawn from an analogy with a column of marching soldiers where the slowest man sets the pace. The rope attaches the leader of the column to the slowest man – in a supply chain the rope is the means by which replenishment quantities of materials, components, etc., are communicated to suppliers.
One of the major advantages of moving to QR and synchronous supply chain strategies is that, by reducing lot quantities and increasing the rate of throughput in the logistics system, modulations in the level of activity in the pipeline can be reduced.
Logistics systems are prone to what has been called the ‘Bullwhip’ or ‘Forrester Effect’, after Jay Forrester, who developed a set of techniques known as industrial dynamics.7 Forrester defined industrial dynamics as:
The study of the information feedback characteristics of industrial activity to show how organisational structure, amplification (in policies) and time delays (in decisions and returns) interact to influence the success of the enterprise. It treats the interactions between the flows of information, money, orders, materials, personnel, and capital equipment in a company, an industry or a national economy.
Using a specially developed computer simulation language, DYNAMO, Forrester built a model of a production/distribution system involving three levels in the distribution channel: a retailer’s inventory, a distributor’s inventory and a factory inventory. Each level was interconnected through information flows and flows of goods. The model used real-world relationships and data and included parameters such as order transmission times, order processing times, factory lead-times and shipment delivery times. Management could then examine the effects on the total system of, say, a change in retail sales or the impact of changing production levels or any other policy change or combination of changes.
What becomes apparent from this modelling of complex systems is that small disturbances in one part of the system can very quickly become magnified as the effect spreads through the pipeline.
For example, many consumer product companies that are heavy spenders on trade promotions (e.g. special discounts, incentives, etc.) do not realise what the true costs of such activities are. In the first instance there is the loss of profit through the discount itself, and then there is the hidden cost of the disturbance to the logistics system. Consider first the loss of profit. When a discount is offered for a limited period then that discount obviously will apply to all sales – not just any incremental sales. So if sales during the promotional period are, say, 1,100 cases but without the promotion they would have been 1,000, then whilst the incremental revenue comes only from the additional 100 cases, the discount applies to all 1,100. Additionally the retailer may decide to take advantage of the discount and ‘forward order’; in other words buy ahead of requirement to sell at a later time at the regular price. One study8 found that for these reasons only 16 per cent of promotions were profitable, the rest only ‘bought sales’ at a loss. The impact of this type of price promotion on overall profitability is highlighted in the case of ‘Black Friday’ described in the box below.
‘Black Friday’ – a self-inflicted injury?
On Friday 28 November 2014 the UK was gripped with a frenzy of consumption as customers sought to take advantage of the deep price cuts offered by many leading retail chains. ‘Black Friday’ – as the day is termed – is a long-established tradition in the USA, but only recently adopted by British retailers. The idea behind Black Friday is that at the start of the run up to the Christmas trading period products are promoted through limited period price cuts, presumably to kick-start the end-of-year buying spree. Traditionally, in the United States the Friday following Thanksgiving Day is the day when Christmas shopping begins in earnest – now known as Black Friday.
This recent import from the USA caused havoc in the UK high street and in on-line shopping. Many retailers recorded record sales on that day both through their bricks and mortar outlets as well as on-line – Internet sales for example were 30% higher than normal. As a result of this dramatic increase in volume, retailers’ logistics systems were put under immense pressure, and home deliveries were severely affected with many delivery service providers unable to cope with the surge.
The paradox is that for many companies their total sales revenue for the whole of the Christmas trading period was flat on a like-for-like basis. All that had happened was that customers brought forward their purchases – and bought at a lower price. The combined impact of higher logistics costs and marked-down prices inevitably eroded retailers’ profitability.
Even though retailers and industry specialists have long recognised that promotions of this type rarely boost profits – in fact the reverse is usually the case – it seems that these self-induced injuries are hard to eradicate.
The second impact of promotional activity on profit is the potential it provides for triggering the ‘acceleration effect’ and hence creating a Forrester-type surge throughout the logistics pipeline. This is because in most logistics systems there will be ‘leads and lags’, in other words the response to an input or a change in the system may be delayed. For example, the presence of a warehouse or a stock holding intermediary in the distribution channel can cause a substantial distortion in demand at the factory. This is due to the ‘acceleration effect’, which can cause self-generated fluctuations in the operating characteristics of a system.
As an example, imagine a retailer who has an inventory management reordering strategy based on starting each week with the equivalent of three weeks’ demand in stock. So if weekly demand were 100 units for a particular item, the target starting inventory would be 300 (i.e. 100 × 3). Now let us assume that as a result of a promotion demand increases by 10 per cent to 110. This means that the system would place an order to bring the next week’s starting inventory up to 330 (i.e. 110 × 3). So the reorder quantity would have to be 140 (i.e. the 110 units sold to consumers plus the extra 30 required to meet the new starting level).
In this particular case, an increase in consumer demand of 10 per cent leads to a one-off increase in demand on the supplier of 40 per cent!
If in the next period consumer demand were to fall back to its old level then the same effect would happen in reverse.
It is not unusual for companies undertaking frequent promotional activity to experience considerable upswings and downswings in factory shipments on a continuing basis. Figure 8.9 illustrates the lagged and magnified effect of such promotional activity upon the factory. It can be imagined that such unpredictable changes in production requirement add considerably to the unit costs of production.
In the grocery industry, where much of this promotional activity is found, there is a growing recognition of the need to achieve a closer linkage between the ordering policies of the retail trade and the manufacturing schedules of the supplier. In the United States it was estimated that the time from the end of the production line to purchase by the consumer in a retail store was 84 days for a typical dry grocery product (see Figures 8.9 and 8.10).
This means that the ‘tidal wave’ effect of changes in demand can be considerably magnified as they pass through all the intermediate stock holding and reorder points. One of the benefits of a QR system is that by linking the retail check-out desk to the point of production through electronic data transfer, the surge effect can be dramatically reduced. This fact alone could more than justify the initial investment in linked buyer/supplier logistics information systems.
Figure 8.8 The impact of promotional activity upon production requirement

Figure 8.9 Grocery industry delivery system order cycle
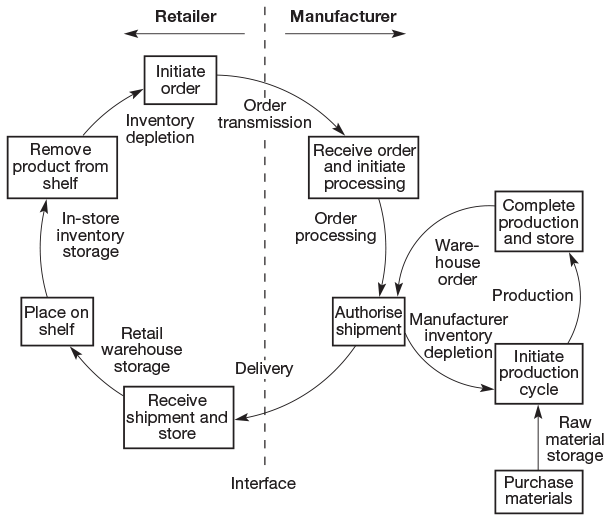
Source: Grocery Manufacturers Association of America

References
1. Rayport, J.F. and Sviokla, J.J., ‘Managing in the Marketspace’, Harvard Business Review, November–December 1994.
2. Chandrashekar, A. and Schary, P., ‘The Virtual Web-Based Supply Chain’, in Franke, U. (ed.), Managing Virtual Web Organisations in the 21st Century, Idea Group Publishing, 2002.
3. Heinrich, C., Adapt or Die: Transforming your Supply Chain into an Adaptive Business Network, John Wiley & Sons, 2003.
4. Lowson, R., King, R. and Hunter, A., Quick Response: Managing the Supply Chain to Meet Consumer Demand, John Wiley & Sons, 1999.
5. Lei, D. and Goldhars, J.D., ‘Computer-Integrated Manufacturing: Redefining the Manufacturing Firm into a Global Service Business’, International Journal of Operations & Production Management, Vol. 11, No. 10, 1991.
6. Goldratt, E.M. ‘Theorgy of Constraints’, North River Press, 1990.
7. Forrester, J., Industrial Dynamics, MIT Press, 1961.
8. Abraham, M.M. and Lodish, L.M., ‘Getting the Most out of Advertising and Promotion’, Harvard Business Review, May–June 1990.