
Chapter 16: Prediction of leukemia by classification and clustering techniques
Kartik Rawala; Advika Parthvia; Dilip Kumar Choubeyb; Vaibhav Shuklac a School of Computer Science and Engineering, Vellore Institute of Technology, Vellore, Tamil Nadu, India
b Department of Computer Science & Engineering, Indian Institute of Information Technology, Bhagalpur, India
c Tech Mahindra Ltd., Mumbai, Maharastra, India
Abstract
Leukemia is a kind of blood cancer that impacts the white blood cells and damages the bone marrow. Typically the complete blood count (CBC) and bone marrow are affected. It can be a fatal disease if not identified at the earliest stage. Usually, manual microscopic assessment of stained sample slides is used for analysis of leukemia, but manual diagnostic strategies are time consuming, less accurate, and prone to errors due to diverse human elements such as pressure, fatigue, and so on. To avoid possible faults and errors and to assist pathologists, clustering and classification techniques are required, which are being used in every medical field to obtain better outcomes. This chapter emphasizes clustering and classification techniques applied to detection of leukemia. The proposed work consists of two phases: Phase I deals with the collection of the dataset and visualization of datasets, and Phase II deals with machine learning and data mining techniques for the prediction of leukemia. We would expect that the proposed techniques would show better performance than other existing techniques. The proposed techniques could be utilized for other diseases as well.
Keywords
Leukemia; Machine learning; Data mining; Clustering; Classification; Fuzzy c-means; KNIME; KNN
1: Introduction
Leukemia is a cancerous growth of abnormal white cells that destroys the blood and bone marrow. Leukemia is classified by the kind of white blood cells influenced and by how rapidly the illness advances. Lymphocytic leukemia (otherwise called lymphoid or lymphoblastic leukemia) is created in the white blood cells called lymphocytes in the bone marrow. Myeloid (otherwise called myelogenous) leukemia may likewise begin in white blood cells other than lymphocytes, or in red blood cells and platelets.
Based on how rapidly it advances or deteriorates, leukemia is called either acute (quickly developing) or chronic (slow-developing). Acute leukemia advances rapidly, causing the aggregation of juvenile, functionless cells in the bone marrow. With this sort of leukemia, cells recreate and develop in the marrow, diminishing the marrow’s capacity to deliver enough normal blood cells. Chronic leukemia advances more gradually and results in the aggregation of generally develop, yet at the same time anomalous, white blood cells.
In diagnostic and prediction software for leukemia, different algorithms, such as support vector machine (SVM), k-nearest neighbor (k-NN), k-means, and fuzzy c-means, are implemented on datasets related to leukemia to find those having the best accuracy and the least time complexity, in order to make diagnosis faster, easier, and more accurate. This chapter uses the Konstanz Information Miner (KNIME) platform and other relevant software to implement and compare various algorithms to find the best one. Our future work will deal with analysis of leukemia patients in and around a specific area. We will specify the area having the greatest number of leukemia patients, to assist in planning, since providing a plan for the diagnosis and treatment of cancers is a key component of any overall cancer control plan. Providing doctors, equipment, and appropriate medication where it is most required, instead of distributing these resources randomly, is an important factor.
The chapter objective is to achieve better prediction of leukemia, which is a serious disease that can be cured if treated in earlier stages. The analysis of blood samples is typically done manually to determine if there are any abnormalities in the sample that are indicative of disorders. It is very beneficial for patients to be diagnosed at earlier stages, so they have a possibility of being cured. The mortality rate in India can be reduced to a certain extent if people with leukemia are treated earlier, so their disease does not prove to be fatal. If an efficient technique can be developed for the prediction of leukemia, then it will be easier for physicians to diagnose it.
The rest of the chapter is arranged as follows: motivation is stated in Section 2, a literature review is elaborated in Section 3, a description of the proposed system is provided in Section 4, simulation results and a discussion are given in Section 5, and conclusions and future directions are discussed in Section 6.
2: Motivation
Leukemia is a type of cancer that affects the bone marrow and is considered to be fatal. In spite of advancements in science and technology, a microscopic examination of a blood smear still remains the standard and hence most economical method for leukemia diagnosis. The technique for manual examination relies upon pathologists, that is, their experience, mental status, individual issues, etc. Thus these components can all influence the results. Due to these factors, there needs to be a viable computerized framework for screening of leukemia that yields significantly improved results. Moreover, computerized systems, when contrasted with manual analysis, can increase the precision and the speed of diagnosis. This will assist specialists in treating the disease.
3: Literature review
The authors have carried out a rigorous analysis and study of many research articles based on leukemia with particular focus on classification and clustering algorithms.
Since clustering and classification techniques are now being used in every medical field to obtain better outcomes, this chapter therefore emphasizes these techniques. A group of researchers (Choubey and Paul, 2015; Choubey and Paul, 2016a, b; Choubey and Paul, 2017a, b; Choubey et al., 2017; Choubey et al., 2018; Choubey et al., 2019a, 2019b; Choubey et al., 2020a; Kumar et al., 2020a) have implemented many software computing and computational intelligence methods for the prediction of diabetes. Researchers have also compared and analyzed their proposed algorithms with several existing algorithms on real-world diabetes datasets. They have evaluated the performance of each algorithm and have also discussed the future directions. In this way, Sharma et al. (2020) have discussed computational intelligence techniques for the identification of breast cancer; Parthvi et al. (2020) have done a comparative analysis using machine learning and data-mining techniques for leukemia; Pahari and Choubey (2020) have done a comparative analysis using soft computing approaches for leukemia; Kumar et al. (2018b) and Kumar et al. (2020b) have used multichannel FLANN and cat swarm optimization-based FLANN to eliminate noise from ultrasound images; Srivastava and Choubey (2020), Kumar et al. (2019), and Srivastava and Choubey (2019) have used, analyzed, and compared machine-learning and data-mining techniques for the classification of heart disease, using soft computing; Bala et al. (2017) and Bala et al. (2018) have analyzed and compared soft computing, data mining, and machine-learning techniques for the prediction of thunderstorms and lightning.
Dash et al. (2012) provided a comparison between dimensional reduction techniques like the hybrid feature selection scheme and partial least squares method. In this analysis, the relative performance of four different supervised classification procedures, including radial basis function network (RBFN), was evaluated. The results presented in the paper showed that the appropriate feature selection method was a partial least squares regression method, and a combined use of different classification and feature selection approaches made it possible to construct high-performance classification models for microarray data.
Chandrasekar et al. (2013) have presented an effective classification method. After analyzing different classification algorithms, they choose six classifiers based on simulation performance and the results showed that the random tree classifier algorithm achieved an overall classification accuracy of 98%.
Priyanga and Prakasam (2013) proposed a system called a data mining-based cancer prediction system. The main aim of this model is to give earlier warnings to patients, and it is also of both time and cost benefit to the user. This model predicts specific cancer risk. The system was validated by comparing the patient’s prior medical records with the predicted result given by the model, and also this system was analyzed using the WEKA tool. This prediction system is available online.
Suji and Rajagopalan (2013) used the oral datasets of many cancer and noncancer patients; the collected data was preprocessed for duplicate and missing data. Then various classification algorithms were applied on this preprocessed dataset. The performance of all the algorithms was then analyzed. The obtained result clearly showed that for the C4.5 algorithm, the classification rate reached almost 100%, while the classification rate of the random tree algorithm and MPNN was near 98.7% and 99.5%, respectively.
Sivaraman et al. (2014) proposed a blood cancer prediction system by using a statistical approach with a fuzzy inference system and a feed-forward back-propagation neural network. Their system was implemented on a huge set of test data, and was utilized to analyze the outcomes. The proposed blood cancer prediagnosis system offered significant accuracy, sensitivity, and specificity.
Shouval et al. (2015) proposed a machine-learning algorithm that is part of the data mining (DM) approach, which may serve for transplantation-related mortality risk prediction. In the case of acute lymphocytic leukemia (ALL), the alternate decision tree model provides a robust tool for risk evaluation of patients with this disease. This method has proved useful for clinical prediction in hematopoietic stem-cell transplantation.
Daqqa et al. (2017) presented a study that predicted the existence of leukemia by determining the relationship of blood properties and leukemia to gender, health status of patient, and the age factor, using data mining identified for blood cancer classification of k-nearest neighbor (k-NN), decision tree (DT), and support vector machine (SVM). The study was performed on a dataset of about 4000 patients and the results of the study showed that the decision tree algorithm had the highest percentage in comparision with the other two algorithms. Through this study, it is also clear that the DT classifier obtains properties regarding other attributes such as cities (eastern regions) that are most vulnerable to leukemia.
Kumar et al. (2018a), using python as a key tool and k-nearest neighbor (k-NN) and naïve Bayes classifiers, depicted acceptable performance for the classification of acute leukemia by acquiring microscopic test images.
Panda and Vihar (2016) have used bioinformatics datasets for understanding the effectiveness of a proposed classification, concluding the effectiveness of the proposed approach of combining DCNN by comparing it with an FRF classifier and with the other available research in the relevant domain; they highlight the future scope of the research in their conclusions.
Vasighizaker et al. (2019) used a one-class classification support vector machine (OCSVM) method to classify an acute myeloid leukemia (AML) cancer dataset. The researchers have claimed that, compared with the traditional methods, their proposed method’s experimental results indicate superiority.
Warnat-Herresthal et al. (2020) proposes a data-driven high-dimensional approach in the prediction of leukemia. The approaches used in the study are highly scalable with low marginal cost, essentially matching human expert annotation in a near-automated workflow. The results of the study show that a machine-learning approach with transcriptomics can be used as a part of an integrated omics approach where, in the risk prediction of leukemia, different diagnoses are achieved by genomics, while on the other hand the diagnosis could be assisted by transcriptomic-based machine learning.
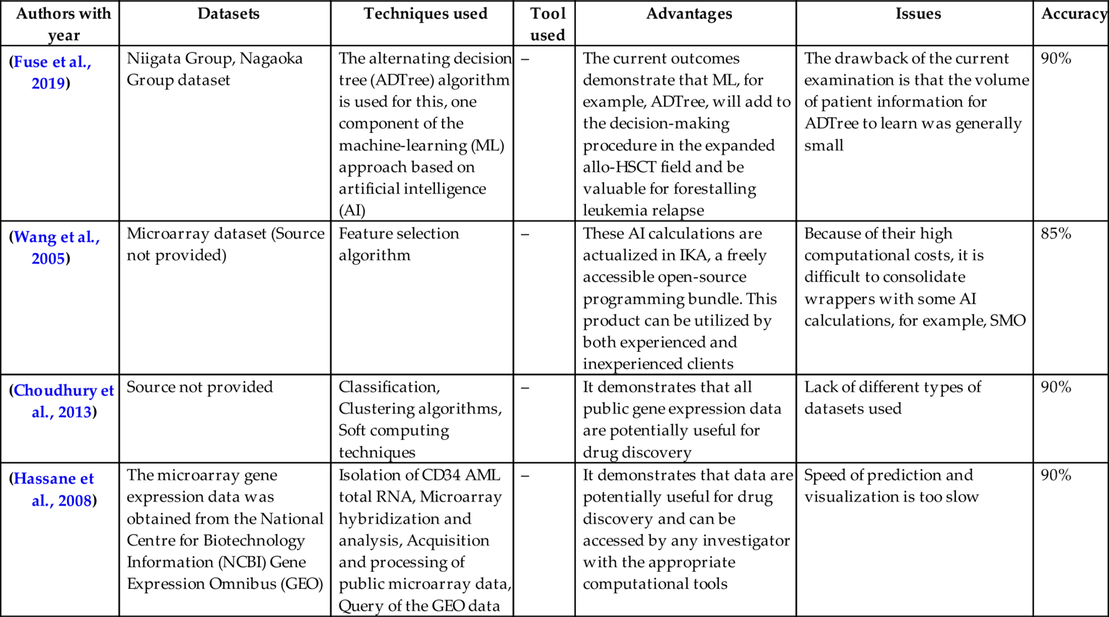
Table 1 provides a thorough analysis of different research articles. In the table we have presented the different techniques, datasets, tools used, advantages, issues, and accuracy for cancer diseases.
Table 1
| Authors with year | Datasets | Techniques used | Tool used | Advantages | Issues | Accuracy |
|---|---|---|---|---|---|---|
| (Kumar et al., 2018a) | Acquired digital data: Microscopic test images | K-nearest neighbor (k-NN) and naïve Bayes classifier | Python | The outcomes show that the calculation proposed accomplishes a worthy exhibition for the analysis of intense lymphocytic leukemia | Absence of forecast model improvement rules, I clung to an exacting methodologic head | 80% |
| (Escalante et al., 2012) | Real data such as ALL/AML dataset | Two Bayesian classification methods, which incorporate feature selection, for the classification of gene expression data derived from cDNA microarrays | – | EPSMS is an exceptionally powerful strategy for the computerized development of troupe classifiers for acute leukemia, which requires no noteworthy client mediation | There are still some open issues that call for further examination. One issue is the determination of a lot of classifiers for making a gathering | 97.68% |
| (Shouval et al., 2015) | Source not provided. | The alternating decision tree (ADT) algorithm | – | The substituting choice tree model provides a strong instrument for the chance assessment of patients with AL before HSCT | Absence of expectation model advancement guidelines, I clung to exacting methodologic principals, as opposed to the EBMT and HCT-CI scores | 70% |
| (Li et al., 2016) | The proposed method was tested on 130 ALL images taken from ALL IDB | Complete methodology is based on the dual-threshold algorithm | – | Proposed a double limit strategy for segmenting white blood cells from acute lymphoblastic leukemia images | White blood cell division, which assumes a significant job in programmed cell morphology investigation remains a difficult issue in view of the morphological variety of WBCs and the mind-boggling foundation of blood tiny pictures | 97.85% |
| (Sewak et al., 2009) | ALL and AML using the microarray gene expression data | The heuristic nature of machine-learning algorithms | – | The advisory group, through a lion’s share casting a ballot, effectively ordered an aggregate of 34 of the 35 approval informational collections, yielding an exactness of 97.14% for the three-class characterization issue | Absence of various kinds of informational indexes utilized | 97% |
| (Abdeldaim et al., 2018) | ALL-IDB1 and ALL-IDB2 | K-NN is used for classification | Python | Acceptable in terms of the segmentation performance as the accuracy of all classifiers, especially k-NN, which achieved the best accuracy | The shape features cannot be trusted because of sensitivity to segmentation errors. These features integrate together with regional features, which are less susceptible to errors | 91% |
| (Valdés and Barton, 2004) | The dataset utilized has 7129 qualities where patients are isolated into a preparation set containing 38 bone marrow tests | K-means algorithm, with a Boolean reasoning algorithm | – | Representation additionally clarified the conduct of the neural system models and recommends the potential for the presence of better arrangements | The outcomes clarify the conduct of the neural system models and propose the potential for the presence of better arrangements | 95% |
| (Do and Byrd, 2015) | The outcomes from mass cytometry were contrasted and clinical stream cytometry information, and the techniques Wrath profoundly reliable | K-means algorithm | Python | A bewildering amount of data was managed from one lot of bone marrow suctions | An astonishing amount of information was gathered and can be used for future development | 96% |
| (Panda and Vihar, 2016) | Uses bioinformatics datasets for understanding the effectiveness of our proposed classification. It uses arrhythmia, leukemia, lymphoma, and prostate cancer datasets for experimentation | The goal is to develop an efficient machine learning algorithm that can help to speed up the classification process and address the memory constraints effectively | Python | We conclude with the effectiveness of our proposed approach of combining DCNN with FRF classifier compared with other available research in the relevant domain and highlight the future scope of research | Lack of different type of datasets used | 93.7% |
| (Shafique and Tehsin, 2018) | The dataset used is from Alex-Net | Zack algorithm is used for each segmentation of leukocytes, SVM classifier | – | Robotized diagnosing framework may assist in early diagnosing of leukemia so it is very well may be dealt with viably | The speed and working model can be expanded | 99.5% |
| (Fuse et al., 2019) | Niigata Group, Nagaoka Group dataset | The alternating decision tree (ADTree) algorithm is used for this, one component of the machine-learning (ML) approach based on artificial intelligence (AI) | – | The current outcomes demonstrate that ML, for example, ADTree, will add to the decision-making procedure in the expanded allo-HSCT field and be valuable for forestalling leukemia relapse | The drawback of the current examination is that the volume of patient information for ADTree to learn was generally small | 90% |
| (Wang et al., 2005) | Microarray dataset (Source not provided) | Feature selection algorithm | – | These AI calculations are actualized in IKA, a freely accessible open-source programming bundle. This product can be utilized by both experienced and inexperienced clients | Because of their high computational costs, it is difficult to consolidate wrappers with some AI calculations, for example, SMO | 85% |
| (Choudhury et al., 2013) | Source not provided | Classification, Clustering algorithms, Soft computing techniques | – | It demonstrates that all public gene expression data are potentially useful for drug discovery | Lack of different types of datasets used | 90% |
| (Hassane et al., 2008) | The microarray gene expression data was obtained from the National Centre for Biotechnology Information (NCBI) Gene Expression Omnibus (GEO) | Isolation of CD34 AML total RNA, Microarray hybridization and analysis, Acquisition and processing of public microarray data, Query of the GEO data | – | It demonstrates that data are potentially useful for drug discovery and can be accessed by any investigator with the appropriate computational tools | Speed of prediction and visualization is too slow | 90% |

The results presented in the study show that, with existing technologies, it is potentially possible to achieve good performance in a near-automated fashion.
4: Description of proposed system
The proposed system is described in the following subsections.
4.1: Introduction and related concepts
Leukemia is a cancerous growth of abnormal white cells that damages the blood and bone marrow. Leukemia is classified by the type of white blood cells influenced and by how rapidly the illness advances. Lymphocytic leukemia (otherwise called lymphoid or lymphoblastic leukemia) appears in the white blood cells, called lymphocytes, in the bone marrow. Myeloid (otherwise called myelogenous) leukemia may likewise begin in blood cells other than lymphocytes, such as red blood cells and platelets.
Based on how rapidly it appears or advances, leukemia is called either acute (quickly developing) or chronic (slow-developing). Acute leukemia advances quickly and brings about the aggregation of juvenile, nonfunctioning blood cells in the bone marrow. With this sort of leukemia, cells recreate and develop in the marrow, diminishing the marrow’s capacity to deliver enough functional blood cells.
The diagnosis of leukemia typically relies on the complete blood count (CBC), in which physicians check the complete count of white blood cells, red blood cells, and platelets. This complete blood count test can show leukemia cells, but often this is not adequate for physicians to confirm that the patient has leukemia. Other techniques are used, including bone marrow aspiration and microscopic examination of blood smears. However, all these manual methods require much effort and time. Additionally, extensively trained therapeutic experts are required to carry out this type of inspection. Despite what might be expected, computerized demonstrative frameworks can address these issues of manual analysis. In addition, they can lessen the need for medical experts and can give exact and viable outcomes as compared to manual diagnosing (Table 2).
Table 2
| Number of features | Name of features/attributes | Number of instances/samples | Number of class |
|---|---|---|---|
| 7 | 1. Subject identifier (id) | 646 | 2 |
| 2. Treatment arm A or B (trt) | |||
| 3. Time to death or last follow-up (futime) | |||
| 4. 1 if fulltime is a death, 0 for censoring (death) | |||
| 5. Time to hematopoietic stem cell transplant (txtime) | |||
| 6. Time to complete response (crtime) | |||
| 7. Time to relapse of disease (rltime) |
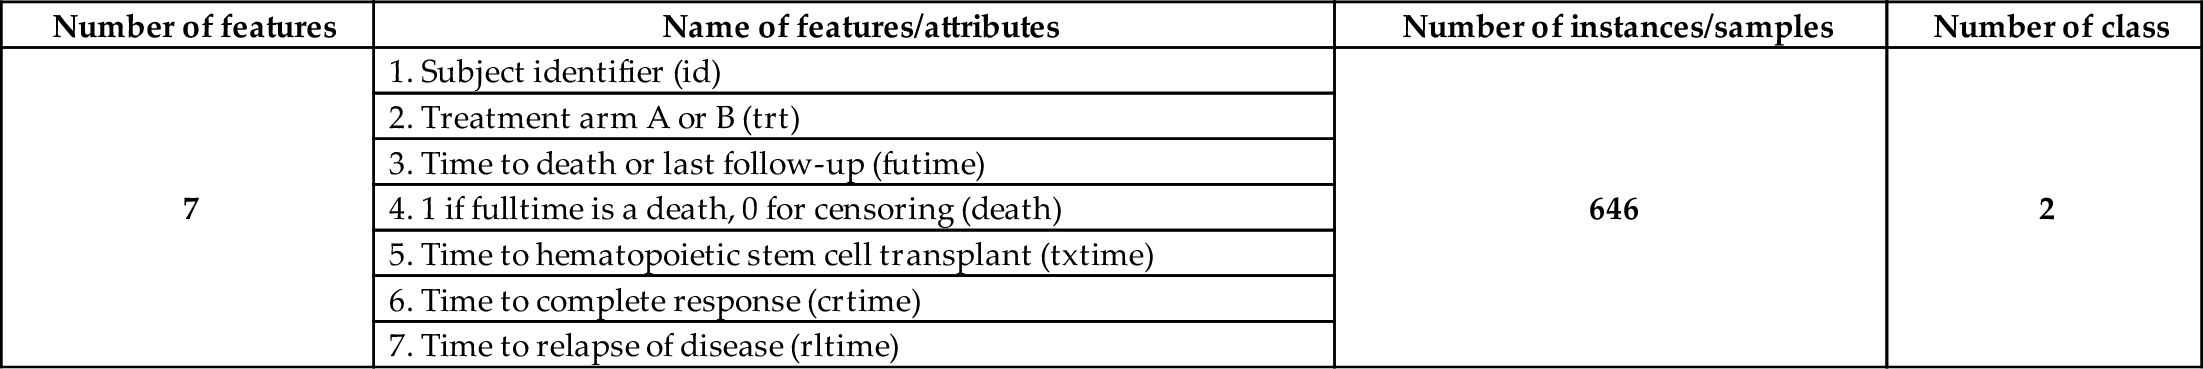
An acute myeloid leukemia dataset has been used for the analysis. The myeloid dataset is available in (Picostat, 2018) and is also found in the R package. This dataset includes seven features, including class, and 646 instances or samples. The death feature is a class (two), where 1 indicates fulltime is a death, 0 for sensoring.
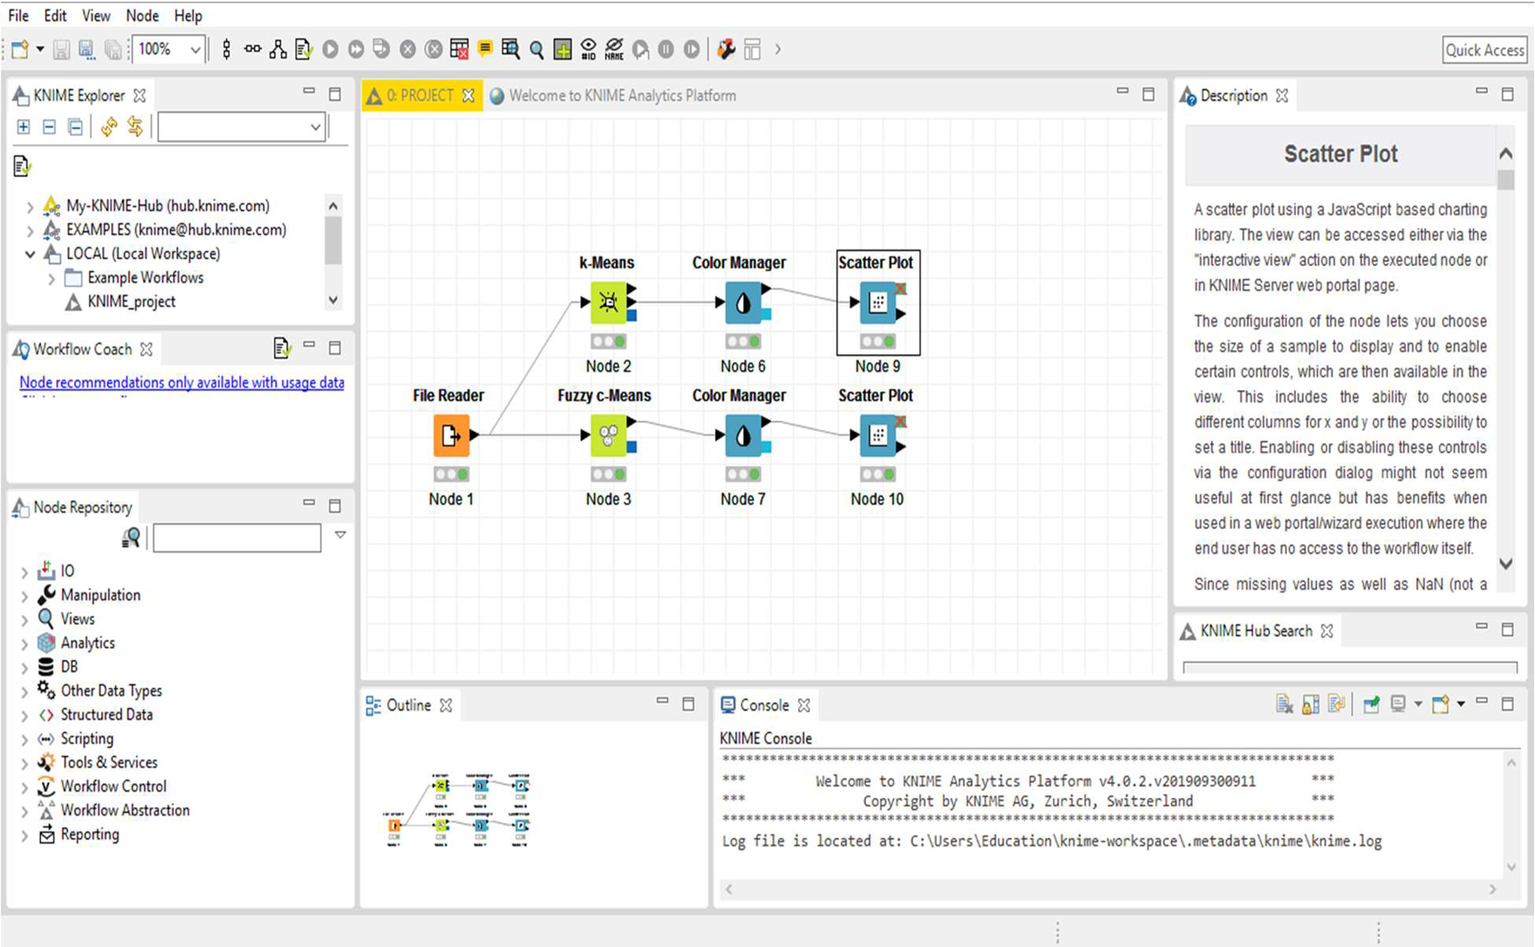
4.2: Framework for the proposed system
The authors have used the KNIME platform in implementing this work. It is an open-source platform that has many functionalities, including data mining, statistics, etc. It also helps in analyzing the results by plotting line graphs, bar graphs, etc. There are many functionalities accessed by drag and drop to the workspace or by double clicking to select. Using KNIME, we configured the function and executed it. First, we selected the dataset by browsing files on the system. The other option is that.csv files can be directly exported to the software and then they can be executed. Next the Partitioning tool was used to partition the data in 70:30 for classification methods like SVM and k-NN, and we also applied clustering algorithms like k-means and fuzzy c-means where data partitioning was not needed.
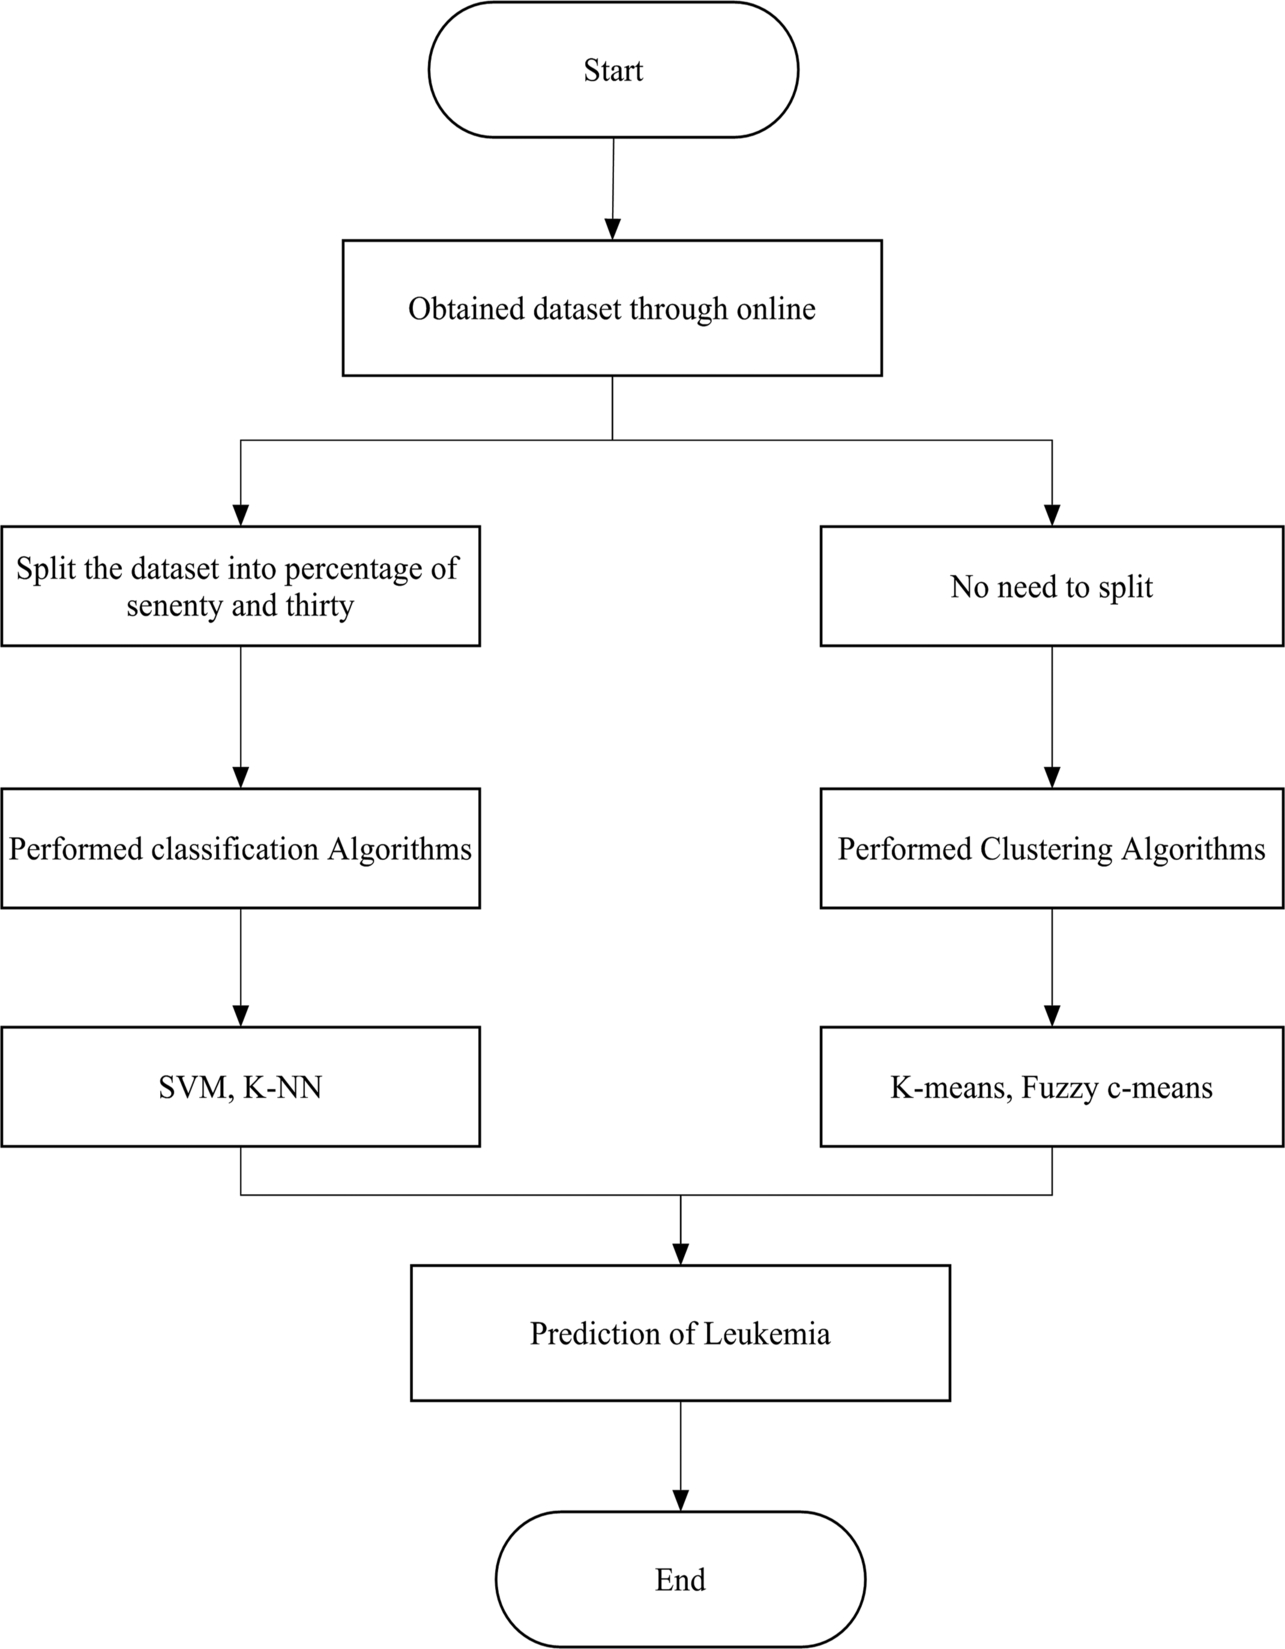
The proposed work consists of two phases: Phase I deals with the collection and visualization of datasets and Phase II deals with machine learning and data mining techniques for the prediction of leukemia.
In Fig. 1, it can be observed that the dataset has been collected online. First, we start or run the software and then import the collected online dataset. To perform the classification algorithms, we need to partition the dataset where clustering algorithms are not needed. In this work, SVM and k-NN were used for classification algorithms, whereas k-means and fuzzy c-means have been used as clustering algorithms. Finally, this algorithm predicts leukemia and our software work is finished.
The classification algorithms are briefly explained in the following paragraphs (Fig. 2).
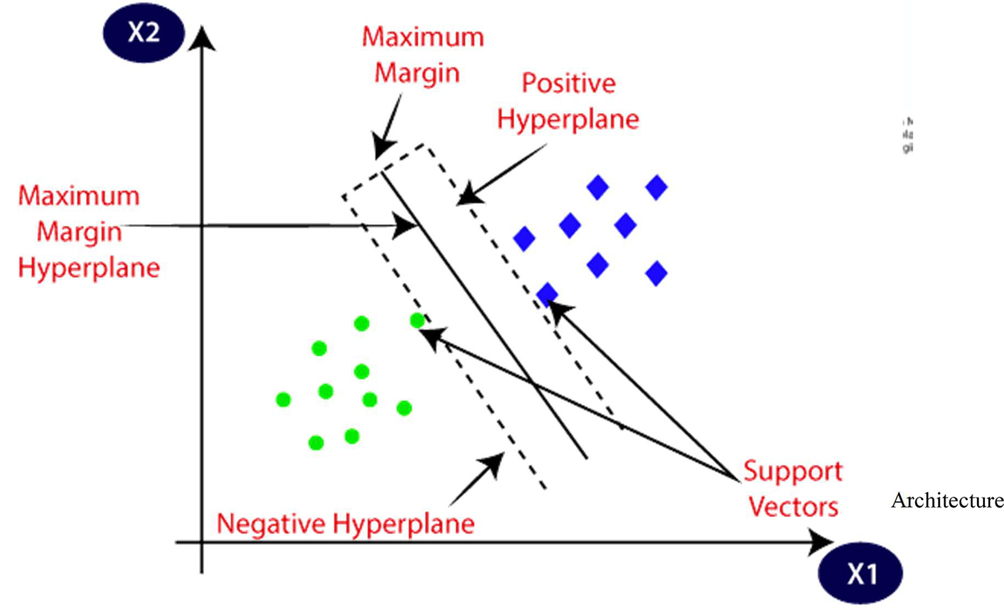
4.2.1: Support vector machine
Vladimir N. Vapnik and Alexey Ya. Chervonenkis invented the SVM algorithm in 1963. Corinna Cortes and Vapnik’s current standard incarnation (soft margin) was proposed in 1993 and published in 1995. The objective of the SVM algorithm is to find a hyperplane that best separates points in a hypercube. The nearest instances on either side of the boundary are called support vectors. The basic architecture of linear SVM is shown as:
The algorithms for SVM are noted as:
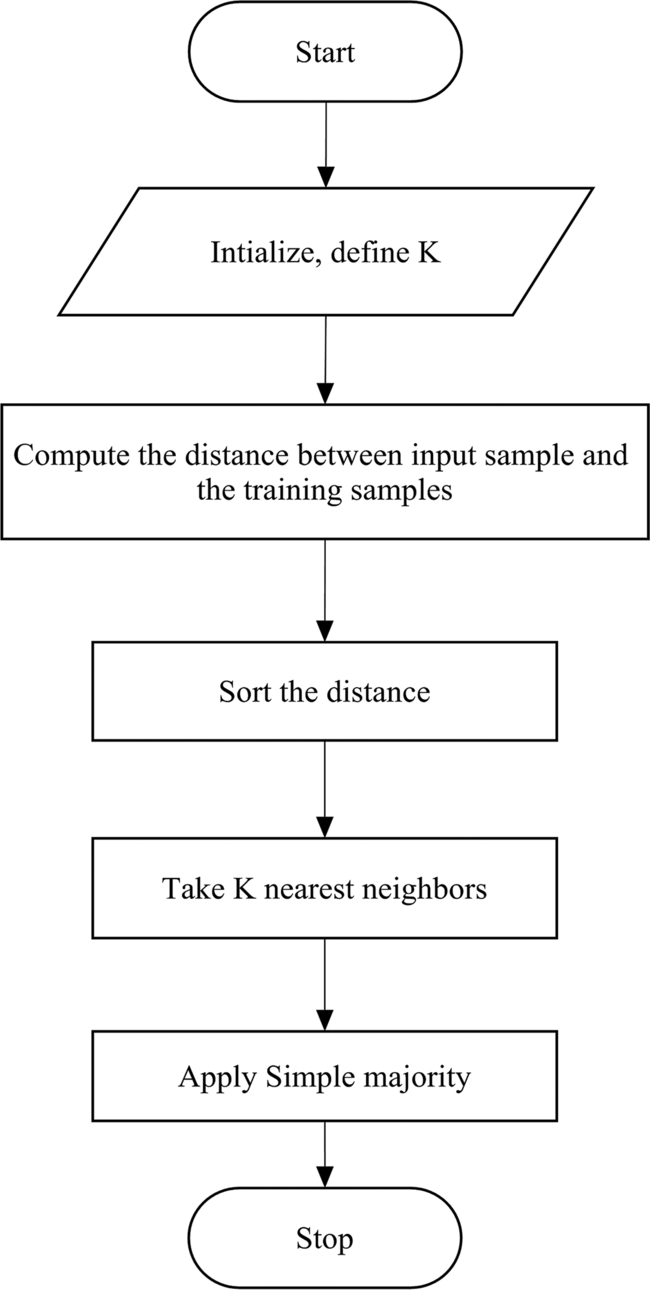
4.2.2: K-nearest neighbor
K-NN was introduced by Fix and Hodges in 1951. K-NN is a simple, powerful, nonparametric, lazy learning method utilized for classification. In the beginning of the 1970s, k-NN was being used in statistical estimation and pattern recognition. The same algorithm was used by Choubey et al. (2020b) for the classification of diabetes (Fig. 3).
The clustering algorithms are noted as:
4.2.3: K-means clustering
K-means clustering is an algorithm used to group the objects based on features into K number of groups. It works on an unlabeled dataset (unsupervised machine learning) (Fig. 4).
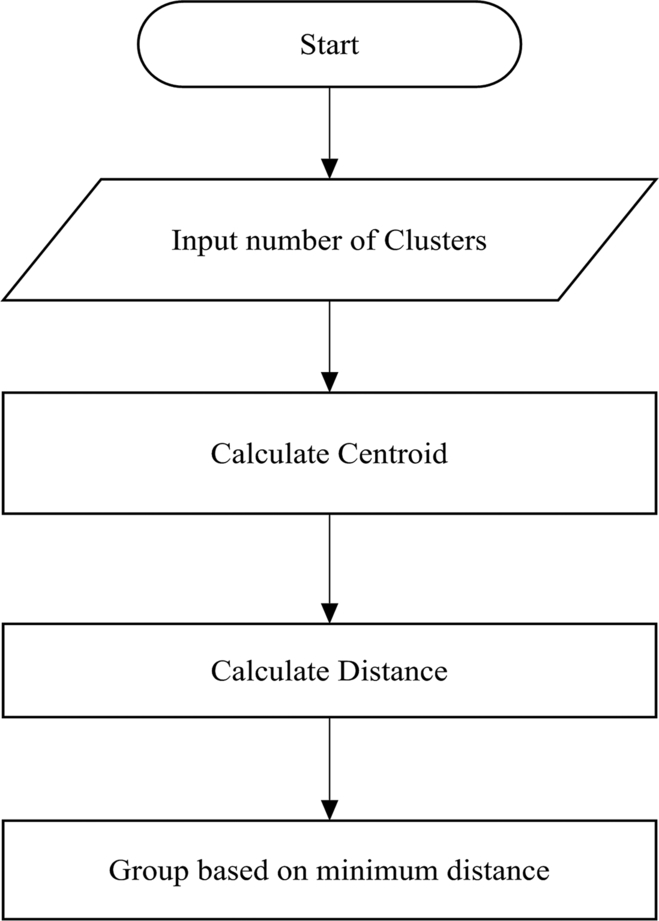
K-means will split a dataset into K clusters:
- • Where each observation in Ki is as similar to the others in that cluster as possible.
- • Where the data in Ki is as different as possible from the other clusters within K1………….N.
K-means clustering is an exploratory data analysis technique. The algorithms for k-means clustering are noted as:
4.2.4: Fuzzy c-means clustering
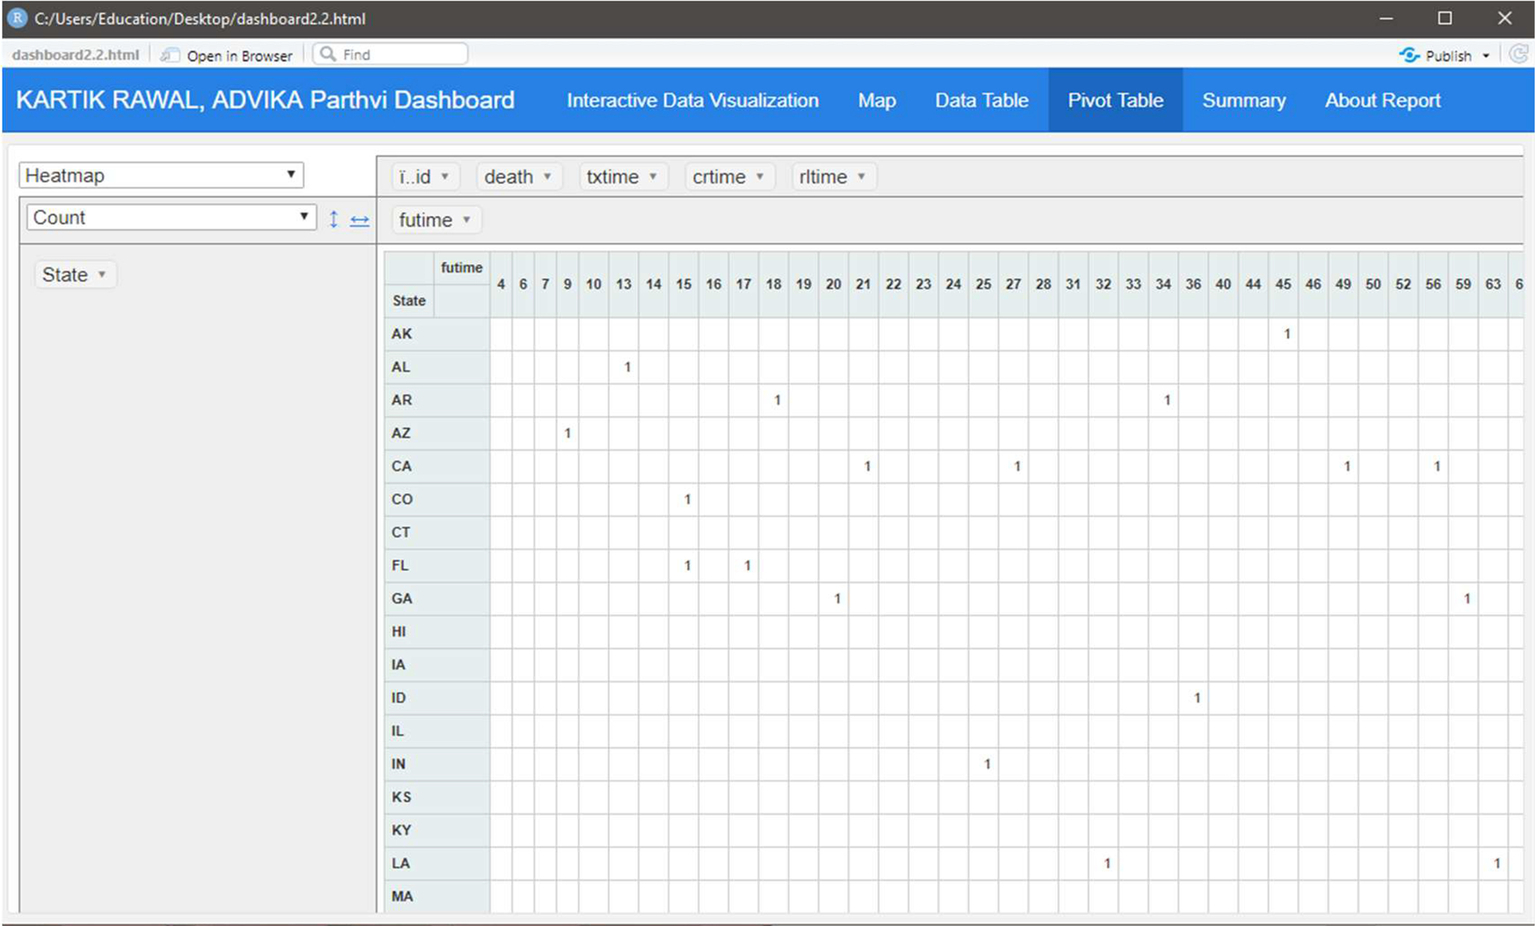
Dunn created the fuzzy C-means clustering method in 1973 and it was improved by Bezdek in 1981. It is commonly utilized in design acknowledgments. It depends on minimization of the accompanying target work:
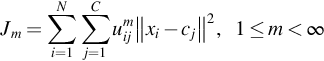
where m is any real number greater than 1, uij is the degree of membership of xi in the cluster j, xi is the ith of d-dimensional measured data, cj is the d-dimension center of the cluster, and ‖ * ‖ is any norm expressing the similarity between any measured data and the center. Fuzzy partitioning is carried out through an iterative optimization of the objective function shown previously, with the update of membership uij and the cluster centers cj by:
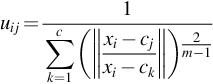
where
This iteration will stop when maxij{| uij(k + 1) − uijk | } < ɛ, where ɛis a termination criterion between 0 and 1, whereas k are the iteration steps. This procedure converges to a local minimum or a saddle point of Jm.
5: Simulation results and discussion
Every study must start with accurate data analysis. The myeloid dataset was used for the analysis, which is also available in R packages.
The performance evaluations of the classification algorithms used for leukemia are given in Table 3.
Table 3
| Dataset | Algorithms | Sensitivity/recall | Precision | F-Measure |
|---|---|---|---|---|
| Myeloid dataset | SVM | 0.9746 | 0.9746 | 0.9746 |
| K-NN | 0.9570 | 0.9570 | 0.9570 |

In Table 3, it may be observed that SVM performs better than k-NN classification algorithms.
The performance evaluations of the clustering algorithms used for leukemia are given in Table 4.
Table 4
| Dataset | Algorithm | F-Measure |
|---|---|---|
| Myeloid dataset | K-means | 0.819 |
| Fuzzy c-means | 0.829 |

In Table 4, it may be observed that fuzzy c-means performed better than the k-means algorithm.
Now for the analysis of clustering and classification methods as shown in the following figures.
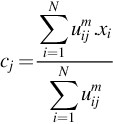
Fig. 5 shows estimates of victims.
In Fig. 5, the number of patients all over the country in different states are clearly visible. Also, different graphs have been created that give an idea of the demographics of leukemia.
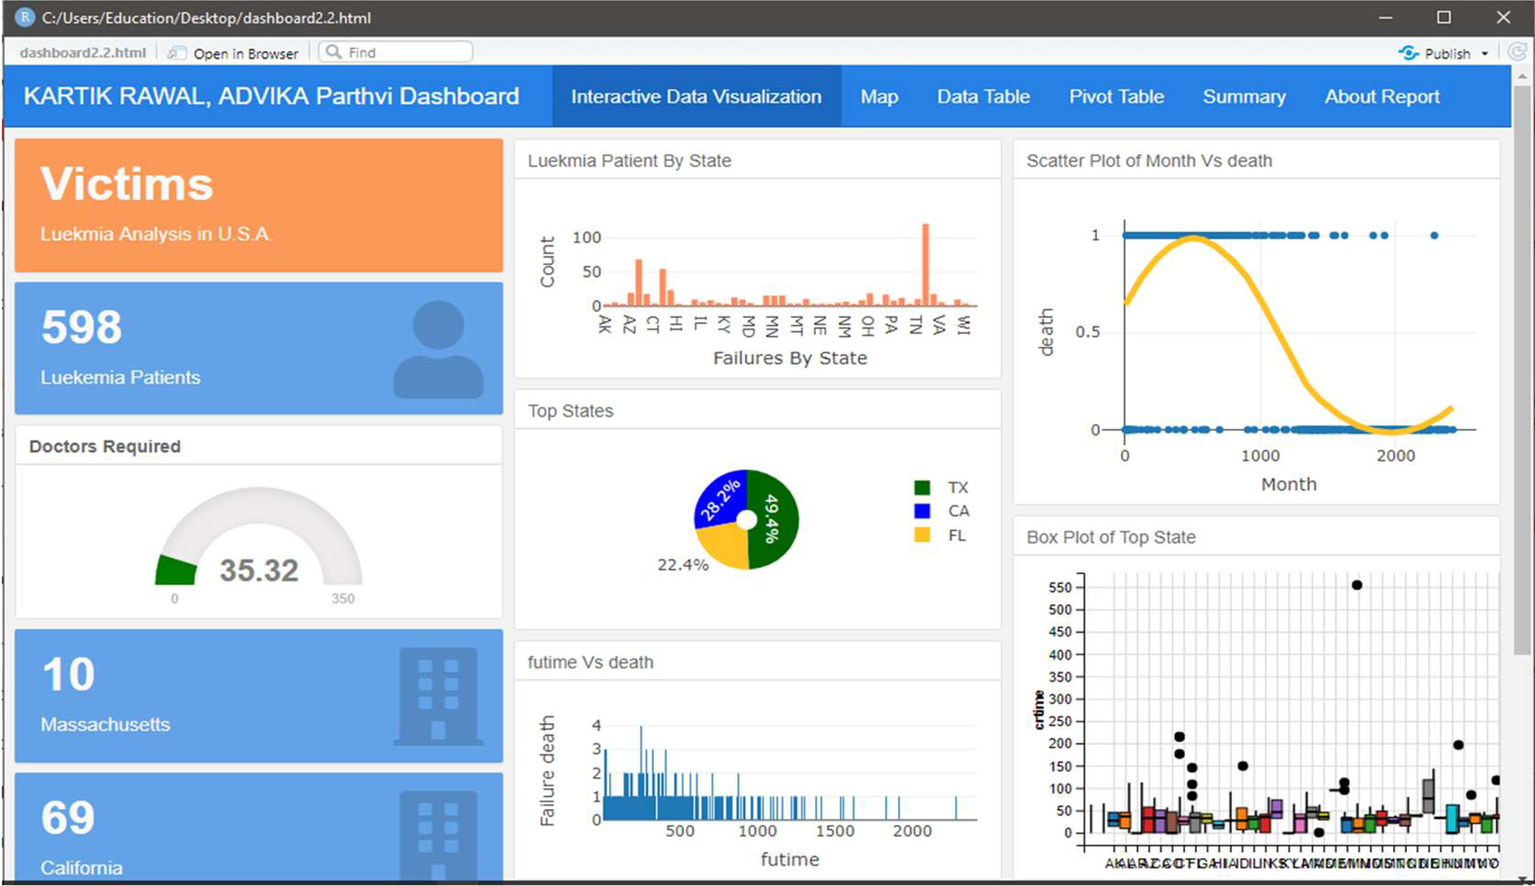
Fig. 6 indicates the spread of leukemia across different states in the United States.
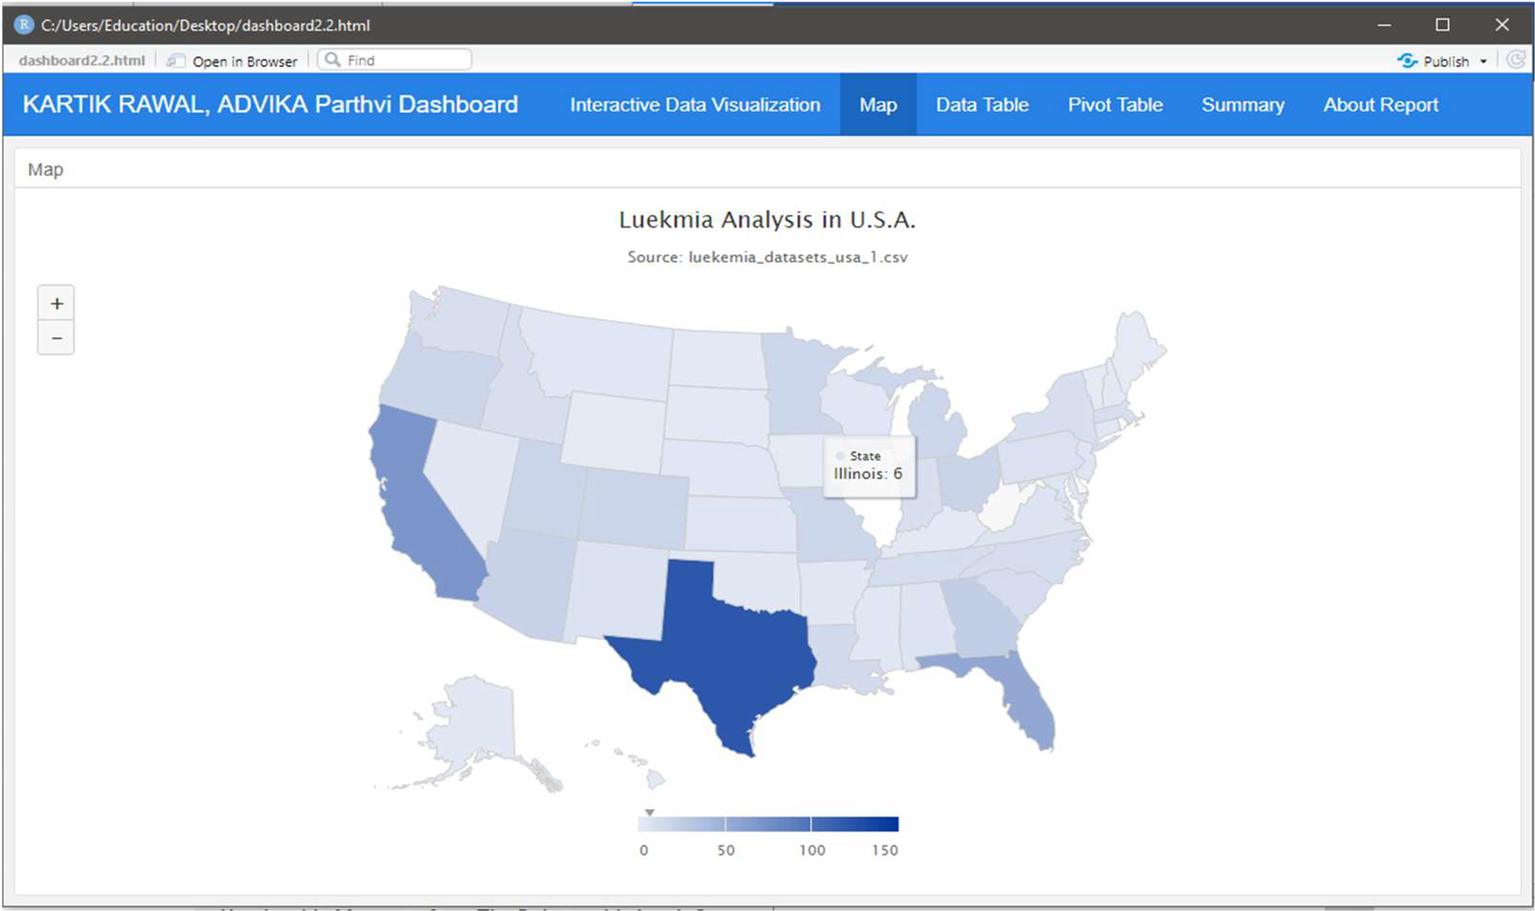
Fig. 7 shows the overall summary of the analysis of leukemia.

Fig. 7 depicts the overall summary of the data analysis report, including doctors required average rate of get infected and many more can be understood by the picture.
Fig. 8 indicates the pivot table for the myeloid dataset.
In Fig. 9, the basic workflow of k-means and fuzzy c-means clustering methods is clearly visible.
In Figs. 10 and 11, we may clearly see k-means clustering results with different numbers of clusters.
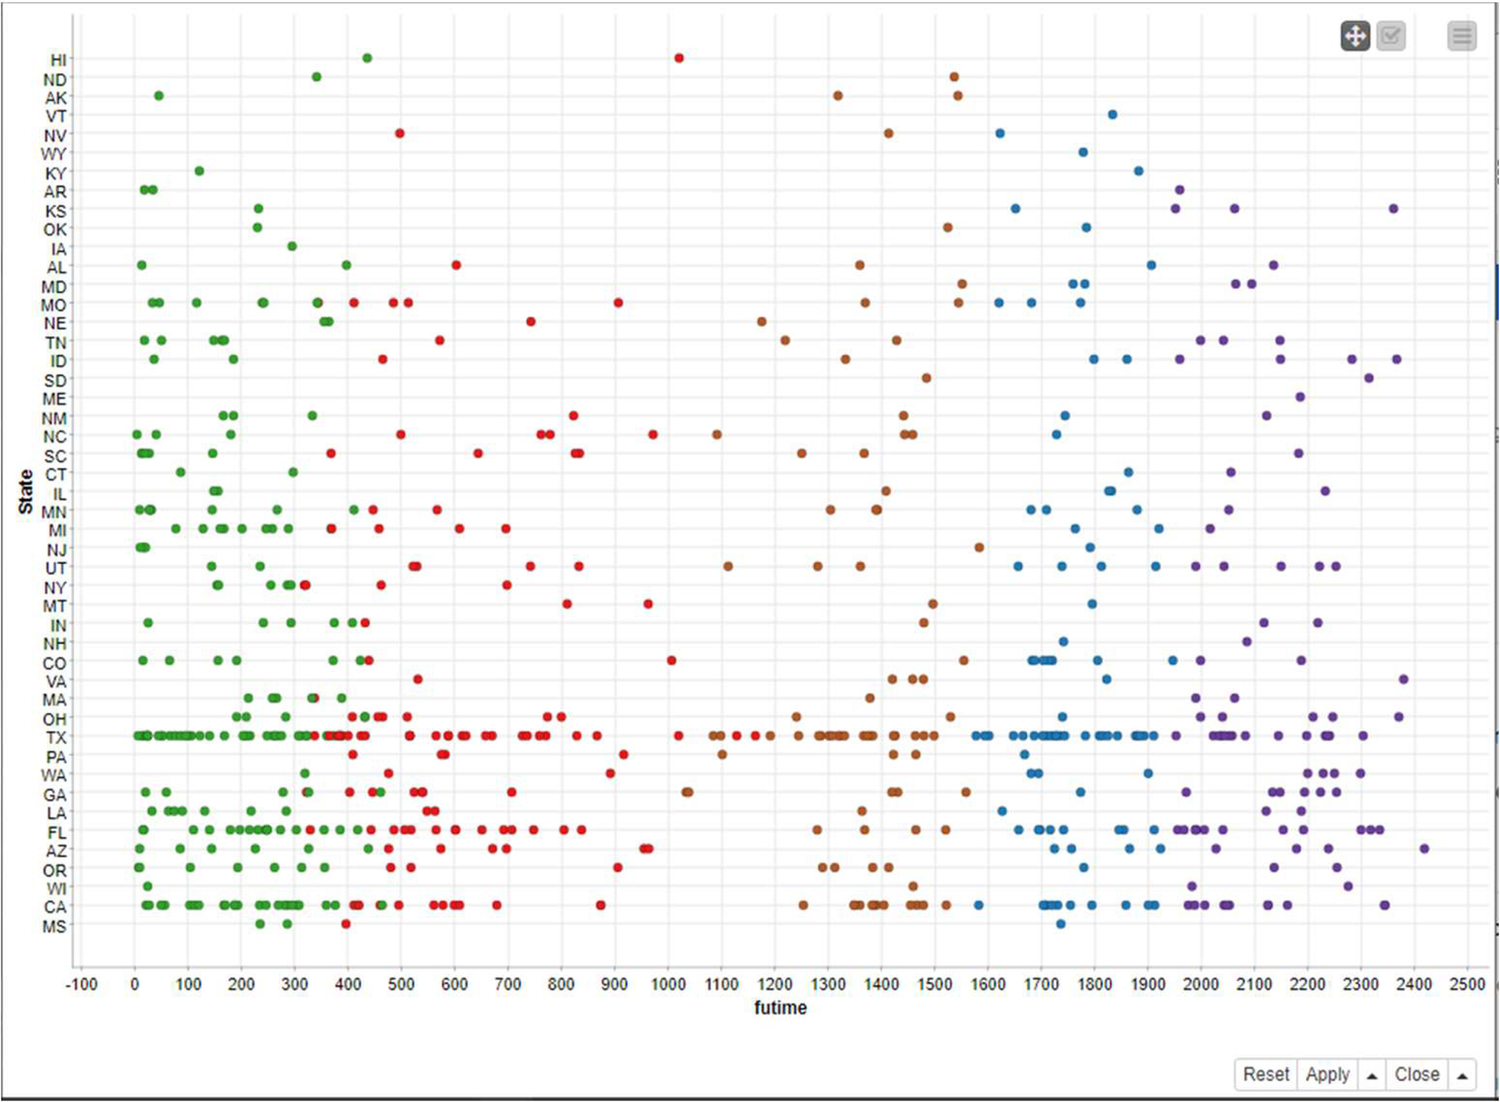
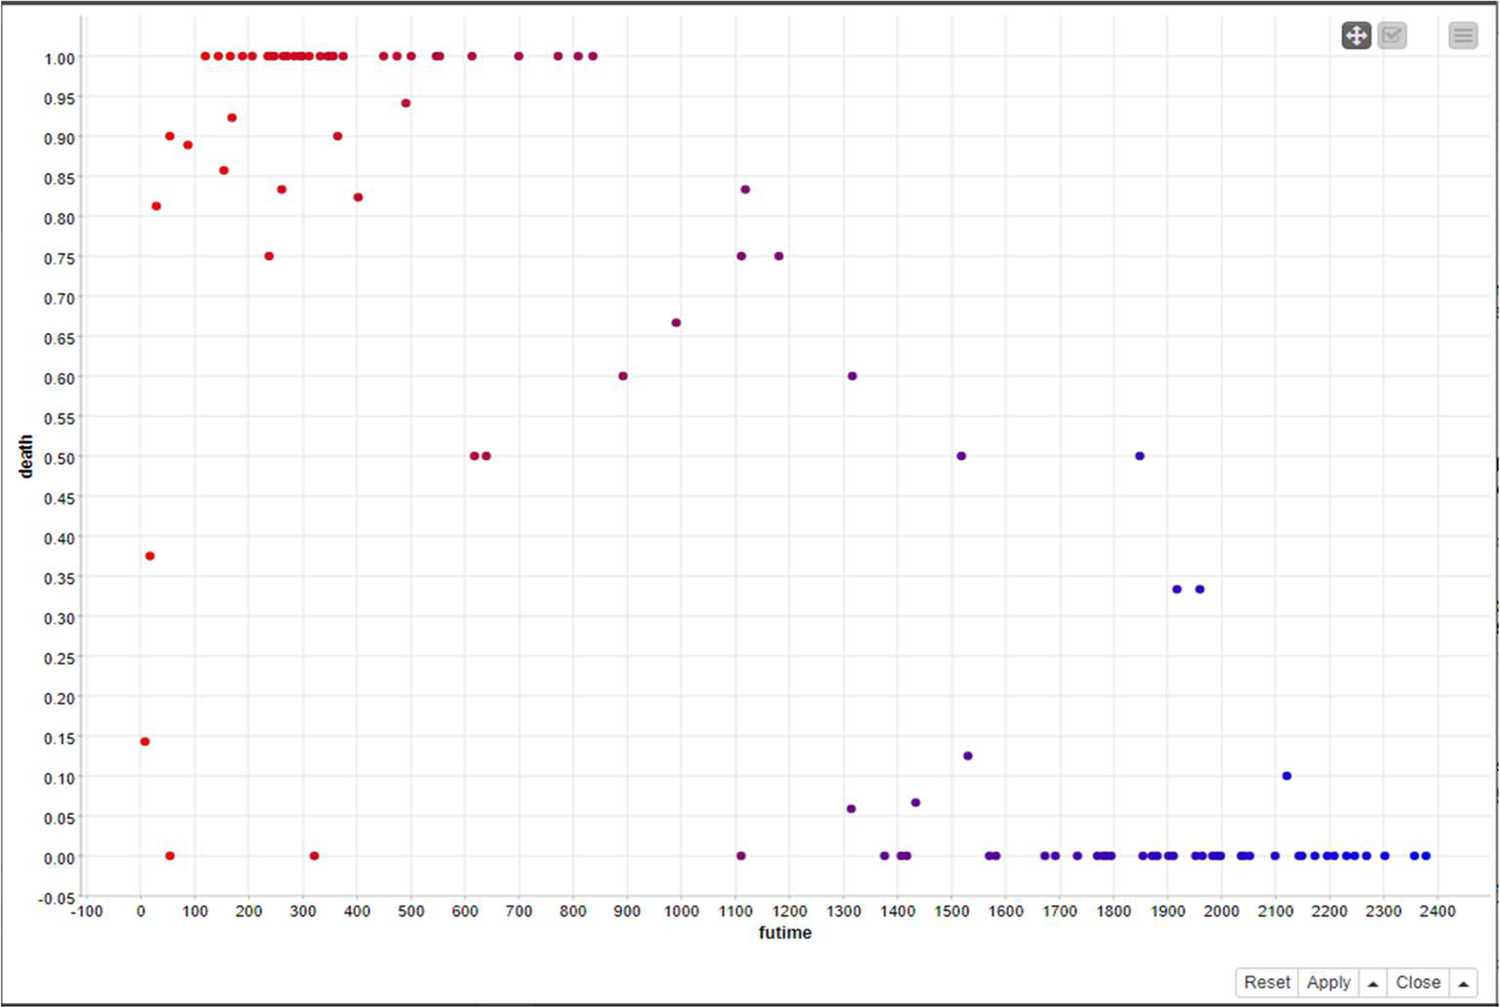
Fig. 12 represents the clusters formed by the fuzzy c-means method.
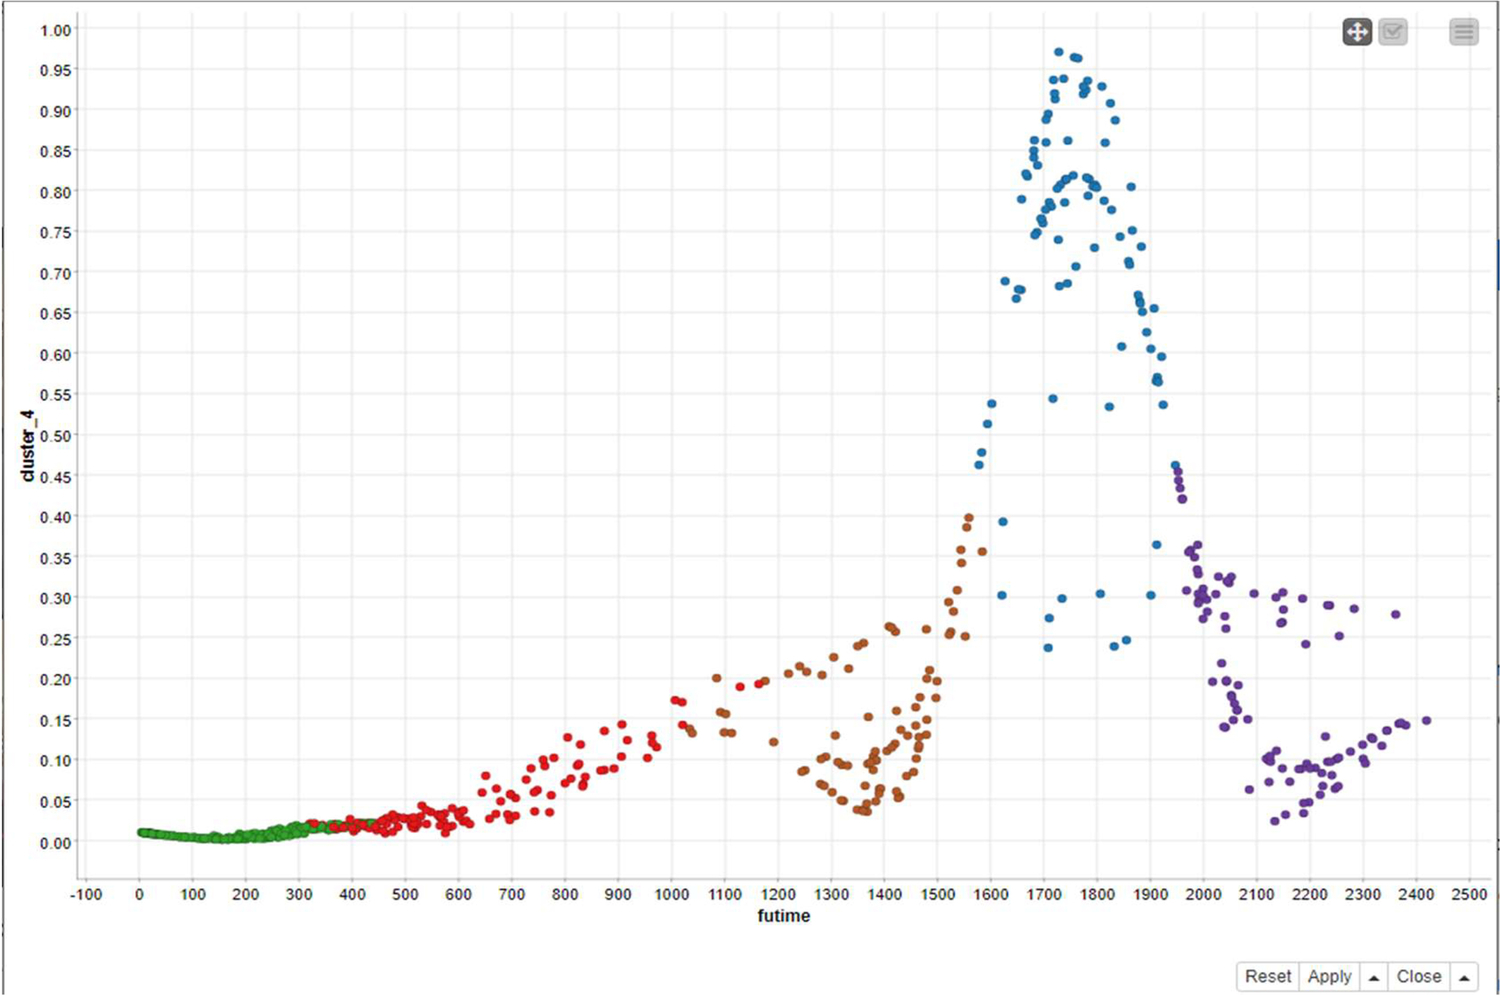
In Fig. 12, six clusters have been formed and respectively show “futime.” From this figure we can see that the clusters are forming wave-like patterns.
6: Conclusion and future directions
We have applied various algorithms to determine which one is most efficient in the diagnosis of leukemia. Results are shown in both graphical as well as tabular forms for the various algorithms that have been applied to leukemia. The KNIME was used to apply the algorithms and find an appropriate result for the classification and clustering methods of leukemia. The performance is different in each case and we have tried to find the most efficient algorithm for the diagnosis of leukemia. We have also studied the performance of various existing algorithms that have been used previously by fellow researchers. In this chapter we have utilized SVM and k-NN for classification and k-means and fuzzy c-means for clustering. Both the classification and clustering methods have been used in the prediction of leukemia.
The future directions for researchers are to deploy different deep-learning architectures for prediction of leukemia and compare these architectures to find those that perform best. We may also deploy deep-learning architectures for larger samples of datasets. Another future direction for researchers is the design of an automated detection system for leukemia blood cancer.