
Chapter 17: Performance evaluation of fractal features toward seizure detection from electroencephalogram signals
O.K. Fasil; R. Rajesh Department of Computer Science, Central University of Kerala, Kerala, India
Abstract
Electroencephalogram signals are the classical gold standard for the diagnosis of seizures. Important information that enables the effective detection of seizure is hidden due to the complex and chaotic nature of electroencephalogram signals. The capability of fractal dimension to extract complex information from signals or images is well utilized in various domains. In this chapter, the ability of three well-known fractal dimension feature extraction methods (e.g., Katz fractal dimension, Higuchi fractal dimension, and Petrosian fractal dimension) to classify epileptic and nonepileptic electroencephalogram signals is evaluated. The features are fed to support vector machine classifier for the classification of epileptic and nonepileptic electroencephalogram signals. The results of support vector machine classifier show that the fractal features are good measures to characterize the complex information of epileptic signals.
Keywords
Fractal dimension; Seizure; Detection; EEG; Epilepsy; Higuchi; Katz; Petrosian
Acknowledgments
The authors thank the Central University of Kerala for providing all research support for the work. The authors also thank the reviewers for critical review suggestions.
1: Introduction
Epilepsy is an onerous disorder that causes repetitive seizures in the central nervous system. Epilepsy affected a sizeable population across the globe (Thijs et al., 2019). The analysis of the frequency, severity, and duration of the seizures are indispensable in epilepsy treatment. Among various brain scanning techniques, electroencephalogram (EEG) has been extensively used because of its high temporal resolution and low cost (Tatum et al., 2018). Long-term clinical examination is essential in most of the epilepsy cases for effective diagnosis and treatment. Manual analysis of long-term EEG recorded as part of the clinical examination is a burdensome process and error prone. Many machine learning methods have been proposed during the past decades to automate the process of EEG analysis.
The EEG signals produced by the brain are nonlinear and chaotic in nature. Most of the machine learning methods require a large amount of data and much calculation time to analyze complex EEG signals. Dimensional complexity is mainly used to analyze the complex EEG signals. Generally, the dimensional complexity is obtained in phase space, which is only suitable to analyze long-duration events (Accardo et al., 1997). Since the seizure events are brief and in the time domain, fractal dimension (FD)-based features can be used for effective analysis of EEG. The ability of FD to analyze the irregular or complex shapes will help to characterize epileptic EEG efficiently (Lopes and Betrouni, 2009).
Many methods in literature utilized FD-based features to analyze EEG signals for various tasks. These tasks include the study of human EEG responses to odors (Şeker and Özerdem, 2018), depression detection (Mohammadi et al., 2019), analysis of states of consciousness and unconsciousness (de Miras et al., 2019), detection of Alzheimer’s disease (Al-Nuaimi et al., 2017; Smits et al., 2016), sleep analysis (Asirvadam et al., 2018; Liaw et al., 2017; Al-Salman et al., 2018), emotional recognition (Xu et al., 2019; Ruiz-Padial and Ibáñez-Molina, 2018), and motor imagery analysis (Liu et al., 2017). The FD-based features are also widely used for seizure/epilepsy detection problems. Wijayanto et al. (2019b) extracted Katz FD features from subbands of EEG signals for epilepsy identification. In another work of the same authors, they have extracted Higuchi FD along with Katz FD in the same way and achieved improved results (Wijayanto et al., 2019a). Major bottleneck with this method is the subband decomposition. The algorithm will be more suitable in real-time systems if it extract features from the original signal instead of subbands. Sharma and Pachori (2017) utilized tunable-Q wavelet transform (TQWT) to decompose the signal to various subbands and extracted Higuchi FD from these subbands to detect epileptic seizures. Dautov and Özerdem (2018) also used Higuchi FD in their work. An important study by Abdulhay et al. (2017) utilized Higuchi FD with wavelet-based entropy features and higher-order spectra features for effective identification of epilepsy. Moctezuma and Molinas (2020a) extracted Higuchi and Petrosian FD from intrinsic mode function (IMFs) obtained by empirical mode decomposition (EMD). Authors extracted Teager and instantaneous energy and DFA features along with FD and used for seizure detection.
In the recent work, David et al. (2020) used multifractal detrended fluctuation analysis and Hurst exponent with FD to study the characteristics of EEG signals of epileptic patients. Wijayanto et al. (2020) extracted Higuchi FD from various EEG subbands (such as delta, theta, alpha, beta, and gamma) for classifying ictal and interictal EEG signals. Higuchi FD feature is also utilized in another work by Choubey and Pandey. Authors also extracted sample entropy with FD (Choubey and Pandey, 2020). Upadhyaya et al. (2019) used Higuchi FD to determine focal epilepsy by analyzing EEG signals. Similarly, Chakraborty et al. (2019) extracted FD features from DWT and used for classifying normal, interictal, and ictal states of epilepsy with statistical and nonlinear features. In another work, FD features are extracted from EMD and DWT used to maximize the classification result by reducing the number of channels (Moctezuma and Molinas, 2020b). In a focal identification work, Dalal et al. (2019) decomposed EEG signal into various subbands using flexible analytic wavelet transform prior to FD feature extraction.
The common factor in all studies is exposed as none of the works used FD feature alone for epilepsy detection. The works either used various features along with the FD or extracted from different transformed domains like EMD or DWT for enhanced results. The FD features extracted from the time domain will reduce the extraction time by avoiding further transformations. Moreover, the individual performance of various FD features to detect seizures is rarely studied in literature and is highly required for forthcoming research. In-depth understanding of the individual performance of FD features will ease the implementation of real-time seizure detection systems. Furthermore, it opens the door for future research.
In this work, the seizure detection efficiency of three widely used FD feature extraction methods, such as Katz, Higuchi, and Petrosian, is compared. One of the universally accepted epilepsy EEG dataset named as Bonn EEG dataset is considered for all experiments. The remaining sections of this chapter are organized as follows: Section 2 describes the details of three FD techniques. A brief description of the dataset is given in Section 3. The experimental setup of the study is explained in Section 4, and Section 5 presents the results with discussions. Section 6 will conclude the chapter with future directions.
2: Fractal dimension
The fractals are self-similar patterns which appear across various scales (Lopes and Betrouni, 2009). FD is a statistical quantity of fractals complexity, which will describe how complex a self-similar pattern is. FD is widely used to characterize chaotic and nonlinear signals because of its ability to extract the complexity of signals in the time domain (Raghavendra and Dutt, 2010). In this work, three FDs, such as Katz, Higuchi, and Petrosian, are studied. Brief descriptions of each FD are given in the following sections.
2.1: Katz fractal dimension
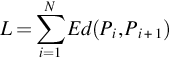
The Katz FD is proposed in 1988 by Katz (1988). In this method, the FD (D) of the waveforms can be estimated as
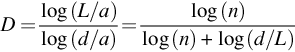
where L is the total length of the wave and calculated as the sum of the Euclidean distance between successive points Pi and Pi+1 in the wave.
where a is defined as the average of Euclidean distance between successive points in the wave.
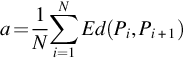
According to this method, n is defined as the number of steps in the wave and computed as n = L/a. d is the diameter of the wave and calculated as the maximum distance between the starting point and any other points in the wave.
2.2: Higuchi fractal dimension
In Higuchi method (Higuchi, 1988), the FD of the waveform x(n), ![]() with length N can be computed with the following steps (Sharma et al., 2017). First, from each wave k subwaves can be formed as
with length N can be computed with the following steps (Sharma et al., 2017). First, from each wave k subwaves can be formed as
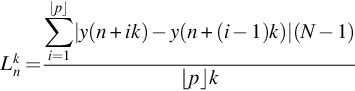
where ![]() , where n is the starting time and k is the interval time. Here, p = ⌊(N − n)/k⌋. The average length
, where n is the starting time and k is the interval time. Here, p = ⌊(N − n)/k⌋. The average length ![]() of the obtained subwaves is calculated as
of the obtained subwaves is calculated as
Then, the average ![]() for
for ![]() will be calculated and plot the graph of
will be calculated and plot the graph of ![]() against
against ![]() . After applying the least-squares linear best-fitting method, the coefficient of linear regression of the plot will be considered as the FD of the wave (Raghavendra and Dutt, 2010).
. After applying the least-squares linear best-fitting method, the coefficient of linear regression of the plot will be considered as the FD of the wave (Raghavendra and Dutt, 2010).
2.3: Petrosian fractal dimension
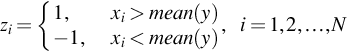
Petrosian method (Petrosian, 1995) computes the FD by transforming the original signal into binary sequence. The Petrosian FD of a signal ![]() with length N and suppose
with length N and suppose ![]() are series points in the signal, then first binary sequence Zi will be constructed as follows (Shi, 2018):
are series points in the signal, then first binary sequence Zi will be constructed as follows (Shi, 2018):
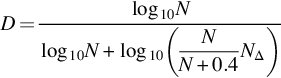
Then, the total number of sign changes NΔ in the binary sequence is calculated. Then, the Petrosian FD can be computed as
3: Dataset
A freely available benchmark dataset named as Bonn University EEG dataset is used for all experiments in this work (Andrzejak et al., 2001). Dataset consists of EEG signals from five epileptic patients and from five healthy subjects. Five sets of EEG signals (each contains 100 signals) are available in this dataset. Two sets, such as group A and group E, are considered in this study (seizure vs. nonseizure classification). Signals in group A are collected from healthy subjects in eye-open state (nonseizure signals) and signals in the group E are collected from epileptic subjects during seizure activity (seizure signals). Each signal in the dataset is 23.6 s duration and sampled at 173.61 Hz.
4: Experiments
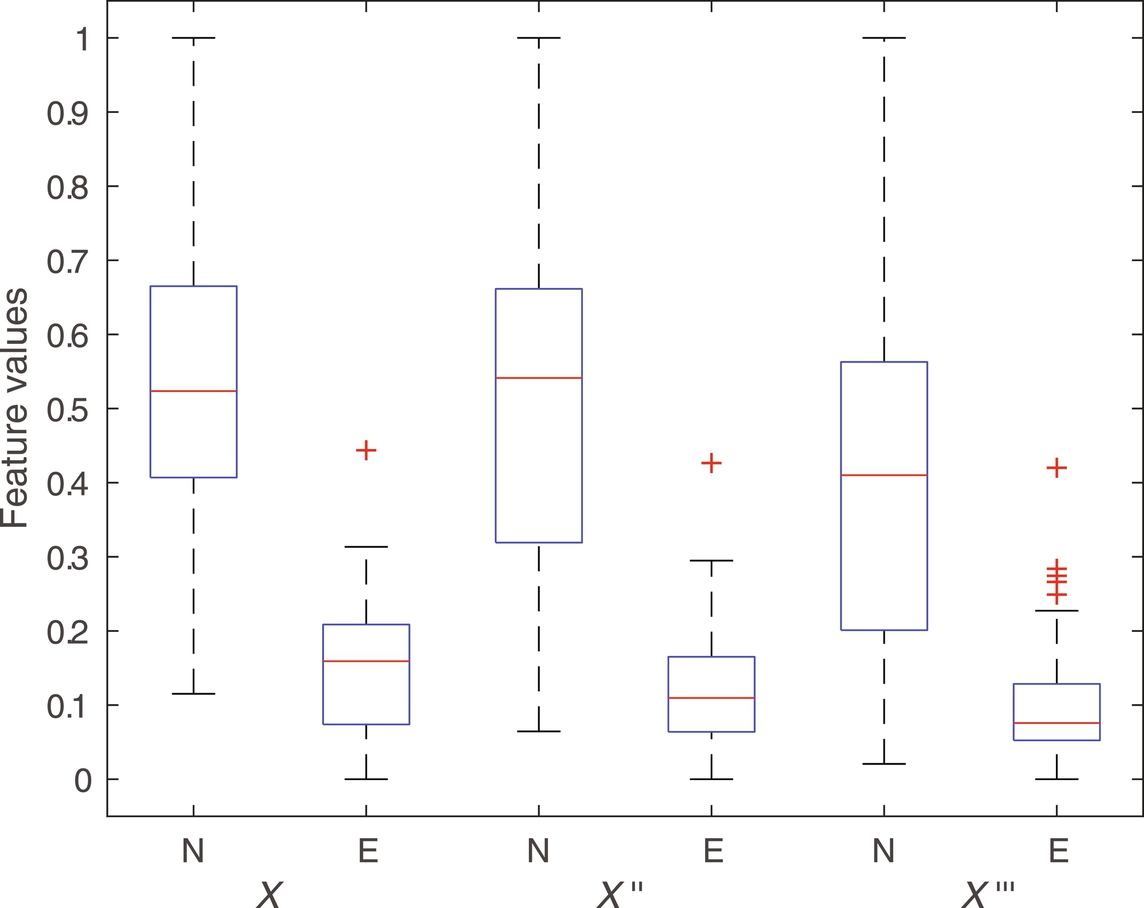
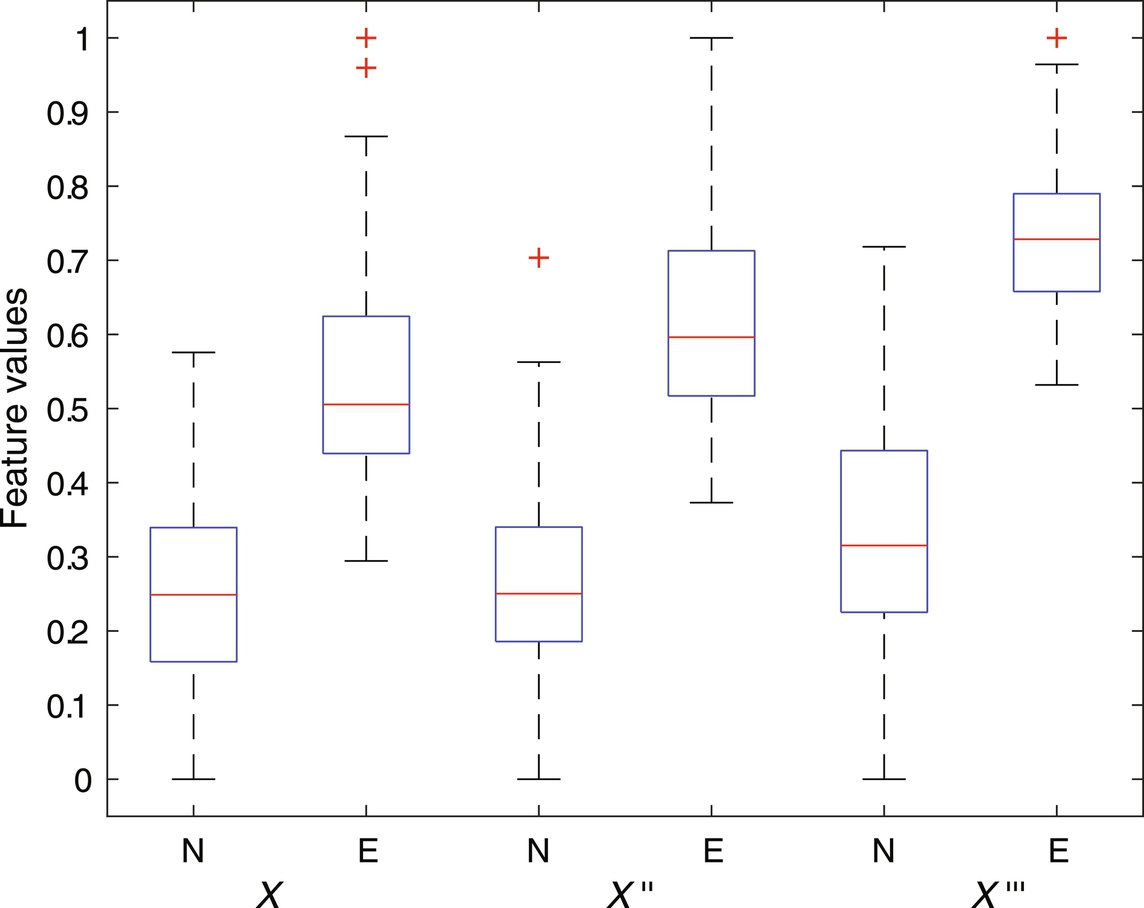
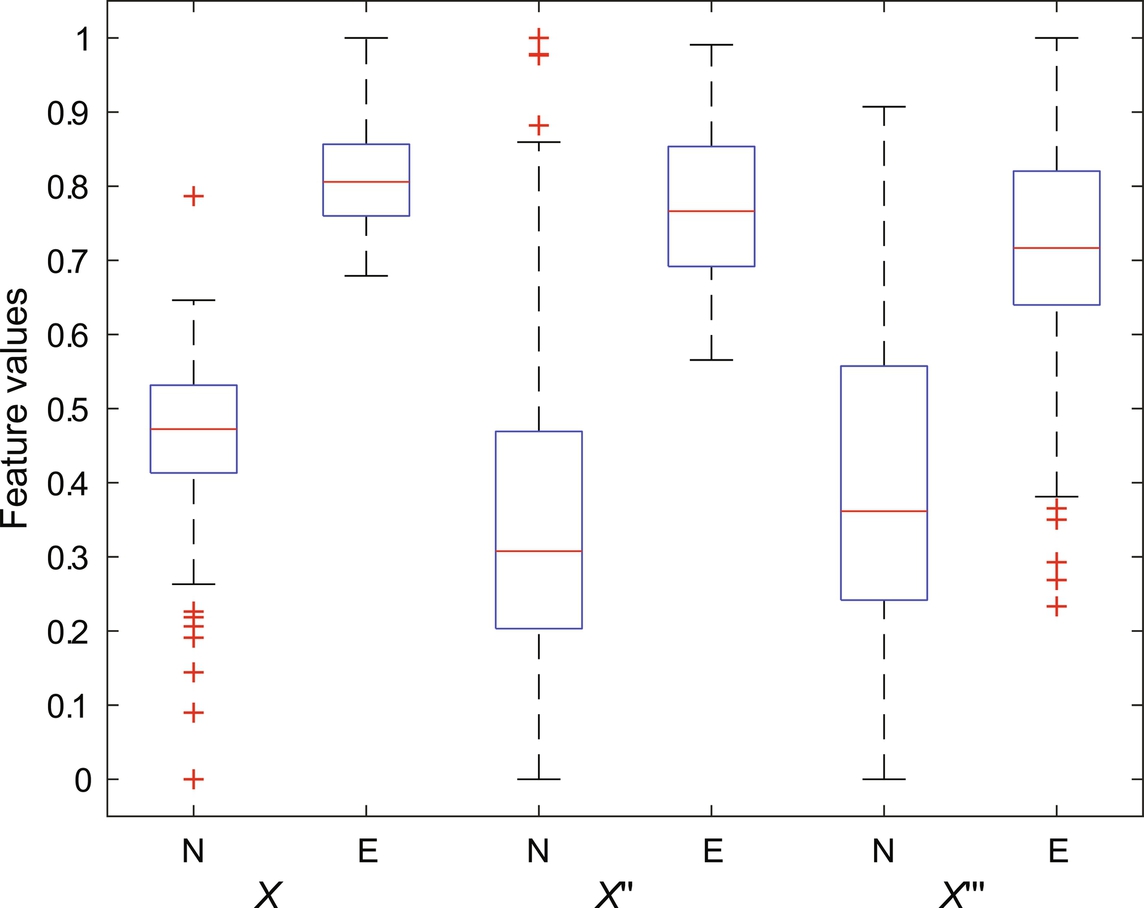
The capacity of fractal features to discriminate between seizure signals (labeled as E) versus nonseizure (labeled as N) signal has experimented in this work. As a preprocessing step, signals are first filtered with sixth-order butter-worth filter to remove unnecessary frequencies. In addition to the original signals (labeled as x), first and the second derivative of each signal (labeled as x′ and x″, respectively) are constructed as done in Fasil and Rajesh (2019) and considered for feature extraction along with the original signal. The 23.6 s duration signals are further segmented into 10 nonoverlapping segments (2.36 s each) as suggested in Rajesh et al. (2018). FDs are computed from all segments and mean FDs across all segments are considered as features. The box plot of extracted Katz FD, Higuchi FD, and Petrosian FD features are shown in Figs. 1–3, respectively. It can be clearly seen that the feature is discriminating between seizure and nonseizure effectively. All experiments are carried out in Matlab environment on a Windows system with 4 GB RAM and Intel core i5 processor.
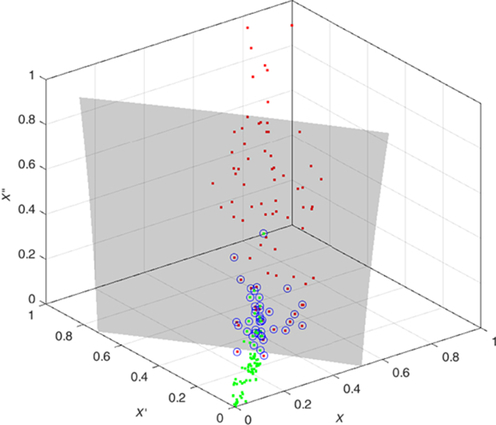
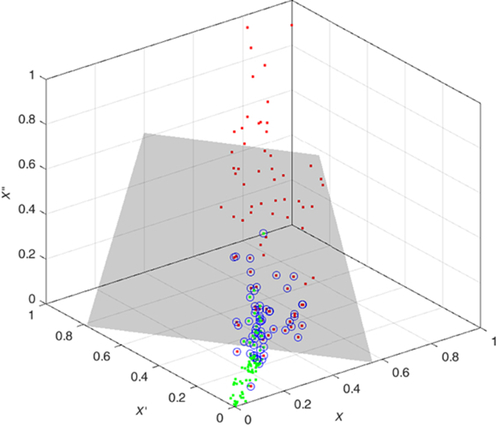
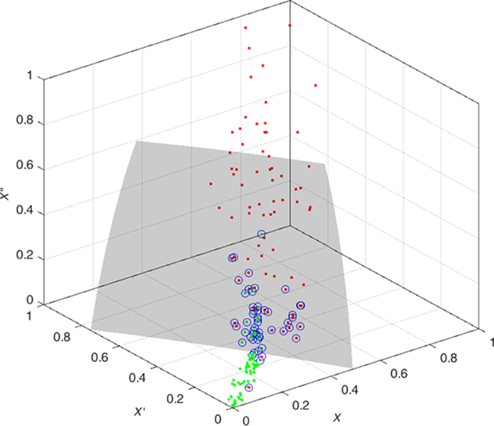
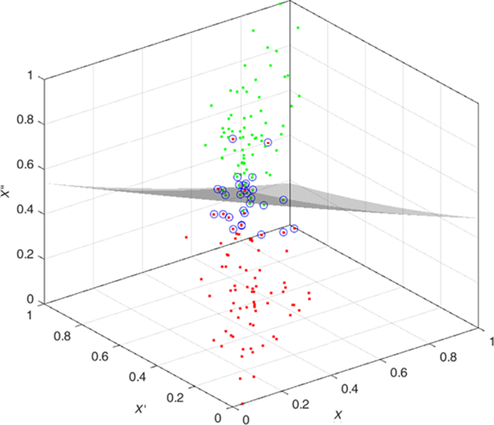
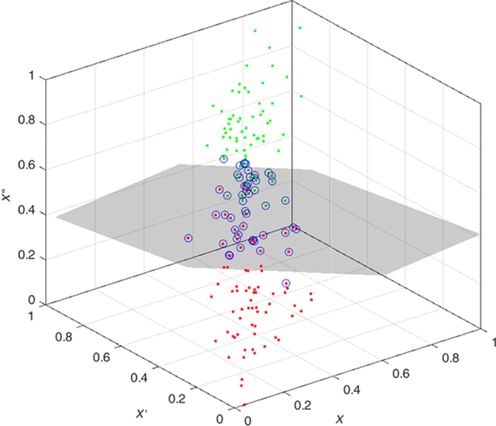
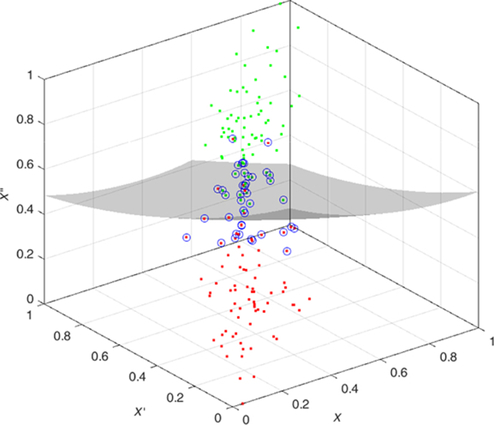
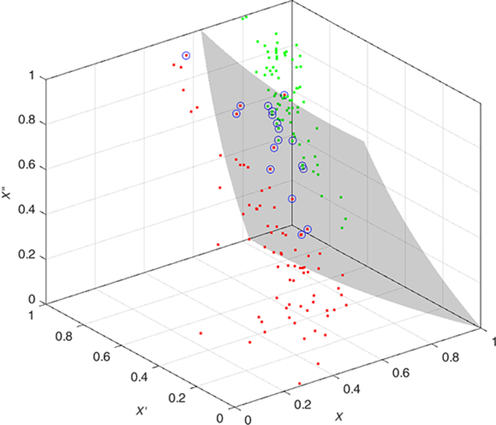
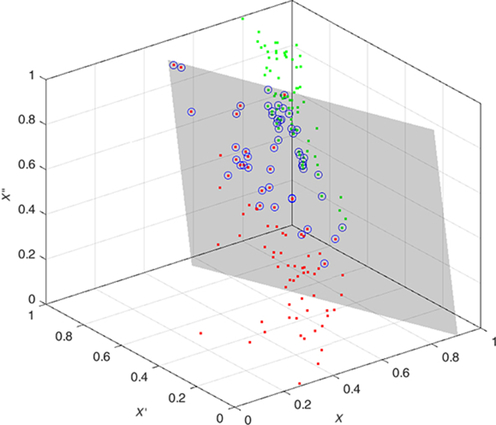
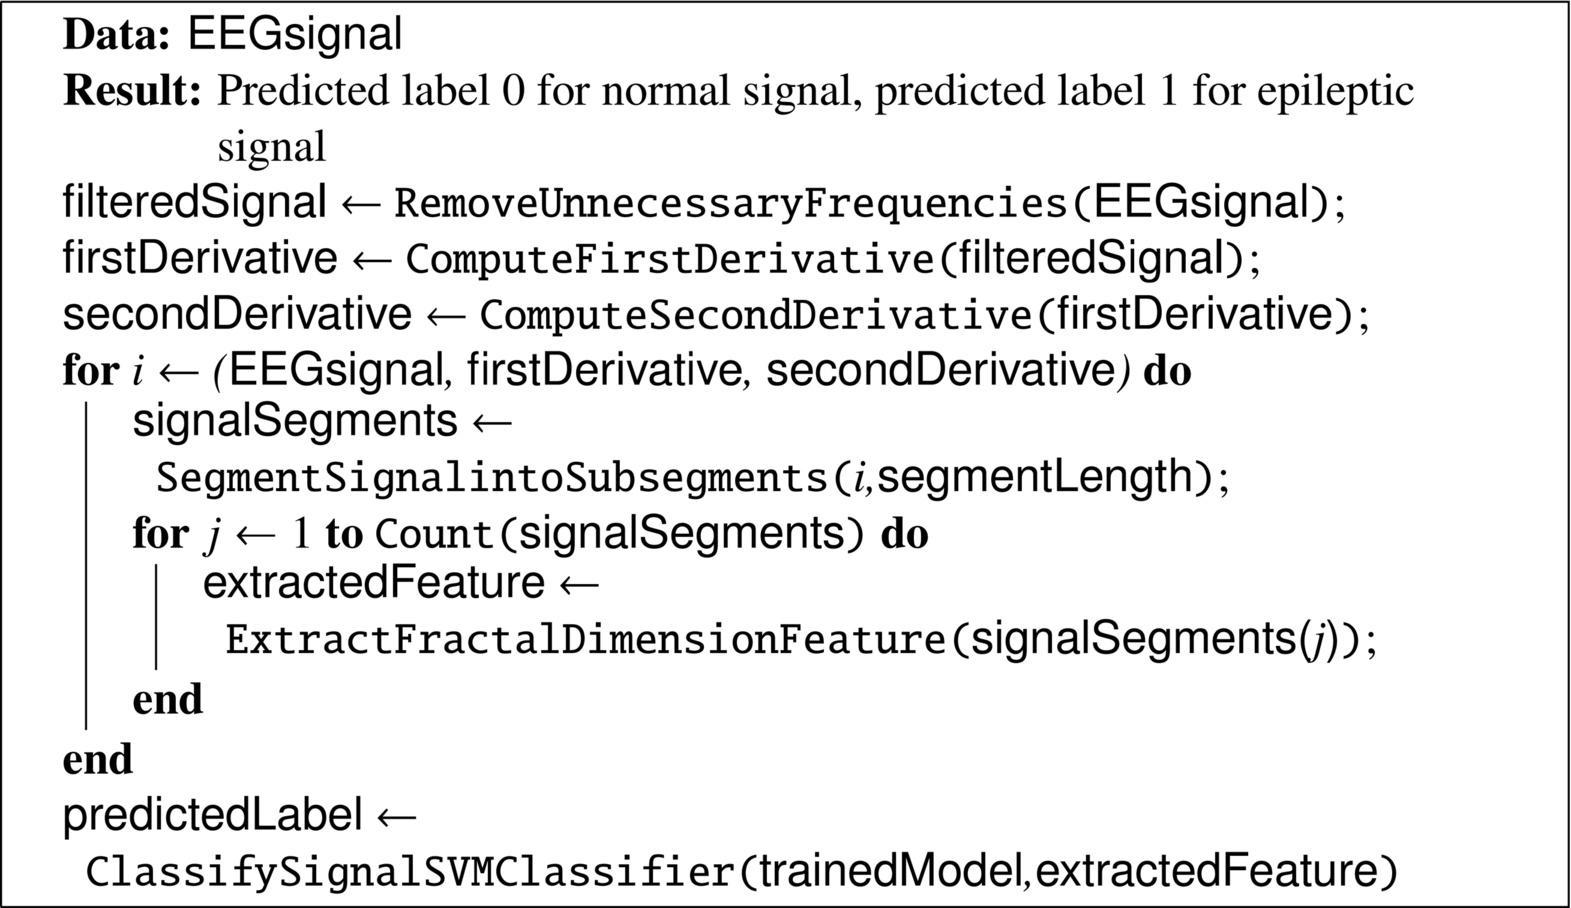
The features are fed to a well-known classifier support vector machine (SVM) for the classification of seizure and nonseizure. The performance in various SVM kernels (polynomial, RBF, and linear) is studied in this work. The decision boundary of SVM classifier in various kernels for Katz FD, Higuchi FD, and Petrosian FD features is shown in Figs. 4–6, respectively. A pseudo-code for the proposed epilepsy EEG signal classification method is shown in Algorithm 1.

Algorithm 1
Pseudocode for proposed epilepsy EEG signal classification method.
5: Results and discussion
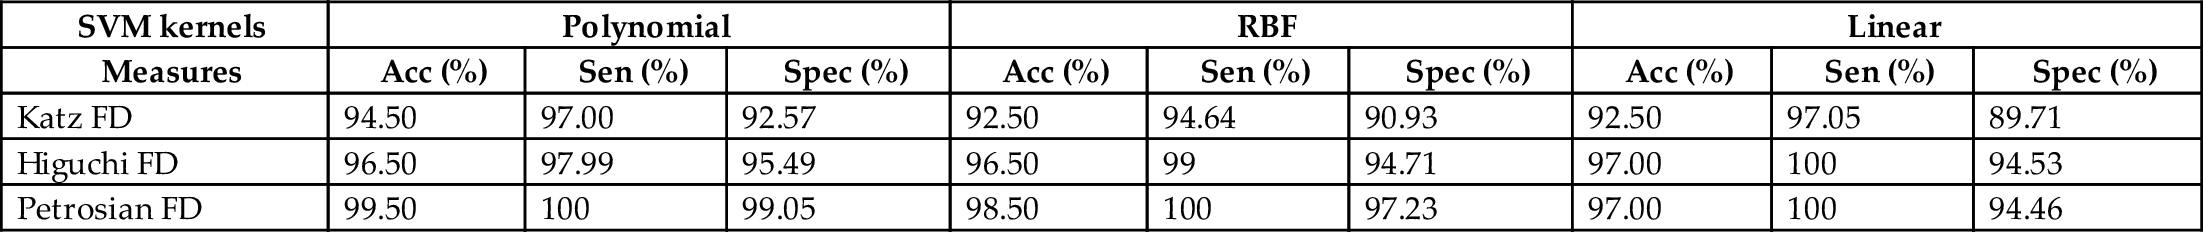
The performance of FD features to discriminate seizure, and nonseizure EEG signals is evaluated with SVM classifier in various kernels. The result of the experiments in various SVM kernels is given in Table 1. It is clear that the Petrosian FD features have achieved the highest accuracy of 99.50%. Similarly, Petrosian FD features achieved 100% sensitivity in all SVM kernels. Among different kernels, polynomial kernel produces better results. The performance of Higuchi FD features is better than the Katz FD feature. In brief, all FD features have produced better results in discriminating seizure and nonseizure EEG signals. The computation of FD features is also not complicated. The results obtained in this study suggest that the FD features can be used to characterize epileptic EEG signals and can be implemented in automated detection systems.
Table 1
| SVM kernels | Polynomial | RBF | Linear | ||||||
|---|---|---|---|---|---|---|---|---|---|
| Measures | Acc (%) | Sen (%) | Spec (%) | Acc (%) | Sen (%) | Spec (%) | Acc (%) | Sen (%) | Spec (%) |
| Katz FD | 94.50 | 97.00 | 92.57 | 92.50 | 94.64 | 90.93 | 92.50 | 97.05 | 89.71 |
| Higuchi FD | 96.50 | 97.99 | 95.49 | 96.50 | 99 | 94.71 | 97.00 | 100 | 94.53 |
| Petrosian FD | 99.50 | 100 | 99.05 | 98.50 | 100 | 97.23 | 97.00 | 100 | 94.46 |
A comparison of the results obtained from this work and previous works in the literature is presented in Table 2. The results indicate that the method experimented in this work with FD features are producing promising results.
Table 2
| Reference | Features | Accuracy (%) |
|---|---|---|
| Subasi et al. (2019) | DWT coefficients | 97.87 |
| Lee et al. (2014) | WT, PSR, ED | 98.17 |
| Hassan et al. (2020) | NIG pdf | 98.33 |
| Polat and Güneş (2007) | Welch PSD | 98.72 |
| San-Segundo et al. (2019) | Raw EEG with CNN | 99.00 |
| Hassan et al. (2020) | NIG pdf | 99.00 |
| Fu et al. (2014) | TFR image | 99.125 |
| Guo et al. (2010) | ApEn | 99.38 |
| This work | Petrosian FD | 99.50 |
6: Conclusion
Comparison of three widely used FD-based features such as Katz, Higuchi, and Petrosian is carried out in this work. More specifically, the capacity of this feature to discriminate seizure and nonseizure EEG signals has experimented with a benchmark dataset. The results in SVM classifier show that the FD features are very effective to detect seizure EEG signals. The experiments are carried out in different kernels of SVM. Among these three FD features, Petrosian-based features in SVM classifier with polynomial kernel produced the highest accuracy. The computational simplicity of FD features will facilitate the development of a real-time system with less effort.
In future, in order to generalize, the proposed method will experiment with the various datasets. Further, the performance of fractal features to predict the chances of seizures prior to the event will be studied.