
Chapter 18: Integer period discrete Fourier transform-based algorithm for the identification of tandem repeats in the DNA sequences
Sunil Datt Sharma; Pardeep Garg Department of Electronics and Communication Engineering, Jaypee University of Information Technology, Solan, India
Abstract
In this modern era, genomics signal processing is playing an important role to understand the genomics data and biological functionalities of living organisms. The deoxyribonucleic acid (DNA) sequences are found in the genome of living organisms. Based on the studies, it has been found that the DNA sequences contain tandem repeats, and expansion of these tandem repeats is accountable for the diseases like Huntington disease, Mytonic Dystrophy, Spinocerebellar Ataxia, Friedreich Ataxia (FRDA), Fragile X syndrome, and other diseases. Tandem repeats are also useful for other studies like DNA fingerprinting, an area population’s study, and DNA forensics analysis, etc. Therefore, we have proposed an integer period discrete Fourier transform (IPDFT)-based algorithm for the detection of the tandem repeats in DNA sequences. The comparison of the proposed algorithm’s performance has also been done with existing methods.
Keywords
Tandem repeats; DNA sequences; Discrete Fourier transform; Genomics signal processing; Health informatics
1: Introduction
Most of the DNA sequences possess specific repeated patterns of particular periods and hence the identification of these repeats plays a significant job to analyze the DNA sequences. There exists an association of repeated patterns with various diseases. It is well known that a string of nucleotides constitute the DNA sequences. These nucleotides are guanine (G), adenine (A), thymine (T), and cytosine (C). The respective periodicities exist in DNA sequences because of various nucleotide repeat patterns. The various biological functionalities of the living organism occur because of these repetitive patterns. Therefore, detection and analysis of repeated patterns in DNA sequences play a significant role in the field of biology, medicine, disease diagnosis, and forensic sciences (Gupta and Prasad, 2018). The categorization of repeats existing in DNA sequences can be done as tandem and interspersed repeats, and it has been shown in Fig. 1A and B, respectively.
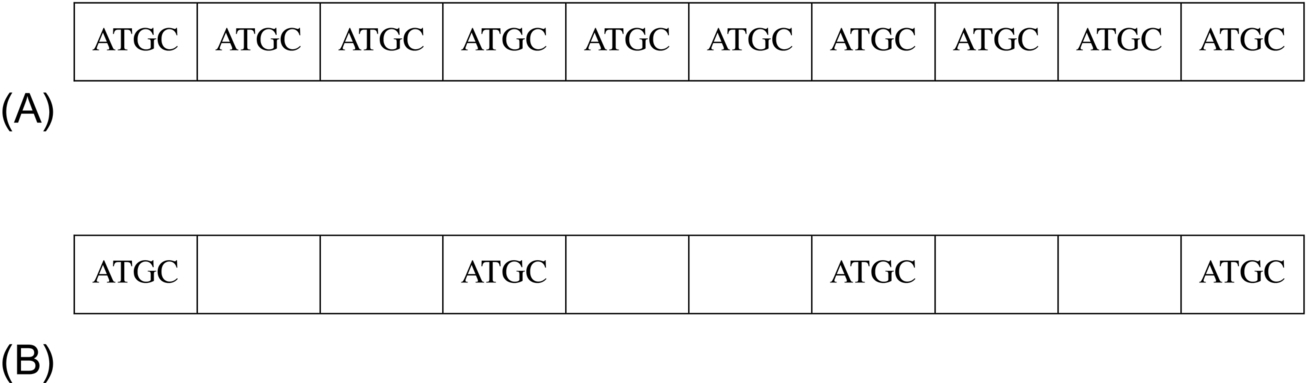
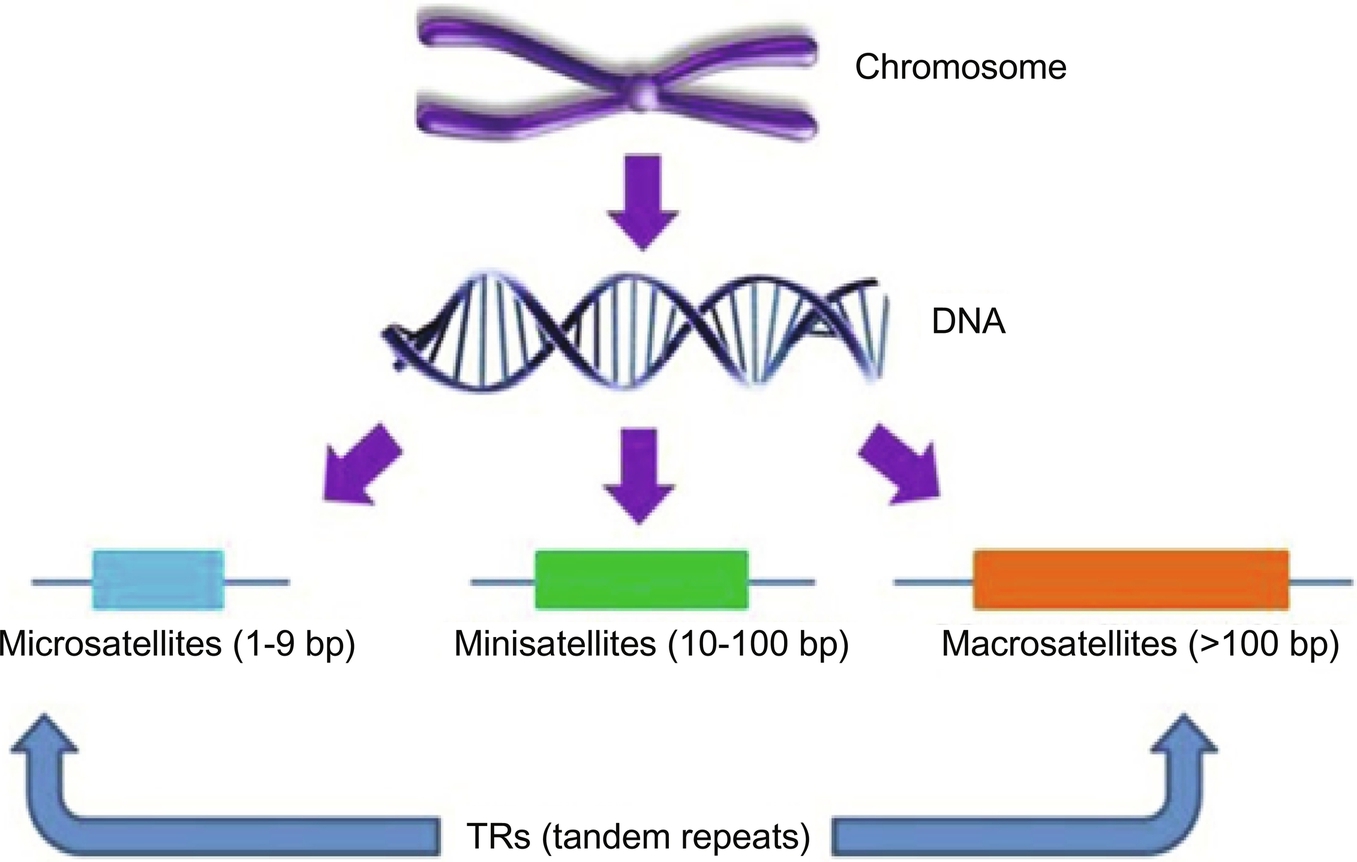
The tandem repeats (TRs) are the adjacent repeated patterns and interspersed repeats are the nonadjacent repeated patterns. Tandem repeats are also classified as satellite, minisatellite, microsatellite TRs, and these are shown in Fig. 2.
The number of copies, location, and pattern of TRs play an important role in the diagnosis of genetic diseases and cancer identification, etc. (Yin, 2017). TRs are also associated with various human diseases like Frederick’s ataxia, some types of cancer, Fragile-X syndrome, Huntington’s disease, and more than 40 other neuromuscular, neurodegenerative, and neurological diseases (Usdin, 2008). TRs are also applied to know about the human evolutionary history (Butler, 2003), genetic marker in microbial forensics, human identity, and for the investigation of the infectious disease irruptions (Cummings and Relman, 2002). To identify TRs in DNA sequences, periodicity present in DNA sequences has been utilized. Following are the key contributions of this chapter:
- (i) Integer period discrete Fourier transform (IPDFT) has been applied to visualize the tandem repeats in DNA sequence.
- (ii) Appropriate threshold selection.
- (iii) The number of copies of tandem repeats has been enhanced.
2: Related work
Methods for the identification of the TRs have been classified into two categories such as string matching methods and signal processing methods. Lim et al. (2012) reviewed the string matching methods to identify the TRs. Currently, conversion of DNA characters to numerical values using numerical mapping schemes has provided the signal processing techniques a direction to analyze the genomic data (Sharma et al., 2011). Hence, the focus in this work is on the signal processing-based methods reported for the detection of TRs (Sharma et al., 2017). These methods are modified Fourier product spectrum (MFPS) (Tran et al., 2004), short time periodicity transform (STPT) (Buchner and Janjarasjitt, 2003), spectral repeat finder (SRF) (Sharma et al., 2004), Fourier product spectrum-based spectral methods for localization of tandem repeats (Pop, 2007; Pop and Lupu, 2008), exactly periodic subspace decomposition (EPSD) (Jiang and Yan, 2011), optimized moving window spectral analysis (OMWSA) (Du et al., 2007), parametric spectral estimation (PSE) (Zhou et al., 2009), S-transform (Zribi et al., 2019), and adaptive S-transform (AST) (Sharma et al., 2014). Tran et al. proposed an MFPS for the identification of the approximate tandem repeats (Tran et al., 2004). Buchner et.al proposed a STPT to properly localize the periodicity of tandem repeat and the location of these periodicities using a periodogram. Periodicity transform is the basis of this method and multiple periodicities is the drawback of this method (Buchner and Janjarasjitt, 2003). As it is well known that Fourier analysis is a powerful tool to extract unknown periodicities in the DNA sequences in the proximity of deletion, substitution and insertion, a computer program-based method known as spectral repeat finder (SRF) has been developed by Sharma et al. the basis of which is Fourier transformation. In this method, firstly the pattern length of repeats which is obtained from the power spectrum of a DNA sequence is computed, and consequently, the identification of the location of repeats pattern has been performed using a sliding window approach (Sharma et al., 2004). Pop et al. have proposed an algorithm to detect the TRs in spectrogram using windowed discrete Fourier transform, the basis of which is the Fourier product spectrum (Pop, 2007; Pop and Lupu, 2008). As per the study from literature, it is observed that both the FT- and STPT-based methods have the drawback of multiple periodicities. Gupta et al. proposed EPSD method for the detection of TRs to find the solution to the problem of multiple periodicities (Jiang and Yan, 2011). Liping et al. suggested an OMWSA to detect the DNA repeats, this method being perfect and more robust than Fourier transform-based spectral analysis in the proximity of deletion, substitution, and insertion; however, its drawback is that location of repeats is identified by inspecting the spectrogram (Du et al., 2007). Zhou et al. proposed the parametric spectral estimation (PSE) technique to detect the location of TRs and its pattern automatically (Zhou et al., 2009). However, PSE has limitations of order selection and selection of the appropriate window length. The S-transform-based method (Zribi et al., 2019), which employs p-nuc coding scheme, has been proposed to overcome the limitations of PSE. An adaptive S-transform-based algorithm (Sharma et al., 2014) for the TRs detection has been proposed by Sharma et al. In this chapter, an integer period discrete Fourier transform (Epps, 2009)-based algorithm for the TRs detection has been proposed. The remaining parts of this chapter have been described in the later sections.
3: Algorithm for detection of TRs
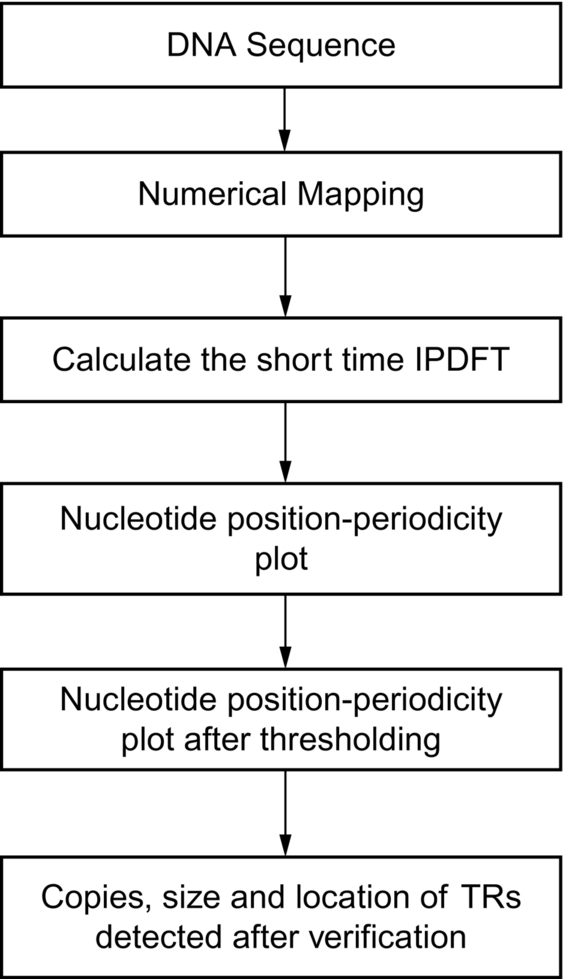
In this section, an algorithm based on the Integer period discrete Fourier transform (IPDFT) has been proposed to detect the tandem repeats (TRs) in DNA sequences and it has been depicted in Fig. 3. An example sequence with accession no. X64775 (NCBI, n.d) has been selected to explain the steps used in the algorithm for the TRs detection.
3.1: DNA sequences
DNA sequences contain the nucleotides or characters adenine (A), thymine (T), guanine (G) and cytosine (C), and these characters are considered inputs.
3.2: Numerical mapping
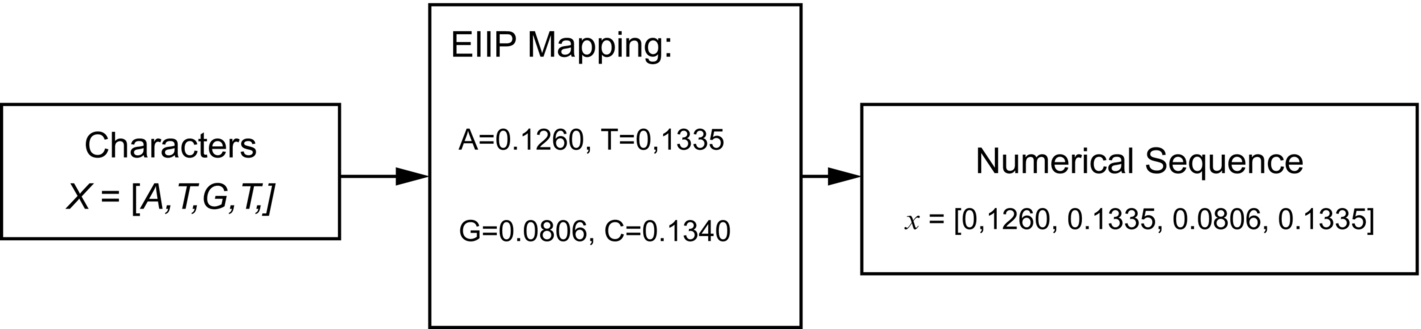
Characters of the DNA sequences received from the previous step have been converted into numerical sequences using the electron-ion-interaction pseudo-potential (EIIP) mapping scheme. The EIIP mapping is preferred over other mapping schemes because it has less computational complexity (Sharma et al., 2011). The character to numerical conversion with an example has been shown in Fig. 4.
3.3: Short time integer period discrete Fourier transform
The IPDFT of a signal x(n) is defined (Epps, 2009) using the following equation.
where P is the maximum period. IPDFT is linearly related to periodicity “p,” whereas the discrete Fourier transform (DFT) is linear with respect to the frequency.
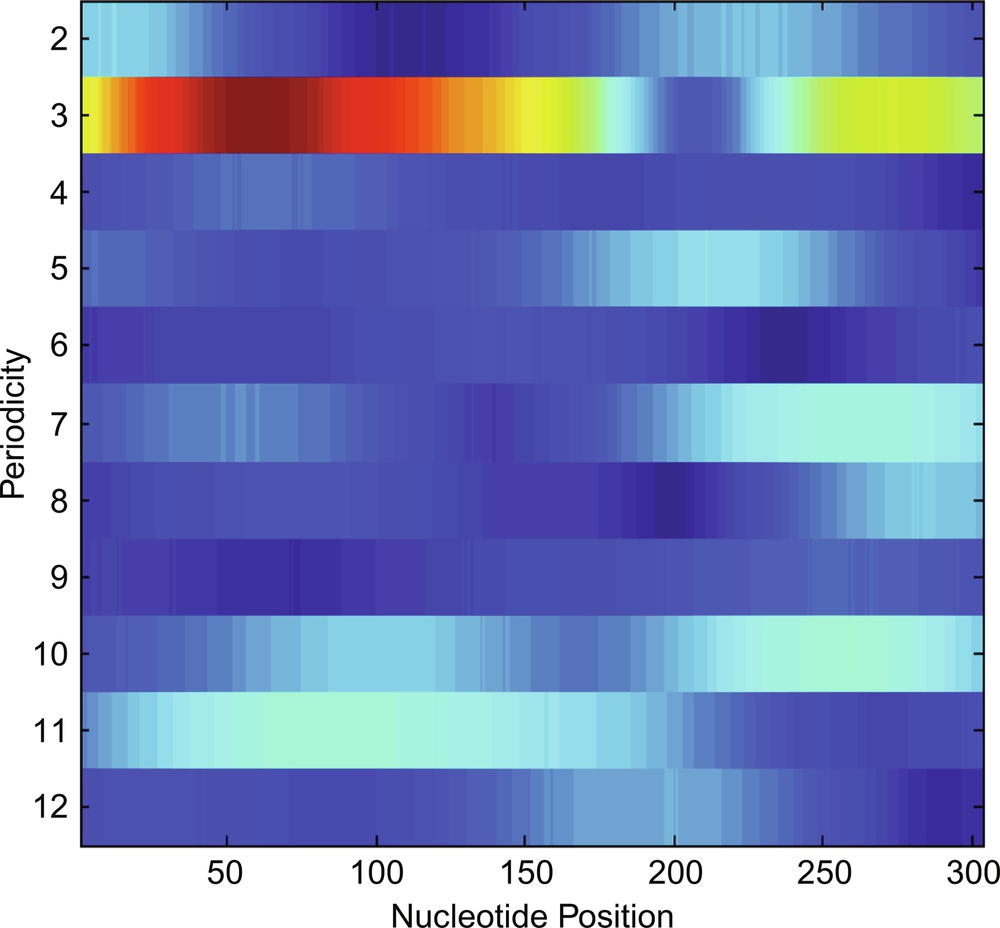
To localize the TRs present in the DNA sequences, the short time IPDFT (STIPDFT) has been calculated using the following equation.
where w(n) is a hamming window, which is centered at nucleotides position m = 0 initially, and further it is shifted by one nucleotide up to the end of the sequences. The 20*p window length has been selected for the experiment. Finally, nucleotides position versus periodicity plot has been plotted in Fig. 5.
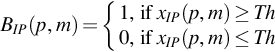
3.4: Thresholding
Threshold has been calculated to identify the location of TRs of a particular periodicity and it is calculated using the following equation.
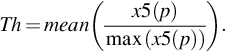
where, x5 is the value of the sum of power spectrum along with position axis and it is given by –
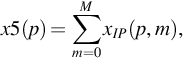
Using Eq. (5), we have plotted the nucleotide position vs periodicity plot obtained postthresholding and it is shown in Fig. 6.
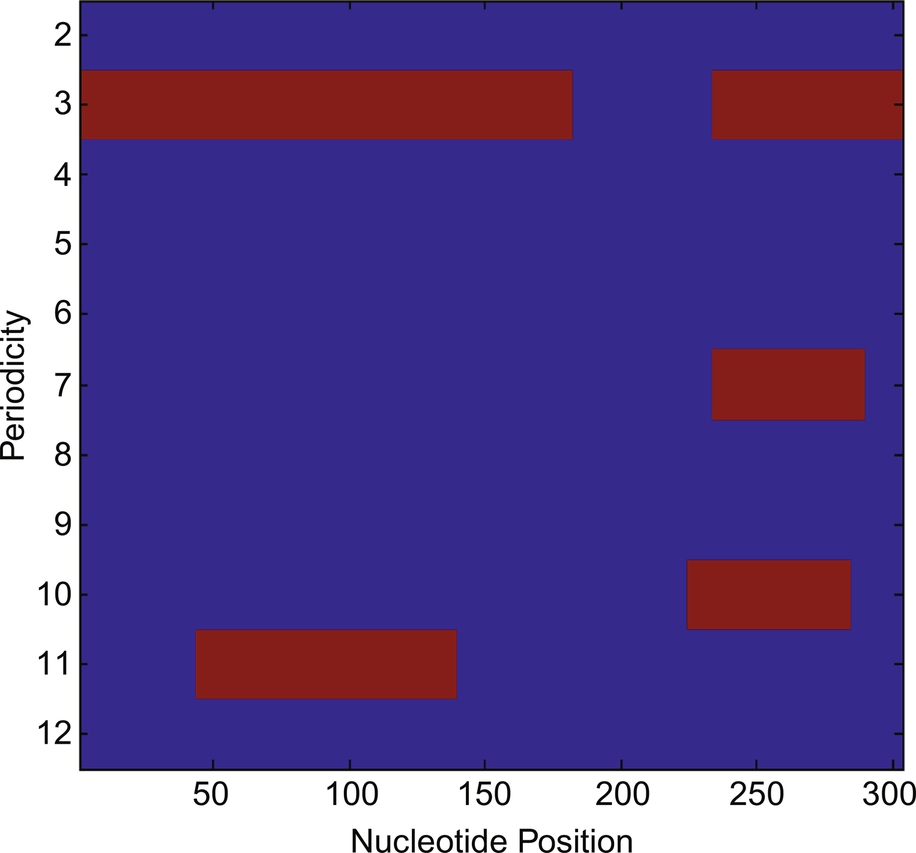
After thresholding, the periodicity 3, 7, 10, and 11 have been detected as candidate TRs along with their nucleotide positions 1–182 and 234–303, 234–289, 225–284, and 44–139, respectively.
3.5: Verification of the detected candidate TRs
The method proposed by Boeva et al. (2006) has been used to verify the candidate TRs detected after thresholding. Candidate TRs are the segments highlighted in Fig. 3, and these are located at the nucleotide positions 1–182 and 234–303, 234–289, 225–284, and 44–139. These candidate TRs after verification have been tabulated in Table 1.
Table 1
| Sr. No. | Periodicity | Detected candidate TRs after thresholding | Verification of detected candidate TRs | |||
|---|---|---|---|---|---|---|
| Nucleotide position | Patterns | Location | Patterns | No. of copies | ||
| 1 | 3 | 1–182 | ATGGAGAGCGACTGCCAGTTCTTGGTGG CGCCGCCGCAGCCGCACATGTACT ACGACACGGCGGCGG CGGCGGTGGACGAGGCGCAGTTCTT GCGGCAGATGGTGGC CGCGGCGGATCACCACGC GGCCGCCGCTGGGAG AGGAGGCGGCGACGGCGA CGGCGGCGGCGGCG GCGGCGGCG | 19–24 | GTT CTT | 02 |
| 25–30 | GGT GGC | 02 | ||||
31–45 | GCC GCC GCA GCC GCA | 05 | ||||
50–58 | TAC TAC GAC | 03 | ||||
60–77 | CGG CGG CGG CGG CGG TGG | 06 | ||||
78–83 | ACG AGG | 02 | ||||
89–94 | TTC TTG | 02 | ||||
102–107 | TGG TGG | 02 | ||||
108–116 | CCG CGG CGG | 03 | ||||
117–123 | ATC ACC | 02 | ||||
125–136 | GCG GCC GCC GCT | 04 | ||||
142–183 | AGG AGG CGG CGA CGG CGA CGG CGG CGG CGG CGG CGG CGG CG | 14 | ||||
234–303 | AGACGCGTTCCACGCGCG GCGGGCCAAGCTGGA GCCGCGGGAGAAGGCG GACGTGGCGCGGGAG CTCGGG | 250–255 | CGG CGG | 02 | ||
268–273 | CCG CGG | 02 | ||||
274–279 | GAG AAG | 02 | ||||
| 2 | 7 | 234–289 | AGACGCGTTCCACG CGCGGCGGGCCAAGCTG GAGCCGCGGGAGAA GGCGGACGTGG | Rejected | Rejected | Rejected |
| 3 | 10 | 225–284 | GGTCGCTGGAGACGC GTTCCACGCGCGGCGGGC CAAGCTGGAGCCGCGGGA GAAGGCGGA | Rejected | Rejected | Rejected |
4 | 11 | 11–139 | GACTGCCAGTTCTTGGTGG CGCCGCCGCAGCCGCACATGTACTACGACA CGGCGGCGGCGGCGGT GGACGAGGCGCAGTT CTTGCGGCAGATGGTGG CCGCGGCGGATCACC ACGCGGCCGCCGCTGGG | Rejected | Rejected | Rejected |
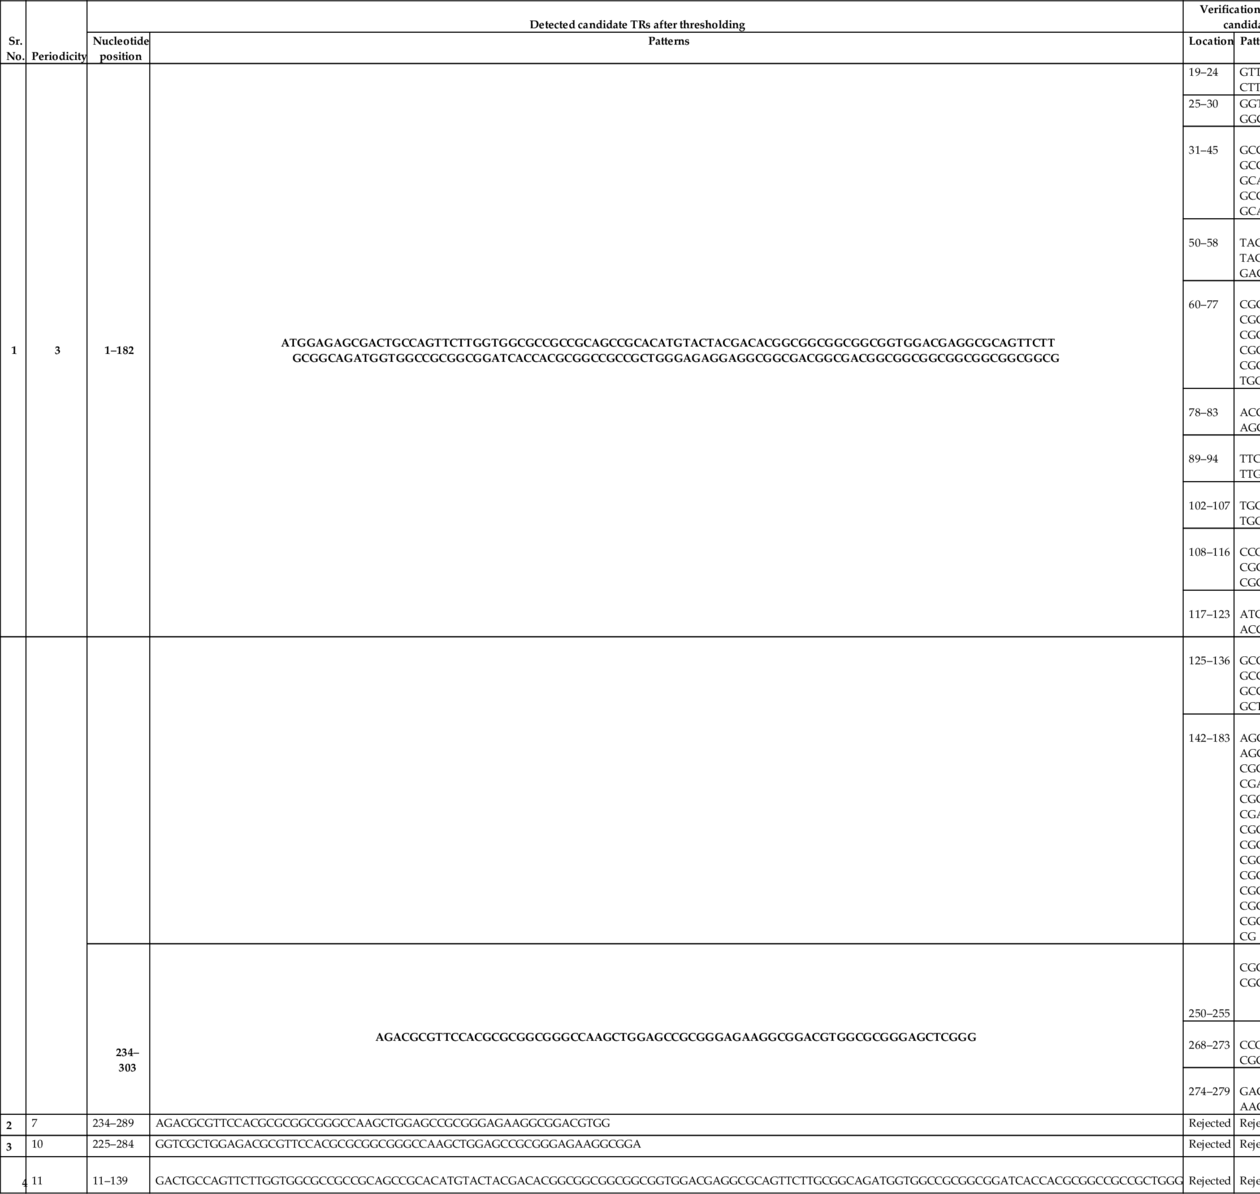
In Table 1, it has been presented that the proposed algorithm has detected true TRs of periodicity 3 bps, and other falsely detected candidate TRs of periodicity 7, 10, and 11 have been removed after verification.
4: Performance analysis of the proposed algorithm
To assess the performance of the proposed algorithm for the TRs detections, DNA sequence having the accession number X64775 (NCBI, n.d) has been used in this study. The proposed algorithm for TRs detection has been implemented in MATLAB. The system used for simulation has 8 GB RAM, 64 bit operating system, and core i5 processor. The performance comparison of the proposed algorithm has been done with the reported methods. The comparison of results has been shown in Table 2.
Table 2
| Periodicity | Method | Nucleotide position after thresholding | Nucleotides positions after verification | Consensus pattern | Copies | Total copies |
|---|---|---|---|---|---|---|
| 3 | Proposed method | 1–182 | 19–24 | GTT CTT | 02 | 53 |
25–30 | GGT GGC | 02 | ||||
31–45 | GCC GCC GCA GCC GCA | 05 | ||||
50–58 | TAC TAC GAC | 03 | ||||
60–77 | CGG CGG CGG CGG CGG TGG | 06 | ||||
78–83 | ACG AGG | 02 | ||||
89–94 | TTC TTG | 02 | ||||
102–107 | TGG TGG | 02 | ||||
108–116 | CCG CGG CGG | 03 | ||||
117–123 | ATC ACC | 02 | ||||
| 125–136 | GCG GCC GCC GCT | 04 | ||||
142–183 | AGG AGG CGG CGA CGG CGA CGG CGG CGG CGG CGG CGG CGG CGG | 14 | ||||
250–255 | CGG CGG | 02 | ||||
268–273 | CCG CGG | 02 | ||||
274–279 | GAG AAG | 02 | ||||
| AST (Sharma et al., 2014) | 19–44 | 20–25 | TTC TTG | 02 | 48 | |
| 25–42 | GCC | 06 | ||||
| 61–86 | 61–79 | GGC | 07 | |||
89–104 | 89–94 | TTC(TTG) | 02 | |||
94–99 | GCG GCA | 02 | ||||
108–122 | 108–116 | CGG | 03 | |||
| 117–122 | ATC ACC | 02 | ||||
| 125–135 | 125–135 | CCG | 03 | |||
141–149 | 141–149 | GAG | 03 | |||
160–186 | 160–186 | CGG | 09 | |||
194–207 | 194–199 | AGG AAG | 02 | |||
199–204 | GCG | 02 | ||||
211–223 | 211–219 | GGA | 03 | |||
274–283 | 274–279 | GAG AAG | 02 | |||
| blank cell | EMWD (Pop and Lupu, 2008) | 57–72 | 57–72 | CGG | 5.5 | 21 |
140–187 | 140–187 | GGC | 15.5 | |||
| blank cell | Parametric spectral estimation (Du et al., 2007) | 45–90 | 49–57 | TAC | 03 | 24.7 |
59–76 | CGG | 06 | ||||
140–200 | 141–188 | GGC | 15.7 |
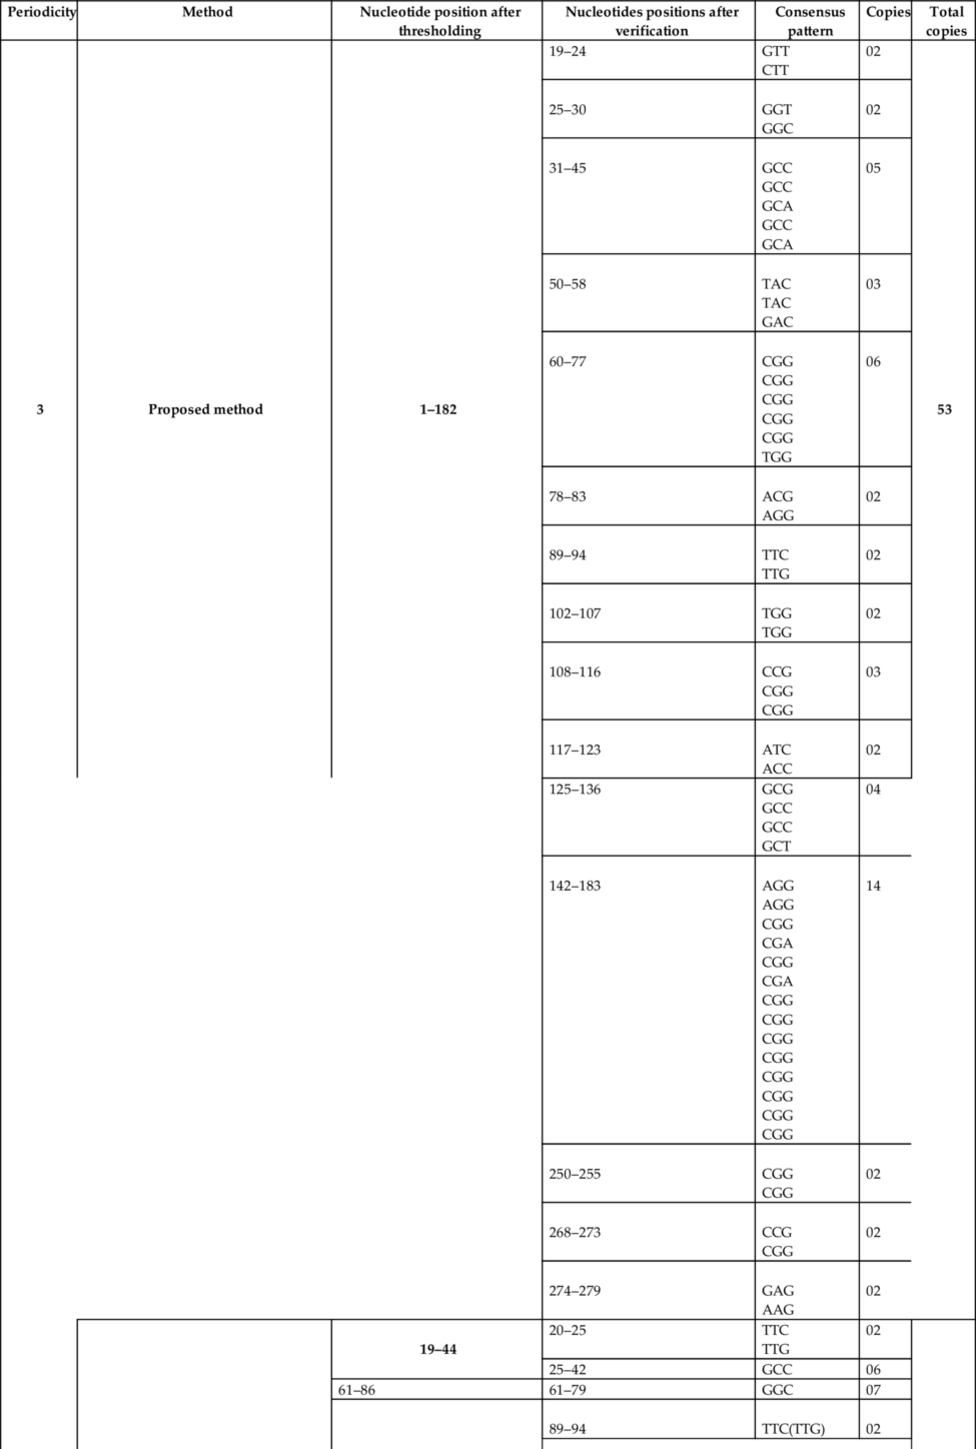
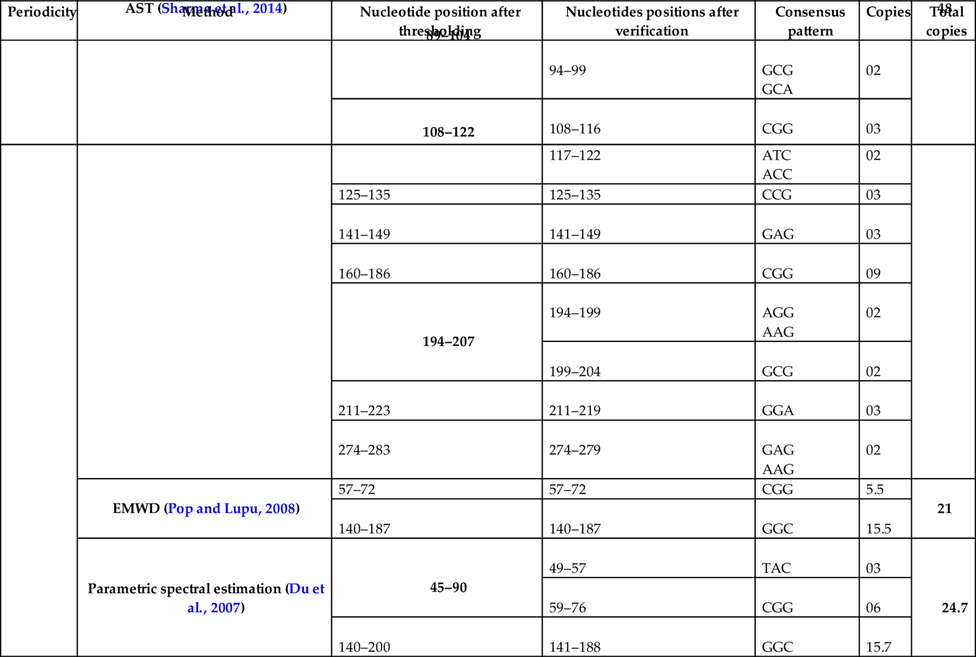
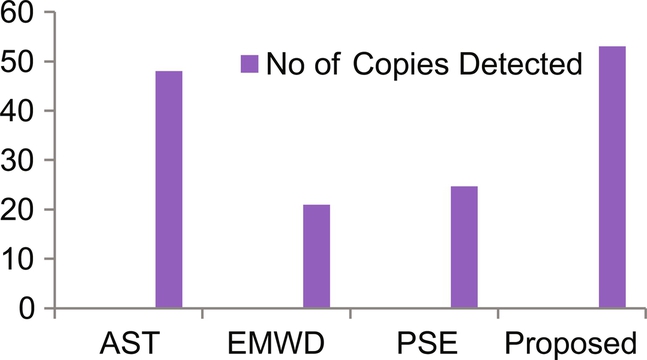
From Table 2 and Fig. 7, it has been found that the proposed method has detected more number of copies as compared to other reported methods.
5: Conclusion
The proposed approach presented in this chapter has been applied successfully to identify TRs detection in the DNA sequences. It has been concluded that the performance of proposed method is better as compared to AST, EMWD, PSE, in terms of number of copies. Also, it has been concluded that fixed window length is the limitation of the proposed method and it may be overcome in future work. This chapter will also attract and motivate scientists and researchers of computer science, bioinformatics, medical sciences, and Big Data to do research in the area of genomics signal processing.