
Chapter 2: Geolocation-aware IoT and cloud-fog-based solutions for healthcare
Jaydeep Das Advanced Technology Development Center, Indian Institute of Technology Kharagpur, West Bengal, India
Abstract
With increasing health awareness, a large volume of healthcare data is being generated through different types of healthcare devices using new technologies. IoT devices, such as smart watches, are used to collect health data from the patient and send the data to the cloud-fog environment for the diagnosis of diseases. In emergency cases, analysis of some health data can be done in the fog devices; otherwise, the health data are forwarded to the cloud servers. After the diagnosis, doctors can prescribe medicines or take immediate actions like hospitalization for patients. Our proposed model is a geolocation-aware healthcare system with IoT and fog-cloud-based diagnosis. A medical team can be sent to the patient’s location depending upon the severity of the health condition. Also, the nearest hospital or medical facility available to the patient can be identified. This will help the patient’s family or caregivers to take action immediately in both urban and rural areas. An end-to-end infrastructure has been modeled for this healthcare system using geolocation-enabled IoT, fog, and cloud computing technology. This system has achieved 25%–27% less delay and 27%–29% less power consumption than the only-cloud environment.
Keywords
Cloud computing; Fog computing; Internet of things; Healthcare; Geolocation; Data analytics
1: Introduction
In the modern age, health has become a priority along with food, clothes, shelter, and other necessities. Health awareness is increasing day by day. Health monitoring, sample collection, diagnosis, and disease detection are regular practices in the healthcare field. Advanced internet technology such as the IoT and sensor networks are used to monitor and collect patient health data. Several smartphone applications, including Apple HealthKit, Google Fit, and Samsung Health, collect data from sensor-based devices such as Apple Watch, SmartBand, etc. They collect health data like blood pressure, pulse, body temperature, and oxygen saturation levels in the blood, and send this data via Bluetooth. Smartphones are power-hungry because several build-in applications are running with other applications. They collect data and send it to nearby servers. Initially, the collected data are analyzed in the distant cloud server. In this case, the communication delay represents a major challenge (Doukas and Maglogiannis, 2012; Hassanalieragh et al., 2015) for healthcare and similar real-time applications.
However, fog computing can overcome these communication delays, as the fog nodes reside near the health applications and IoT devices (Gia et al., 2015; Negash et al., 2018). In the healthcare system, accurate and real-time results are required. Fog computing challenges related to healthcare applications are described in Mutlag et al. (2019). Along with faster results, the accuracy of the result is also a major concern. A deep learning technique was used to classify data and predict results with high accuracy (Faust et al., 2018). However, complex methods of deep learning and neural networks again lead to a time-consuming process. A personalized healthcare framework in an integrated cloud-fog-edge computing environment is proposed in Mukherjee et al. (2021) and Ghosh et al. (2020b). Tuli et al. (2020) proposed a deep learning-based edge resource-enabled computing platform to get accurate results in minimum response time for health-related applications, such as in heart disease monitoring. Location-based services in a cloud-fog integrated environment are described in Ghosh et al. (2020a). Das et al. (2016) elaborates different location-based geospatial query processing in a cloud environment and cloud-fog domain (Das et al., 2020).
In an emergency, patients need to be admitted to a nearby hospital or medical center after the health data have been analyzed by medical personnel. The nearest pharmacy may need to be located to deliver medicine and other medical equipment. Rapid delivery can be crucial for the patient, and the patient’s geolocation is an important aspect in identifying the nearest hospital or healthcare center to the patient’s current location. The nearest hospital or healthcare center or pharmacy can be determined using overlay analysis. The shortest path analysis can then be used to reach the hospital or healthcare center.
In this chapter, a geolocation-based IoT-fog-cloud-based solution for healthcare is proposed. Health data are collected through the IoT devices and analyzed through the fog node cluster and cloud server. Based on the data analysis and review by health personnel, and according to the geolocation of the patient, the patient can be referred to the appropriate medical facility.
The key contributions of this chapter are:
- • Proposing an IoT-fog-cloud-based architecture where healthcare data processing is done along with geolocation data of the patient.
- • Identifying the nearby medical facilities using a geospatial buffer creation mechanism.
- • Obtaining the shortest path to reach medical centers or facilities from the patient with geospatial analysis.
- • Comparing the delay and power consumption of the proposed IoT-fog-cloud-based framework with the IoT-cloud framework.
The rest of this chapter is organized as follows: Section 2 presents the state-of-the-art healthcare systems in the IoT-fog-cloud environment. Section 3 describes the proposed IoT-fog-cloud-based healthcare solution framework. It also elaborates on the geospatial analysis to facilitate medical services to patients depending upon their geolocation. The performance evaluation of the proposed healthcare solution and comparison with the cloud-only healthcare solution are given in Section 4. The last section concludes the chapter with future directions.
2: Related work
Healthcare-related data processing using cloud computing (Hassanalieragh et al., 2015; Mahmud et al., 2016) and fog computing (Mutlag et al., 2019; Rahmani et al., 2018) is a current emerging research field. To obtain more efficient results in terms of energy and latency researchers have used both environments together (Abdelmoneem et al., 2019; Tuli et al., 2020). Existing health monitoring work can be classified into three categories: (1) cloud computing-based health monitoring systems, (2) fog computing-based health monitoring systems, and (3) cloud-fog computing merged health monitoring systems.
2.1: Health monitoring system with cloud computing
Hassanalieragh et al. (2015) focused on clinical examination reports and trying to predict different kinds of diseases. Wearable sensors were used to collect the patient’s health data, such as body temperature, blood pressure, respiratory rate, etc. The collected data were transferred to the remote healthcare center through a concentrator. The cloud was used for long-term data storage, data analysis, and data visualization. A cloud-based data analysis framework was developed in Mahmud et al. (2016). They collected population-wise socioeconomic data and health data, and tried to predict the health shock. A fuzzy-based classifier was used to predict the health-shock level of rural and tribal areas. The cloud was used for data capturing, data storing, indexing, and visualizing purposes. Zhang et al. (2015) described a smart health system in which medical data was integrated between public medical facilities and the patient’s health devices. A large amount of heterogeneous data storage and data analysis has been carried out on the cloud platform. Another cloud-based work was proposed in Gupta et al. (2017). The cloud was used to store users’ health data like heart rate, calories burned, walking speed, and distance traveled. The data were transferred from IoT devices to the cloud through XML. XML ensured that data collection was fast, secure, and reliable. The proposed model triggered an alert message to the medical person if any abnormality was found in the person’s collected data. A machine learning classifier was used in Muhammad et al. (2017) to improve the accuracy of a voice pathology monitoring system. Voice signals were captured through the IoT devices and transmitted to the cloud by watermarking, enabling the secure transmission of the signal. The doctor identified the patient’s data and diagnosed it. The doctor provided feedback after analyzing the patient’s voice.
2.2: Health monitoring system with fog computing
Rahmani et al. (2018) and Negash et al. (2018) elaborated on the methods of IoT-based smart e-healthcare systems in which fog computing and e-health gateways (UT-GATE) were used. This gateway was closer to the sensors and received local health data from the patient. They claimed the e-health systems show better patient mobility, scalability, interoperability, reliability, and energy efficiency. The nRF protocol was used in an IoT-based health monitoring system (Gia et al., 2017), for greater energy efficiency of the sensor nodes. These sensor nodes collected ECG, respiration rate, and body temperature data from patients, and forwarded them to the gateway using wireless technology. Real-time alerts were provided after automated decisions were made by the monitoring system. Gia et al. (2015) presented a fog-based IoT-enabled health monitoring system. ECG signal feature extraction was performed at the edge devices as a case study. For real-time notification, they extracted heart rate, P and T waves, and other features from the ECG signals. They performed all these within an appropriate bandwidth utilization and service delivery.
2.3: Health monitoring system with cloud-fog computing
Fog computing refers to an intermediate layer between the IoT devices and the cloud server (Chakraborty et al., 2016; Abdelmoneem et al., 2019). IoT devices collect health data from patients, process some data within the fog devices for emergency purposes, and perform quick responses with alarm triggering. Gu et al. (2019) and Ahmad et al. (2016) used a cloud-fog environment for minimizing data leakage. They worked on the privacy of health data, reducing the transfer of data from IoT devices to the distant cloud server. Support for patients with diabetes by analyzing glucose level data with energy efficiency was carried out in Devarajan et al. (2019). For greater accuracy, they used the J48graft classifier. A telehealth application was proposed in Dubey et al. (2015). The fog device analyzes the data series received from the IoT devices, trying to fit a specific pattern. If new patterns are received, they are forwarded to the cloud for further action. Diagnosis of heart disease using deep learning methods in the IoT-fog computing environment was carried out in Tuli et al. (2020). They showed that the proposed method was delay-aware and energy-efficient. A summary of the related works discussed here is presented in Table 1.
Table 1
| Existing work | Features | ||||
|---|---|---|---|---|---|
| Cloud used | Fog used | Geolocation analysis | Power calculated | Delay calculated | |
| Muhammad et al. (2017), Hassanalieragh et al. (2015), Mahmud et al. (2016), Zhang et al. (2015), Gupta et al. (2017) | ✓ | X | X | X | X |
| Mukherjee and De (2014) | ✓ | X | X | ✓ | X |
| Rahmani et al. (2018), Negash et al. (2018), Mutlag et al. (2019), Gia et al. (2015) | X | ✓ | X | X | X |
| Gia et al. (2017) | X | ✓ | X | ✓ | X |
| Gu et al. (2019), Devarajan et al. (2019), Ahmad et al. (2016), Dubey et al. (2015), Muhammed et al. (2018) | ✓ | ✓ | X | X | X |
| Chakraborty et al. (2016), Abdelmoneem et al. (2019) | ✓ | ✓ | X | X | ✓ |
| Tuli et al. (2020) | ✓ | ✓ | X | ✓ | ✓ |
| Proposed work | ✓ | ✓ | ✓ | ✓ | ✓ |

From this literature survey, it can be observed that geolocation has not been dealt with in any of the cases. Geolocation has a vital role in the healthcare system. In emergency cases, the patient’s transfer to a nearby hospital or healthcare center can be urgently needed.
3: Proposed framework
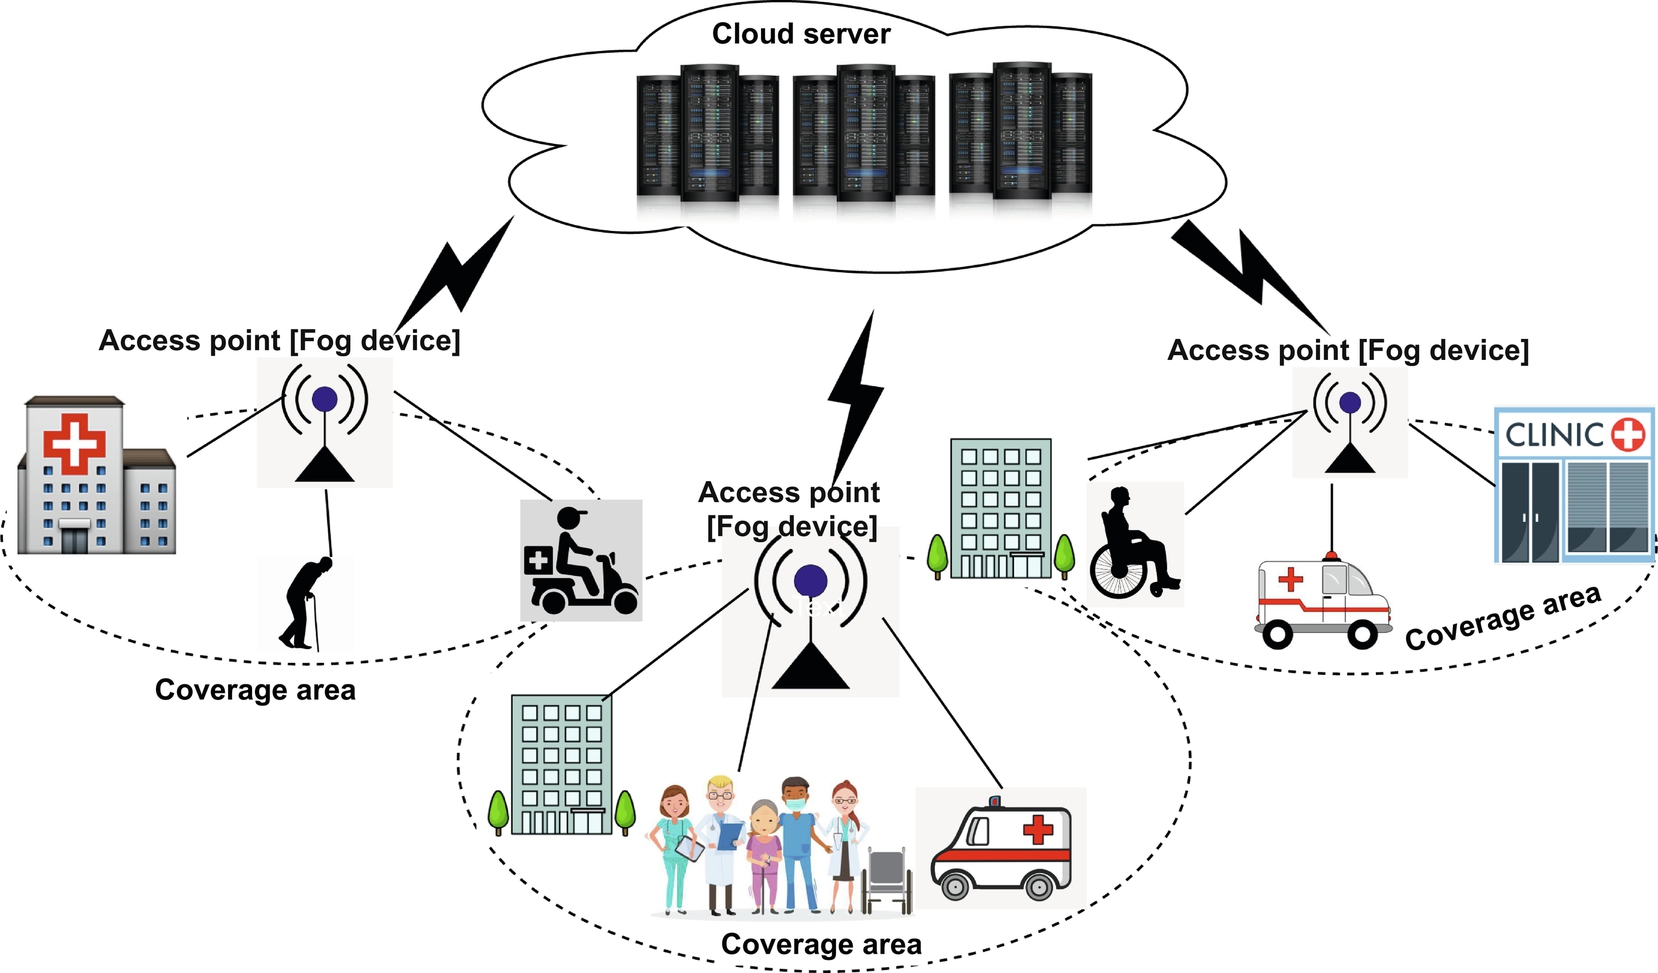
In this section, Fig. 1 elaborates the hierarchical structure of cloud servers, fog devices, and IoT devices for health data collection, communication, health data analysis, and recommendations from medical professionals. The workflow of the proposed model is depicted in Fig. 2. Health data are collected through IoT and sensor devices and sent to the nearest fog devices. If the patient is in a moving vehicle, then roadside units can serve as fog devices, as well as the router and switches. Fog devices perform the primary health data analysis as it has low computation power needs. Thus n number of fog devices can be engaged for m parameters of the health data analysis where n ≤ m. If these aggregated parametric data are within the normal range, then the parameter values are considered to be normal. If the parametric data are not within the normal range, then the results are forwarded to the cloud server and medical personnel are consulted. According to the severity of the reports, the medical personnel will contact the nearest medical center or hospital for further treatment.
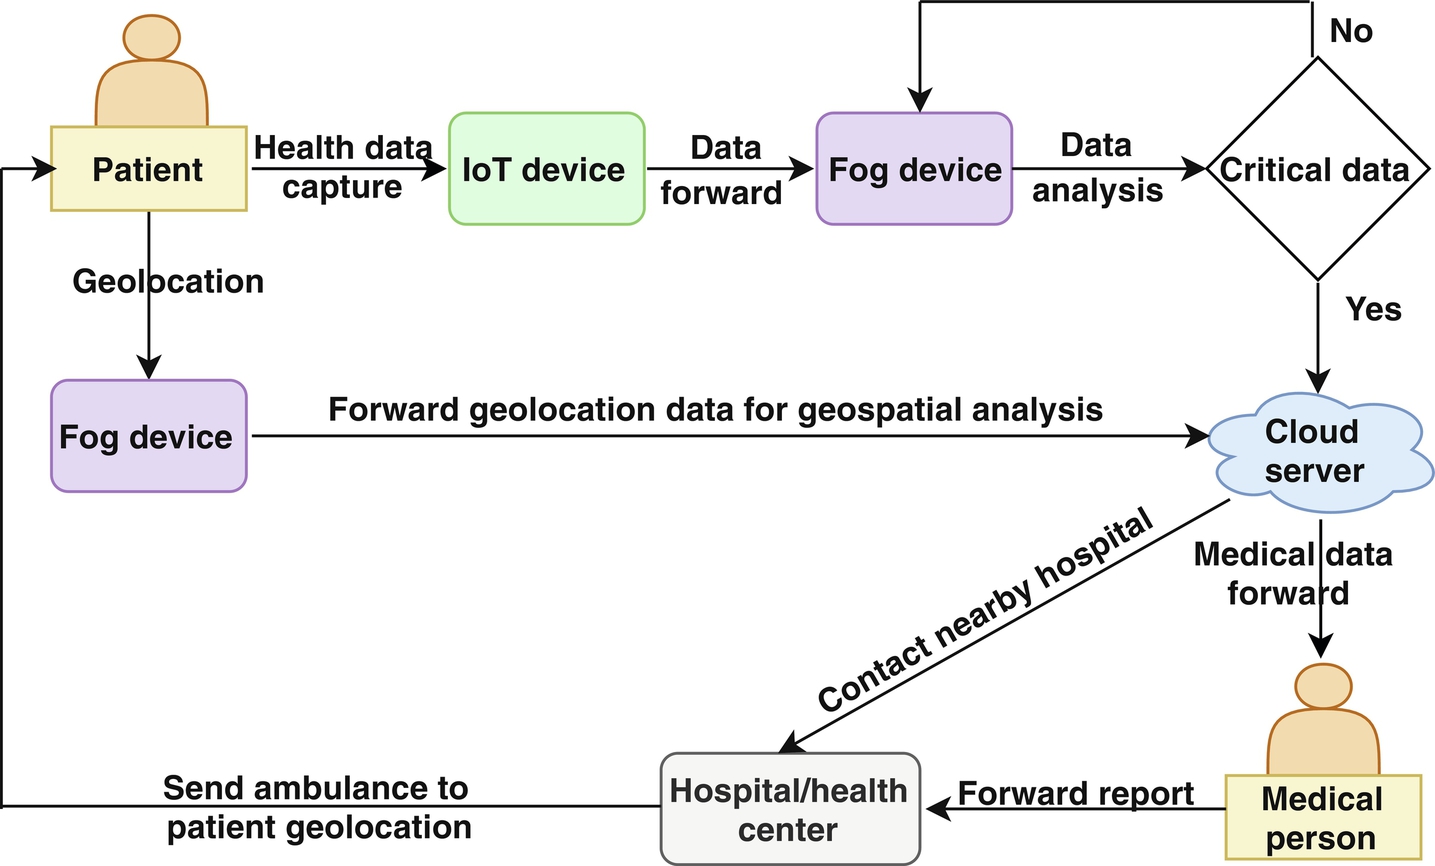
Moreover, the geospatial data of the region of interest are analyzed and the geolocation of the patients, hospitals, other healthcare centers, pharmacies, diagnosis centers, etc., are pointed out. It determines the nearby healthcare facilities and obtains the shortest path to reach them. The geolocation-based analysis is done in the cloud server, and all location information is sent to the medical center. After getting the doctor’s consult, an ambulance can be sent to the patient’s geolocation to bring the patient to the healthcare center for further treatment. If this is not possible, then care can be provided to the patient from the healthcare center by sending medication or a medical team.
3.1: Health data analysis
Health data are collected through smart bands worn by the patients. Health data include heart rate, blood pressure, body temperature, and other parameters generated every n minutes. CSV files are generated in different fog nodes for different health parameters. These files are related to individual health data, and each health parameter has an upper bound and lower bound value or a range of values. If it is identified that the collected health data parameters are abnormal or out of the normal range, then an alert will be triggered and the collected health data will be sent to the cloud for further analysis. In the cloud, all historical health data of the patient are present. A medical practitioner or doctor can analyze this collected health data. If anything abnormal or any emergency is identified, then the nearest medical center or hospital is then contacted and a medical team or an ambulance is sent for the patient by the shortest path.
3.2: Geospatial analysis for medical facility
Geolocation is an important parameter to obtain the current position of the patient, pharmacies, hospitals, diagnosis centers, etc. It has two parts. One is latitude (i.e., Lat) and another is longitude (i.e., Lon). The Lat/Lon identifies any geographical location on the earth. However, a patient can move from one location to another location by ambulance, car, or other vehicle. If the patient is stationary, that may be at their home, hospital, or any other place for a long time duration. Concern arises if the patient is not in the hospital or a healthcare center, and needs to be moved to a nearby hospital or healthcare center if the condition is critical. For such an emergency, the following two geospatial analyses must be processed:
- • Find the nearest hospital or healthcare center.
- • Determine the shortest path to reach the nearest hospital or healthcare center.
3.2.1: Overlay analysis to obtain nearest medical facilities
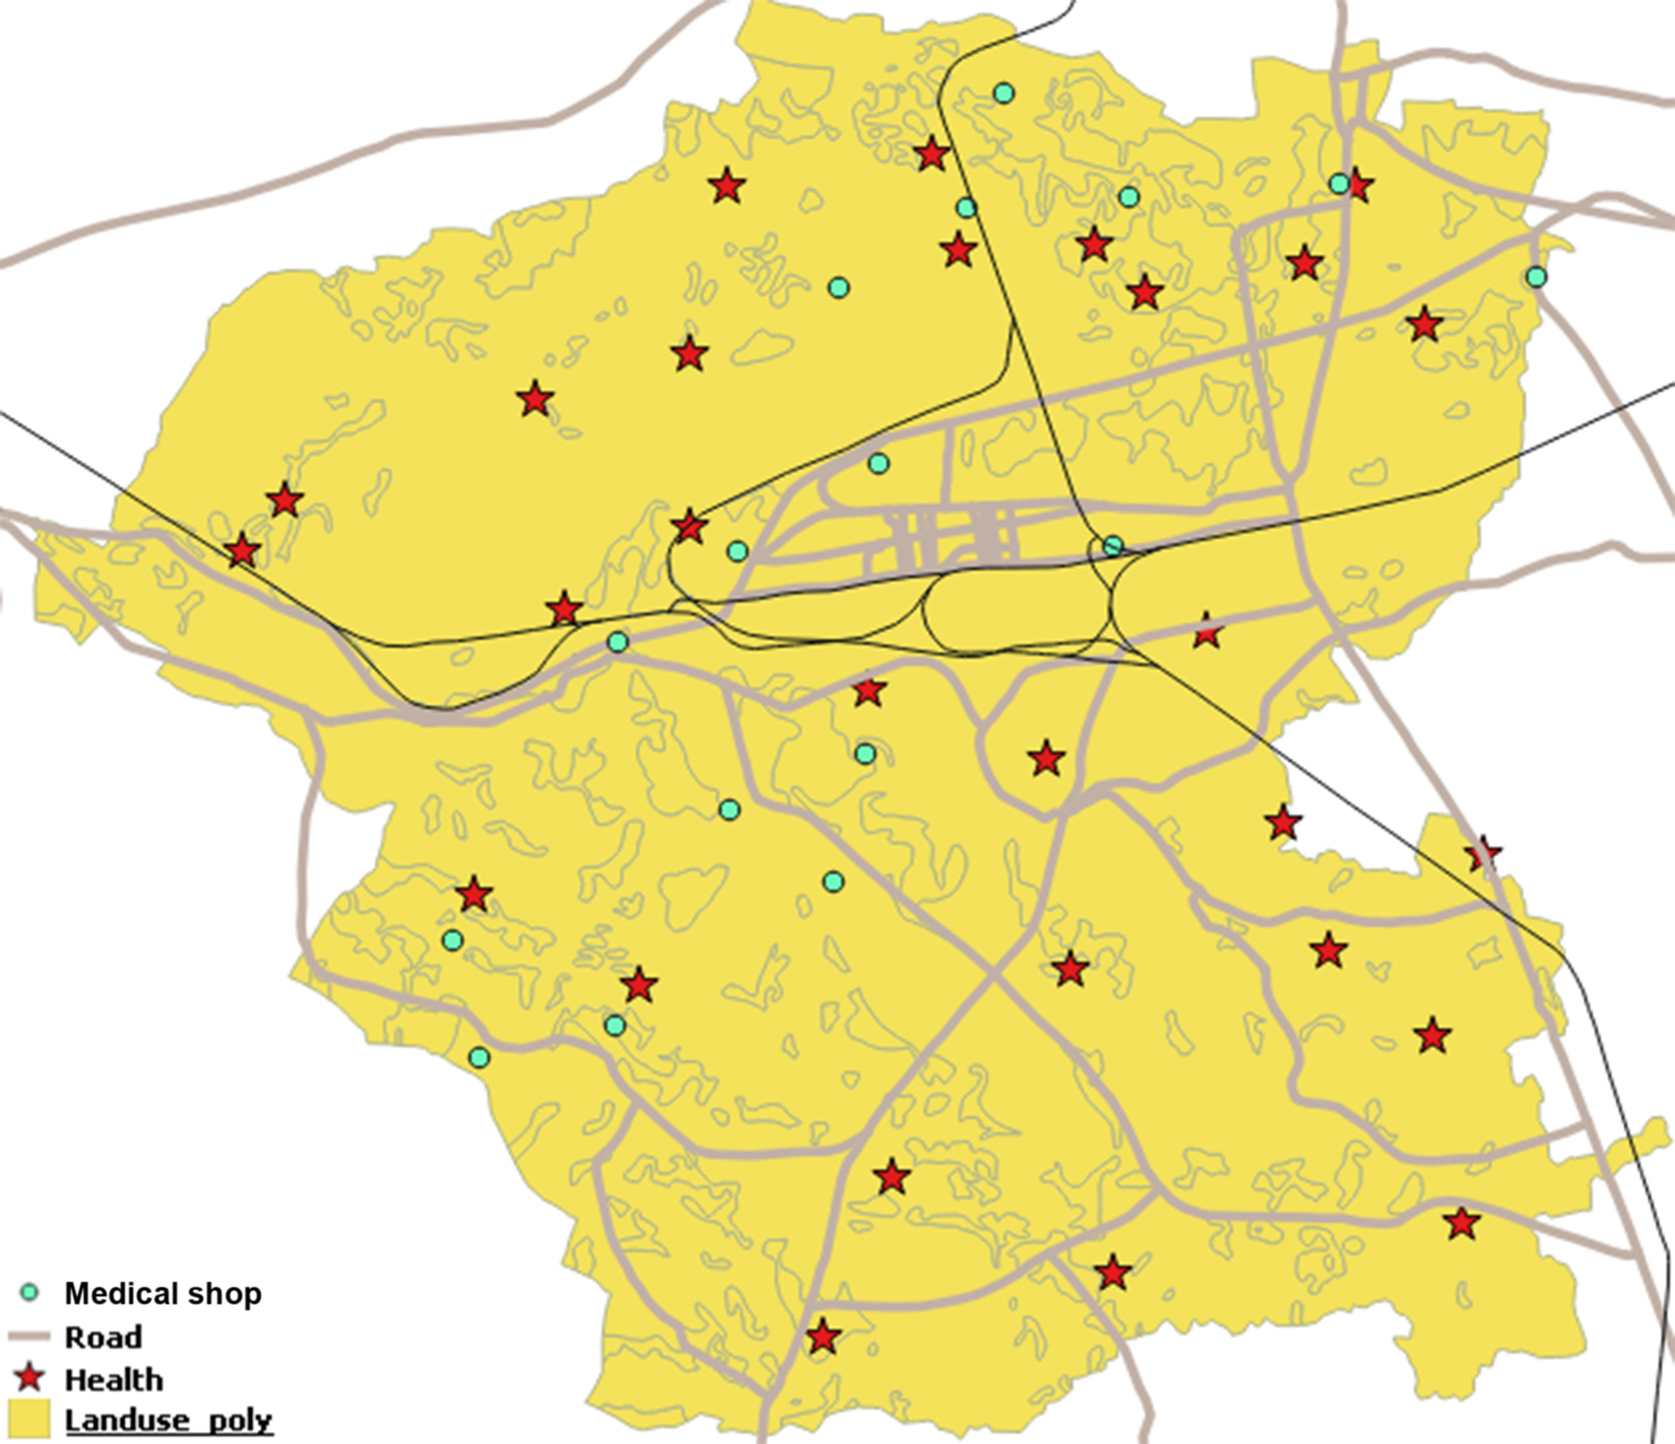
In GIS, there are many layers present in the cartography of any area map. Here, Fig. 3 considers five layers, that is, land use land cover (LULC), health, road, rail, and medical shops of area X. The LULC layer describes the overall land structure of area X. The health layer includes hospitals, medical centers, public health centers (PHCs), block-level public health centers (BPHCs), which are pointed out as a red-colored star. The road layer contains high roads and local roads, which are pointed out as gray-colored lines. Rail is the rail track going through the area X. Black lines indicate these tracks. Medical shops are indicated by green dots.
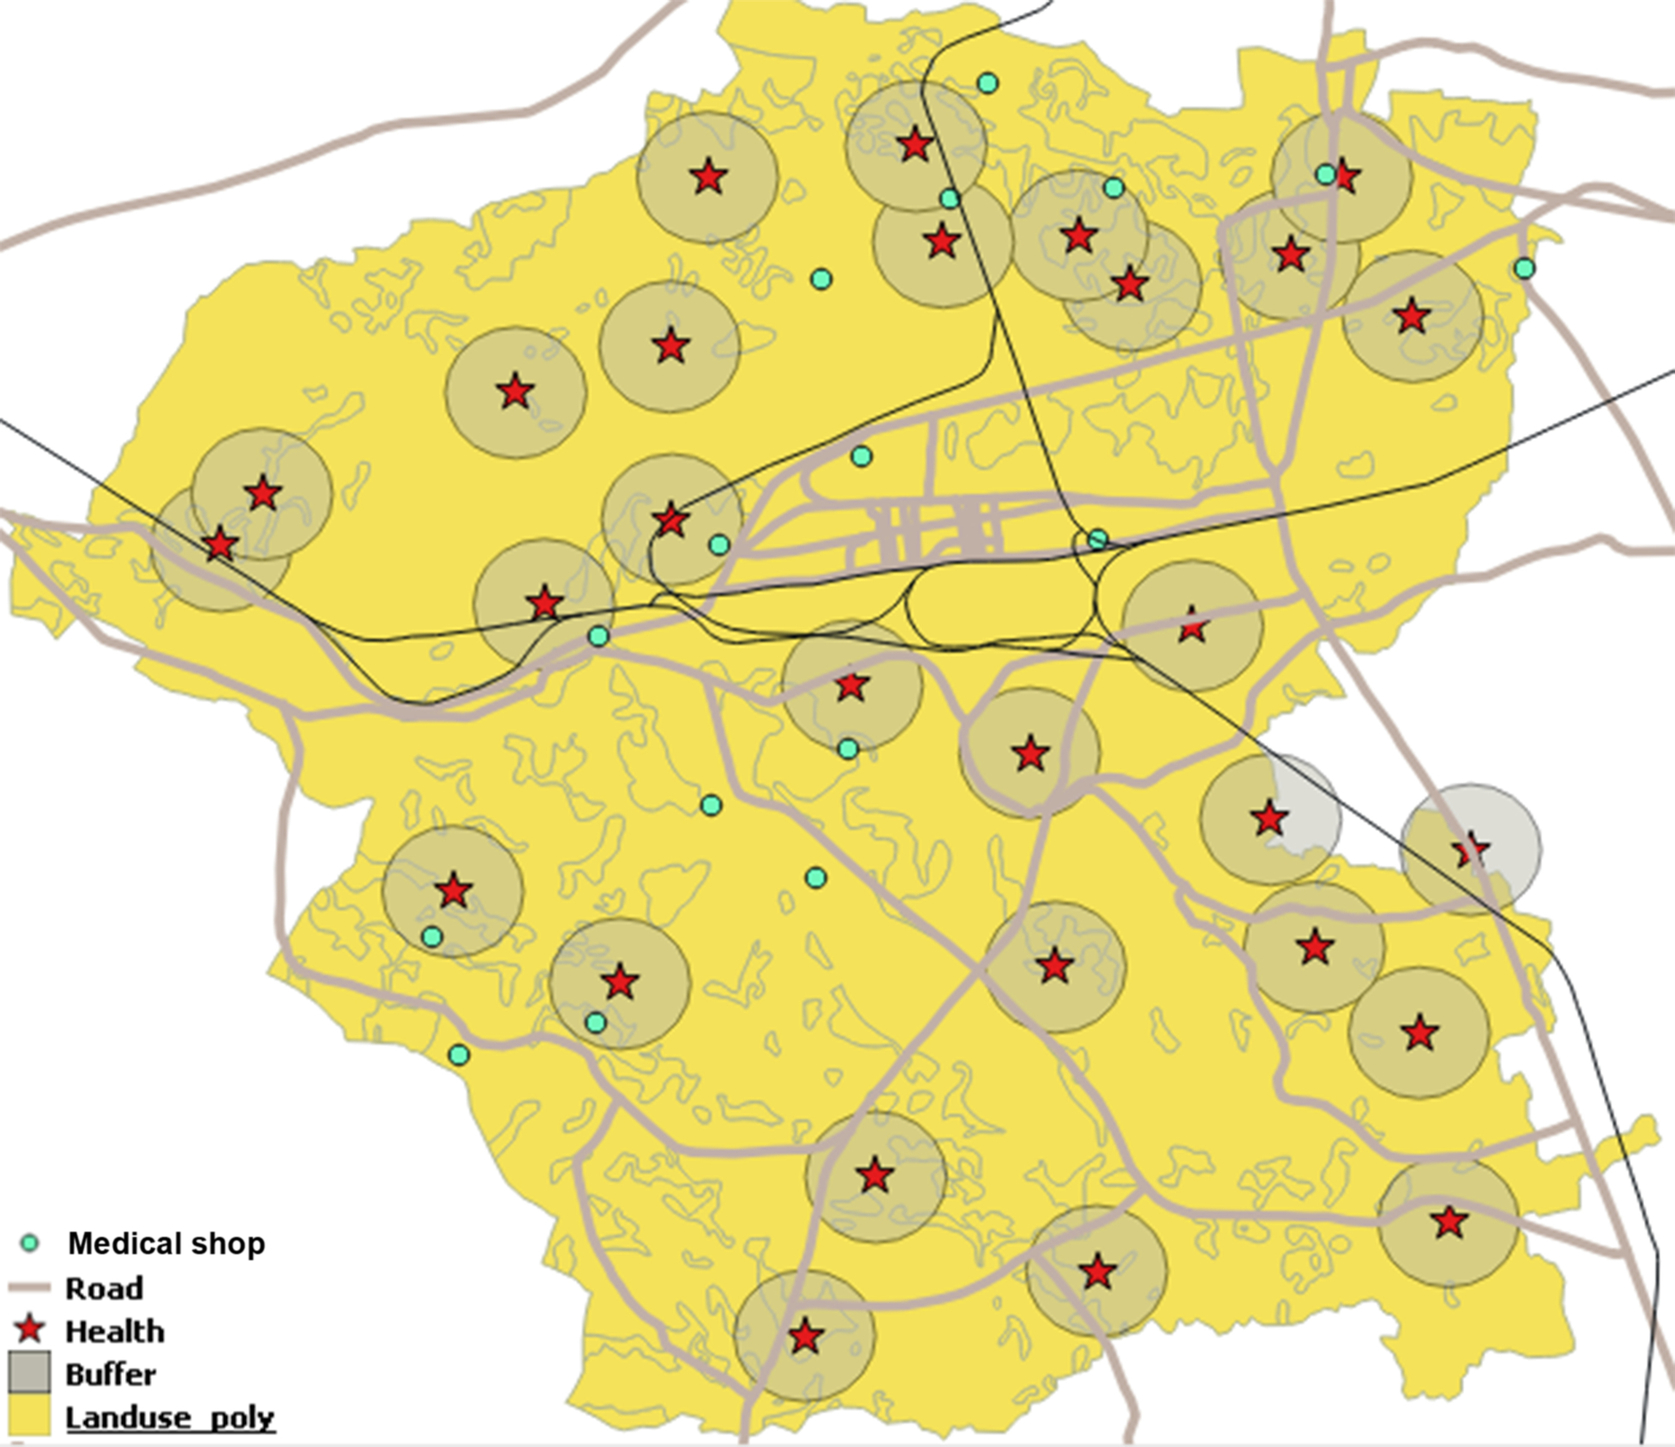
A buffer of 1 km around the health points (see Fig. 4) has been created. From Fig. 4, it is easily understood, within 1 km, how much area is covered by each medical center. Also, this figure identifies the medical shops within 1 km of the medical centers. Likewise, this can create a buffer around the patient’s current geolocation of x kilometer to identify the nearest medical centers and medical shops. The OGC compliant web processing service helps to create a buffer on the fly over the spatial dataset. In that case, the BufferFeatureCollection service is required to create the buffer over the geospatial dataset.
3.2.2: Shortest path to reach nearest medical centers
Network analysis in GIS (Cadieux et al., 2020) does the shortest path determination. Here, the road is considered as a network. If the source location is not on the path, then it checks the nearest point that is on the path. From that point, it calculates the path to the nearest point of the destination that is on the road network. Dijkstra’s algorithm is used to determine the shortest path between two points (i.e., the patient’s current location and nearest healthcare center). Also, it determines the distance between the two points. Our shortest path calculation is portrayed in Fig. 5. Two points (source and destination) of area X are represented with a GPS logo, and the red line shows the shortest path.

3.3: Delay and power consumption calculation
Here, delays have been measured (Das et al., 2019, 2020) in the overall process. Total delay is the summation of communication ![]() , propagation
, propagation ![]() , data processing
, data processing ![]() , and queueing
, and queueing ![]() delay:
delay:
where ![]() is failure rate, d is data amount to transmit, and
is failure rate, d is data amount to transmit, and ![]() is data transmission rate.
is data transmission rate.
Propagation delay ![]() is the time taken for the data to be transmitted from sender node to receiver node:
is the time taken for the data to be transmitted from sender node to receiver node:
where dsr is distance between data sender node and data receiver node and Sprop is propagation speed.
Processing delay ![]() is time taken to process the data in a node:
is time taken to process the data in a node:
where ![]() is amount of data processed and
is amount of data processed and ![]() is speed of data processing.
is speed of data processing.
In our case, communications occur between the IoT device and the fog device, fog device and cloud server (if the health data are critical).
So, here the proposed system communication delay is ![]() , where
, where ![]() is IoT to fog and
is IoT to fog and ![]() is fog to cloud communication delay.
is fog to cloud communication delay.
The proposed system’s propagation delay ![]() , where
, where ![]() is IoT to fog, and
is IoT to fog, and ![]() is fog to cloud propagation delay.
is fog to cloud propagation delay.
The proposed system’s processing delay ![]() , where
, where ![]() and
and ![]() are processing delay in fog node and cloud server, respectively.
are processing delay in fog node and cloud server, respectively.
The proposed system’s queueing delay is ![]() .
.
The system’s overall delay is
The overall power consumption of smartphones has been calculated. During communication with fog nodes, smartphones are in active state ![]() . The rest of the time smartphones are in idle state
. The rest of the time smartphones are in idle state ![]() .
.
Power consumption during the communication stage is
Power consumption during propagation is
Power consumption during data processing is
Power consumption at queueing stage is
So, the overall power consumption is
A comparison of the device delay and power consumption in our proposed framework with the existing cloud-only framework is described in Section 4.
4: Performance evaluation
All experiments have been done using the experimental setup listed in Table 2. The GOQiia health fitness band was used as an IoT device for tracking the heartbeat, blood pressure, and temperature of the body. These data are stored in the smartphones through the app as .csv files. A smartphone with 2 GB RAM and 8 GB internal memory and three Raspberry Pi 3 with B+ models were used for experiment purposes. The smartphone and Raspberry Pi act as fog devices. Virtual machine (VM) of the Google Cloud Platform (GCP) was used with 3.75 GB RAM, 250 GB storage, and a Windows server. The experiment setup with medical data flow is shown in Fig. 6.
Table 2
| Device | Details |
|---|---|
| VM in GCP | 3.75 GB RAM, 250 GB storage and Windows server 2012 OS |
| Raspberry Pi 3B+ | 1 GB LPDDR2 SDRAM, 32GB SD card support, ARM Cortex |
| −A53 1.4 GHz 64-bit quadcore and Raspbian Stretch OS | |
| Smartphone | 2 GB RAM, 8 GB internal memory, 64-bit 1.2 GHz Qualcomm |
| Snapdragon 410 Quad Core with Android 6.0.1 | |
| Smartband | GOQii, body temperature, heart rate, SpO2 tracker |

The normal range of human health data is as follows:
- Body temperature: 96–98.6°F
- Blood pressure: 60–80 mmHg (diastolic) and 120–140 mmHg (systolic)
- Heart rate: 55–80 bpm
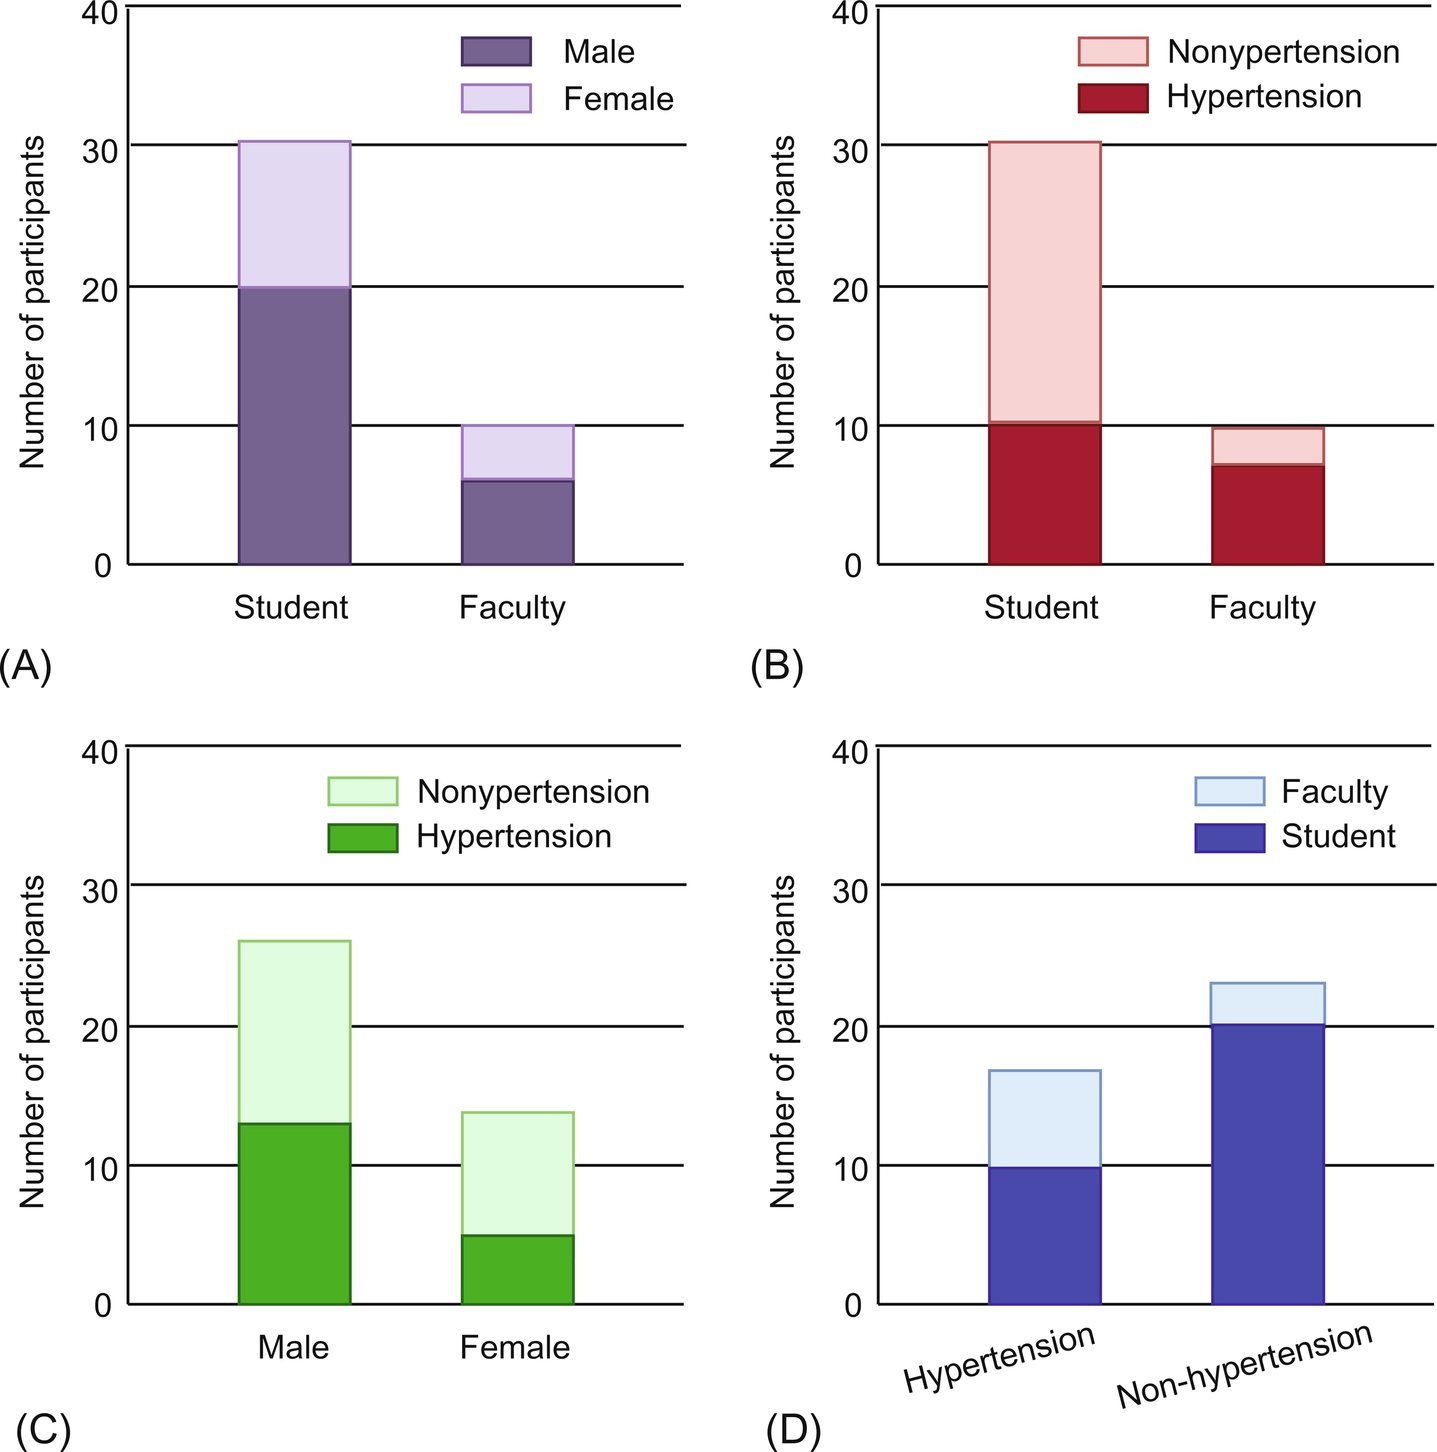
In our experiment, hypertension data from research students and faculty members of different age groups were collected. The pictorial view of the hypertension data analysis is shown in Fig. 7. Hypertension data from 30 research students and 10 faculty members were collected. Among the participants, 10 research students were female and 20 were male. Of the faculty member participants, 4 were female and 6 were male (refer to Fig. 7A). The number of students with hypertension was 10, and the number of faculty members was 7 (refer to Fig. 7B). A total of 12 males and 5 females were suffering from hypertension (refer to Fig. 7C). In total, 10 students and 7 faculty members were suffering from hypertension, whereas 20 students and 3 faculty members were free from it (refer to Fig. 7D).
For geospatial analysis, QGIS 2.18.28 was used, which was installed in the GCP VM. All geospatial datasets of area X were kept in the GCP VM. LULC, road, rail, medical center, and medical facility datasets were used for analysis. Five layers were overlaid in the QGIS and integrated, as it is easier to determine the user’s interest or apply any algorithms related to the multiple layers. The shortest path creation was carried out using the Dijkstra algorithm. For buffer creation, a built-in function was used for point vector data, as the health centers are considered to be points. The buffer of these health centers is a circle. In the experiment, a buffer around a 1 km radius was considered. The results of buffer creation and the shortest path determination are shown in Figs. 4 and 5.
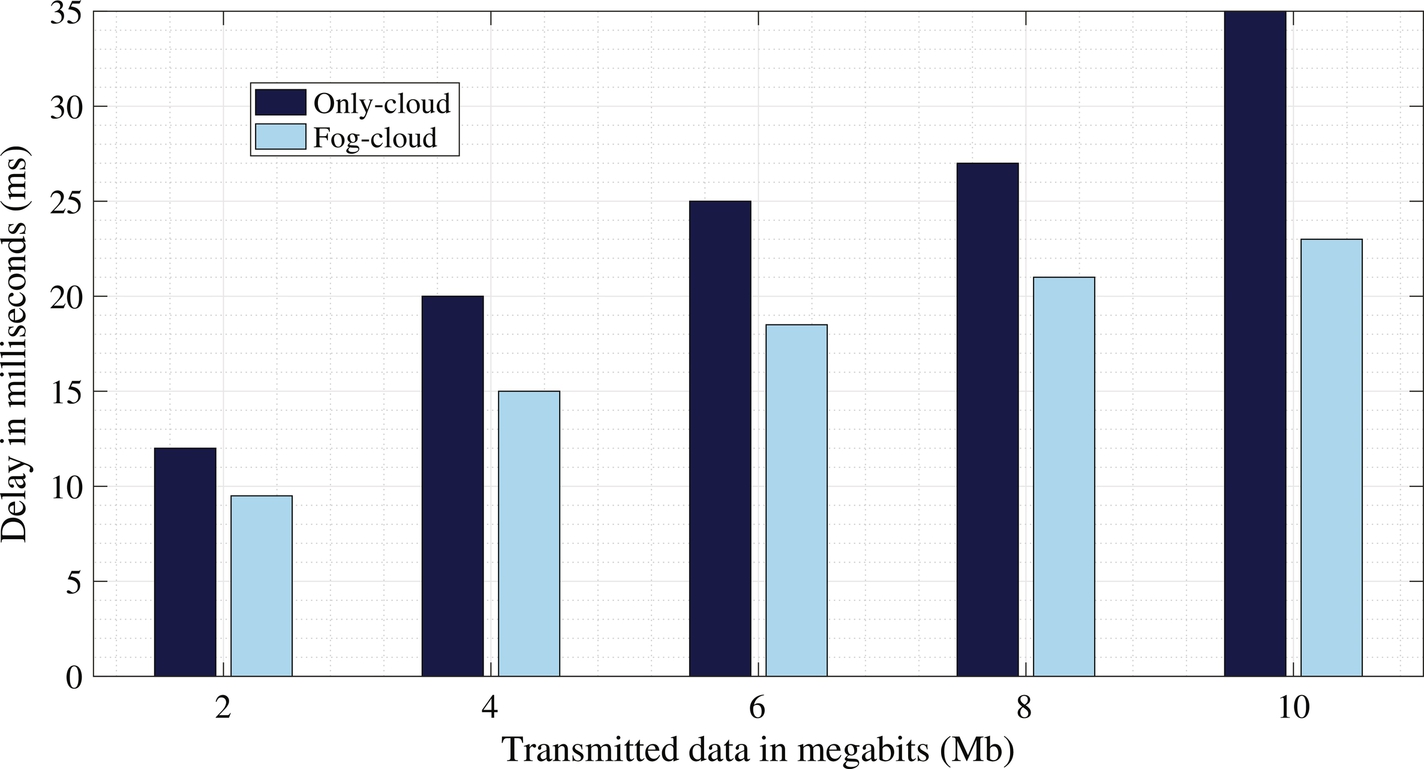
Delay and power consumption calculations were carried out with varying health data amounts in megabits. Fig. 8 shows that the delay in the fog-cloud environment is much lower than in the only-cloud environment. In the only-cloud domain, all data are processed in the remote cloud server. In our proposed fog-cloud integrated environment, small amounts of data are processed in nearby fog devices. These data are not sent to the remotely located cloud server, which reduces the delay in the overall process. Only the larger amounts of data are processed in the cloud server.
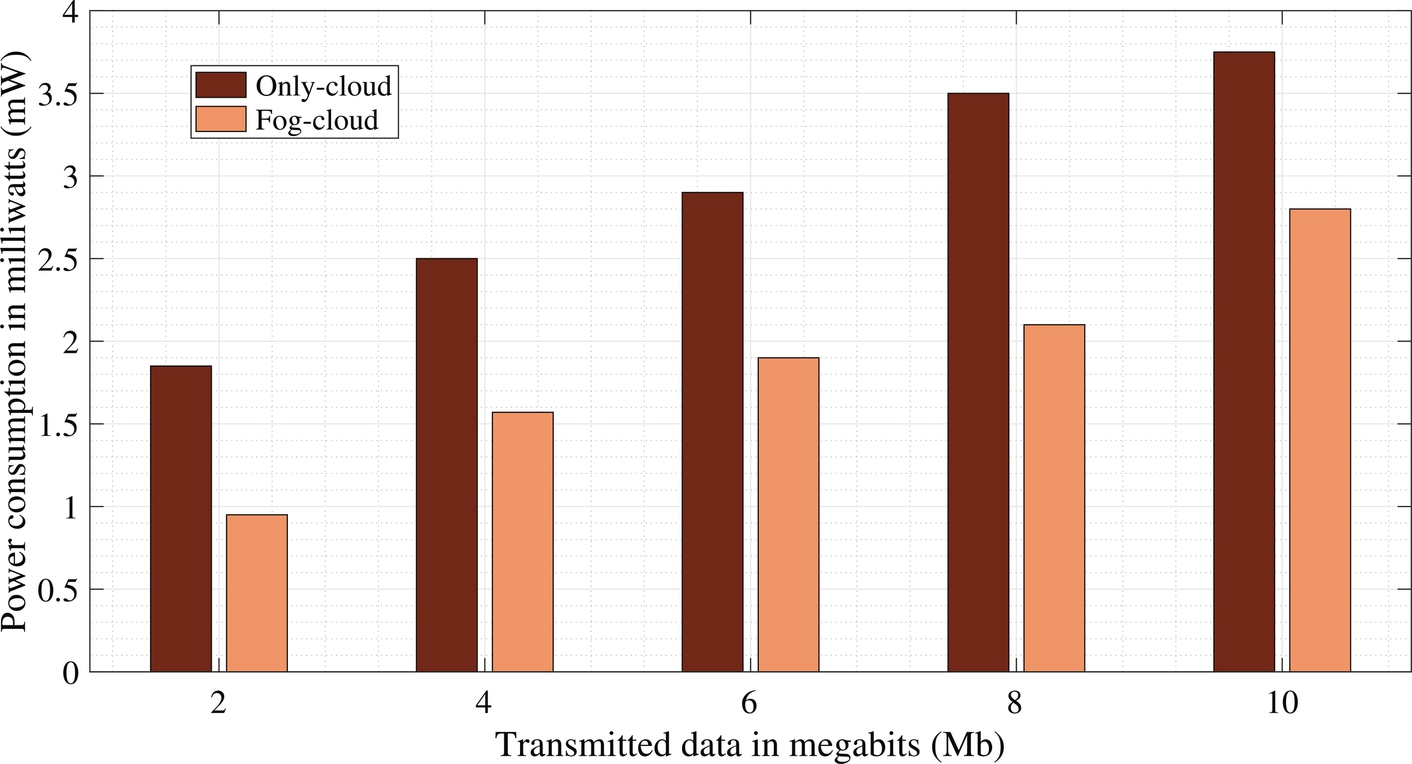
Similarly, different amounts of health data were transmitted to check the user device power consumption. Fig. 9 shows the power consumption of the user devices is much lower in the fog-cloud environment than in the only-cloud environment for health data transmission. A better result is achieved when the data size is increased.
5: Conclusion and future work
In this chapter, geolocation-based healthcare solutions with the support of IoT, cloud, and fog computing are discussed. The health data collection is carried out by IoT devices. Primary analysis is handled in the fog devices. If a critical indication arises in the primary analysis, the system moves to more detailed analysis. Further analysis is done within the cloud server with the patient’s historical data analysis by the medical practitioner. In critical situations, an ambulance or medical team can be sent to the patient’s geolocation using the shortest route. This chapter illustrates how geospatial analysis can help to find medical necessities in nearby locations and how to reach the medical center or hospital using the shortest path. Moreover, it is observed that the proposed framework outperforms an only-cloud platform with 25%–27% less delay, and 27%–29% less power consumption of smartphones or IoT devices.
In the future, machine learning techniques can be applied for better medical data analysis and health data classification. In this chapter, only hypertension data of patients were considered. Other diseases like diabetes, cancer, hepatitis, etc. can be taken into consideration in future healthcare research with the proposed hierarchical computing environments. Also, incorporating blockchain technology could make the medical data transfer more secure and trustworthy. Patients’ data could be generated from the secured devices, and the generated data treated as transactions on the blockchain. The patient health information could then be validated with a smart contract. No third person could change the patient data while it is transferred from the local database to the hospital database. If any health data were to be tampered with during the data transmission, it could easily be identified.