
Better team communication is the third major hypothesis about design patterns. The third experiment tests the hypothesis that if team members have common pattern knowledge, they can communicate more effectively than without. Obviously, there is no way around observing teams communicating when testing this hypothesis. The difficulty is how to elicit communication and how to evaluate it. Thinking-aloud or talking to an observer seemed unnatural for teamwork, so we decided to pair subjects and record their interactions (on audio and video) during design maintenance tasks, and then analyze the recordings.
The experimental setup was as follows. Pairs of subjects were given a design maintenance tasks. For eliciting an explanation phase, one subject of each pair was given extra time in advance. During this time, the subject studied requirements and design documents of the program. This member will be referred to as the expert. There was no time limit for preparation, but all subjects took about an hour. After preparation, the second team member joined as novice. The expert explained the program design to the novice. Subsequently, both team members collaborated on two maintenance tasks. This strategy provided a chance to observe two interesting communication phases: (1) the phase of explanation by expert to novice and (2) the teamwork phase between two maintainers.
The independent variable is design pattern knowledge. First, teams were given a pre-test, then they participated in a three-month lab course on design patterns, and finally they received a post-test. The whole experiment ran from April to August 1999. The lab course provided practical exercises for all patterns relevant for the tests (as well as other patterns). The experiment employed two different applications, one for pre-test and the other for post-test. For balancing differences in application complexity, the teams were divided into two groups that worked on the applications in alternate order. For balancing individual capability, the roles of expert and novice were also switched from pre- to post-test. Participants were 15 computer science graduate students in their eighth semester who had no prior experience with the design patterns used in the experiment.
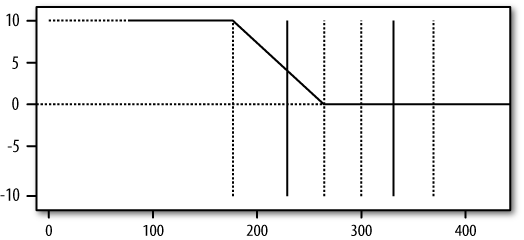
The next question was how to analyze the recordings. One of the experimenters transcribed the audio and video tapes into written protocols and then coded them with a simple coding scheme. (This was a lot of work. Coding a single recording took four weeks or more, and there were 12 protocols to do.) The coding scheme identifies the speaker and the type of utterance, such as question, atomic assertion, answer, and feedback. Especially important are atomic assertions about the designs because they carry crucial design information. For analyzing the coded protocols, each assertion by the expert is counted as +1, and each assertion by the novice as ‒1. A moving average of 70 data points is computed and scaled to a range of ‒10~ ..~ +10. The plot of the moving average is called a communication line. Figure 22-6 shows what we hypothesize as the ideal communication line. During the explanation phase, when the expert explains the program, the communication line should be at +10. After the first task is distributed, the line should drop to 0 if both novice and expert contribute equally to the discussion. The time when the two tasks are distributed are indicated by solid vertical lines; the dashed lines indicate the range of the 70-point moving average around the solid lines. The drop from 10 to 0 is a slanted rather than vertical line because of the smoothing. When ideal and actual communication lines are superimposed, deviations from the ideal can indicate, for instance, dominance of a team member. Comparing the deviations for pre- and post-test of a team can show, both qualitatively and quantitatively, how effectively the expert explains the program and how balanced the communication is during the teamwork phase.
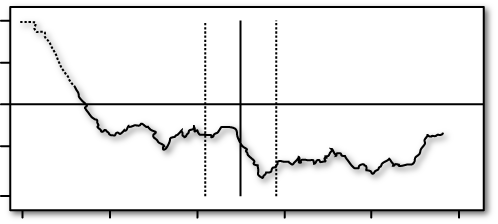
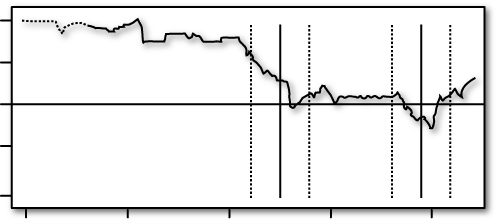
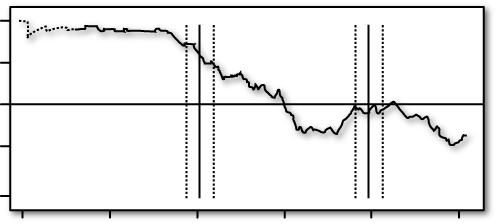
The results show that in the pre-test, all communication lines are heavily unbalanced, whereas most of the communication lines in the post-test exhibit a “hump” of explanation at the beginning and then become balanced around 0. Figure 22-7 shows the pre-test of Team T1. Here we have a case of novice dominance: the expert begins with explanations, but almost immediately the novice (who at first knows nothing about the software) takes over and dominates the discussion, as seen by the communication line being drawn below the center. Compare the communication line in Figure 22-8, when T1 has passed the patterns course. Now the other team member is the expert. Recall that this is the dominant person in Figure 22-7 (roles have been switched). But now, when they start discussing the maintenance task, the formerly weaker team member pretty much balances the communication.
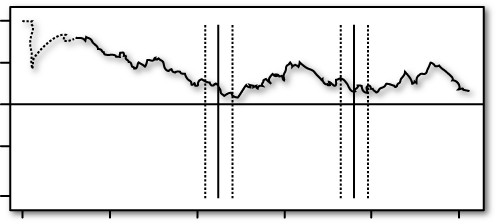
A case of expert dominance can be seen in Figures 22-9 and 22-10. In the pre-test, the expert dominates the conversation throughout, but in the post-test, the conversation becomes balanced.
For a quantitative analysis, we computed the difference between the ideal communication line and actual communication lines for all teams, pre- and post-test. First, we superimpose the ideal communication line over an actual communication line by lining up the points where the first task is distributed to the team members. Next, we sample the differences between the actual and ideal communication line 1,000 times in both the explanation and teamwork phases and compute the Euclidean distance. There is a pronounced difference between pre- and post-test in all cases; the Wilcoxon test[29] showed the difference as statistically significant at the 0.05 level. A qualitative analysis of the conversations showed that subjects talk about patterns in both pre- and post-test, but there is a more even flow of pattern information in the post-test. In the pre-test, pattern terminology is often used with little understanding.
The results show clear evidence that the communication lines of the design teams changed from pre- to post-test. Without shared pattern knowledge, the explanation phase is small or non existent, and the subsequent communication tends to be dominated by a single team member. After a three-month design pattern course, a clearly identifiable explanation phase is followed by a work phase with balanced communication. Even weaker team members can contribute equally to design discussions. These observations support the hypothesis that team members can communicate more effectively with design pattern knowledge. Apparently, using chunks that capture useful design abstractions improves communication.
[29] The Wilcoxon test evaluates whether two samples were drawn from the same population, without assuming normal distribution. For an explanation, look up the Mann-Whitney test in [Howell 1999].