
Chapter 6: Advanced Dynamic Analysis – Looking at Explosions
In action movies, it's often the case that when the hero walks away from an exploding object, they don't even bother to look back to see the destruction it is causing. Unfortunately for malware analysts, we don't tend to be quite as cool as action heroes, and our job requires that we closely observe the destruction being caused.
To this point, we've mostly worked with the static gathering of metadata on files from an advanced perspective. In this chapter, we'll begin executing our malware and observing the behaviors. This will allow an analyst to validate the data they have recovered from static analysis, as well as uncover Tools, Techniques, and Procedures (TTPs) that may not be apparent during the static analysis of a sample.
After we cover each of these topics, you'll also have the opportunity to try your luck against a real-world piece of malware – NetWalker Ransomware.
We'll cover the following topics:
- Monitoring malicious processes, and how to get away with it
- Deceiving malware via the network
- How malware hides in plain sight
- Examining a real-world example, TrickBot
Technical requirements
These are the technical requirements for this chapter:
- FLARE VM
- An internet connection
- The malware sample pack from https://github.com/PacktPublishing/Malware-Analysis-Techniques
- ProcDOT from https://www.procdot.com/downloadprocdotbinaries.htm
- Graphviz from https://graphviz.org/download/
Monitoring malicious processes
Executing malware in a virtual machine (VM) is one thing, but observing the behavior is another matter entirely. As we've previously discussed in the first Dynamic Analysis chapter, not all actions taken by malware are readily apparent to the end user who executed the malware.
This is by design—if it were obvious, the end user would alert their security team immediately, and the malware would be far less successful. As a result of the sneakiness implemented by adversaries to avoid detection, we require specialized tools to monitor each change made to the system by the malicious software.
Thankfully, there are several tools that fill this need and that will meet our purposes.
Keep in mind that during this chapter, as we utilize each tool to examine the malware, we'll either need to re-execute the malware when monitoring with a new tool or restore to a snapshot prior to execution in order to capture the pertinent information.
Regshot
While Regshot is quite an old tool at this point, it still functions very well and will provide a good basis for monitoring the filesystem and registry for changes that take place after malware is executed on the system.
The Regshot pane is shown in the following screenshot:
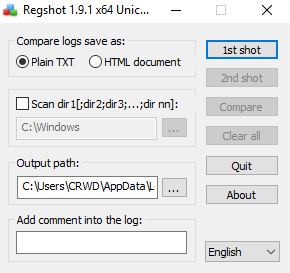
Figure 6.1 – The Regshot pane
As you can see, Regshot has a fairly simple user interface (UI), and the ability to recursively monitor directories and output to a text file once complete.
First, we'll select the ellipses next to the Output path: box, and select our desktop for ease of access after executing our malware.
The process is illustrated in the following screenshot:

Figure 6.2 – Selecting your output directory in Regshot
We'll also select the Scan dir option, and we'll set it to C:, to scan the entire disk. Because our VM is (relatively) small, this should not be too resource-intensive.
The process is illustrated in the following screenshot:
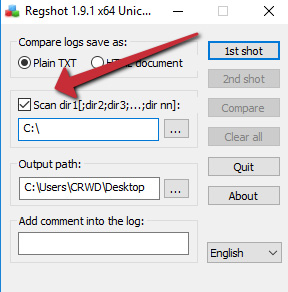
Figure 6.3 – Be sure to scan the filesystem as well
With these steps completed, we can select 1st shot and allow Regshot to work, which will take a few minutes. The program may appear to be stalled or to have crashed but will complete.
Analysis tip
Windows makes a lot of changes to the filesystem and registry on a fairly regular basis. To keep a low signal-to-noise ratio, I recommend waiting until the last possible second before executing your malware to take the base shot. Otherwise, a large portion of the changes Regshot records will be red herrings, and unrelated to the malware.
Once complete, Regshot will present you with a window enumerating the registry keys, directories, and files it was able to enumerate during the first shot, as illustrated in the following screenshot:

Figure 6.4 – The results of the first shot in Regshot
With our first shot complete, we can now execute our malware and look for changes! We'll begin by executing a sample of a DoppelDridex maldoc on our system, and letting the macro run. Once we've allowed the macro to run, we can repeat the steps with the second shot.
The process is illustrated in the following screenshot:

Figure 6.5 – The files written by Dridex, including Portable Executable (PE) files!
Then, we can click the Compare and Output button. Once complete, we'll be greeted by the differences that Regshot detected between the two shots, and a text file will open that has the raw results of the comparison of shots.
Here, we can see that there are two suspiciously named ZIP files in the Internet Explorer (IE) cache (though no browser was opened) and two additionally suspiciously named files dropped in %TEMP%:

Figure 6.6 – Contents of the downloaded Roshal Archive Compressed (RAR) file by DoppelDridex
Manually opening the .zip files in 7z shows they are actually PEs! From here, we could utilize our static analysis techniques from Chapter 6, Advanced Dynamic Analysis – Looking at Explosions, and ascertain that these are, in fact, dynamic-link libraries (DLLs) written by the DoppelDridex loader.
A shortcoming of Regshot should now be fairly apparent: due to the volume of changes made by software and the Windows operating system, an enormous amount of noise can be generated, making it quite difficult to ascertain malicious activity from normal system processes.
Process Explorer
Another useful tool is Process Explorer from Sysinternals—this will allow us to monitor processes in real time and see spawned processes that may result from malware. In the following screenshot, you can see it being put to use with an Excel process:
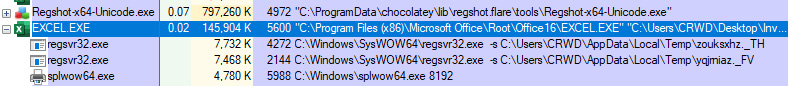
Figure 6.7 – The Excel process with malicious children
Utilizing Process Explorer, we can see that two regsvr32.exe processes have spawned under our Excel process, and are referencing the downloaded files we previously observed in Regshot. The DLL register server binary has been run with the -s switch, indicating no dialog boxes will be shown, so the DLLs are silently executed by RegSvr32.
While Process Explorer is simple and intuitive, it may not always provide a complete picture of the malware's path of execution. For this, we'll need to take the data we've already collected, revert our snapshot, and try again with a more advanced tool.
Process Monitor
Process Monitor (ProcMon) is another very popular tool among malware analysts from Mark Russinovich's suite of Windows Sysinternals tools. ProcMon will allow us to watch, in real time, every action a process—or set of processes—takes.
We can also filter by actions taken, process names, and myriad other conditions, as well as export to a clean comma-separated value (CSV) file or some other format. For this exercise, we'll need to re-execute the malicious document once we've completed our setup of ProcMon. Let's go ahead and get that set up now. Let's start by opening ProcMon, as follows:

Figure 6.8 – The ProcMon window and all its controls
As you can see, a lot of information immediately begins flowing in. Click the magnifying glass to immediately stop the capture, as we will not be interested in events that occur prior to running our malware.
Before execution, it's important that we set up filters for the activity we'd like to capture. Based on our previous dynamic analysis, we can say for certain that we'd like to watch the RegSvr32.exe and Excel.exe processes, as these will be the ones facilitating the malicious activity. Click the Filter button to open the filter dialog box shown in the following screenshot:
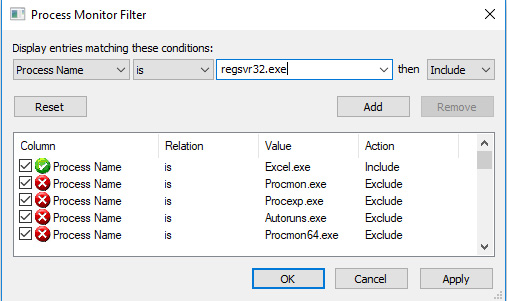
Figure 6.9 – Setting filters properly is crucial for success with ProcMon
We'll create rules for monitoring and including if the process name is excel.exe or regsvr32.exe, and then add and apply them. Before running our malware, let's be sure to clear the log to start with a fresh slate, by clicking the Clear button at the top of ProcMon.
We'll go ahead and open the maldoc and begin monitoring again right before we enable macros for the document, since no malicious activity will take place prior to this and will only contribute to noise.
After waiting a period, we have captured a good amount of data and can begin combing through our events. First, we'll take a look at file creation events. We can utilize the same filter dialog to create a filter that will only show us file creation events, as illustrated in the following screenshot:

Figure 6.10 – Filters properly set to monitor DoppelDridex
Once we've added this filter, it becomes easier to see where our malicious DLLs are created, as the following screenshot illustrates:
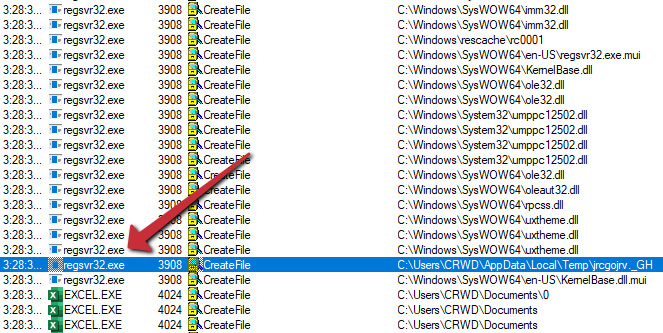
Figure 6.11 – The file creation event for the malicious PE
We can also utilize this to filter out network traffic related to the malware, as follows:
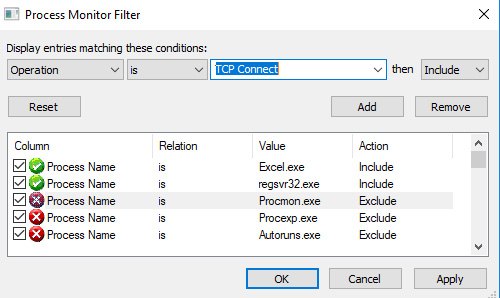
Figure 6.12 – Creating a filter for Transmission Control Protocol (TCP) traffic for DoppelDridex
Applying this filter shows HyperText Transfer Protocol (HTTP) activity to known DoppelDridex C2s, as illustrated in the following screenshot:

Figure 6.13 – The C&C traffic from Excel to download the malware's secondary stages
Here, we can view the sockets created and the TCP connections created by the malware.
Analysis tip
We'll cover this a bit more later on in the chapter when we examine other network-based tooling, but ProcMon isn't the ideal tool for mapping network traffic as there are other tools that do it far better. That said, it can do it, and most adversaries will utilize HTTP for C2 traffic, so feel free to use TCPConnect events for your initial triage, though Wireshark will do it better.
Similarly, we can choose to filter on registry operations that may be utilized for persistence by the malware. In this instance, no malicious registry operations have occurred, lending some credibility to the idea that we may have failed an anti-analysis check utilized by the malware to avoid detection or analysis by incident responders.
In the next section, we'll take a look at another tool we can utilize to make our ProcMon output a bit more easily ingestible.
ProcDOT
ProcDOT is a tool requiring external dependencies that can greatly ease the digestion of event data from ProcMon. ProcDOT's external dependencies are WinDump and Graphviz, which can be downloaded from the links included in the Technical requirements section of this chapter.
Additionally, some small configuration changes are required for ProcDOT to properly parse the files. These are outlined in detail in the readme.txt file included with ProcDOT—follow the directions in this file for simple column changes within ProcMon.
Once set up, we can export our ProcMon logs by utilizing Save… within the File menu, as illustrated in the following screenshot:
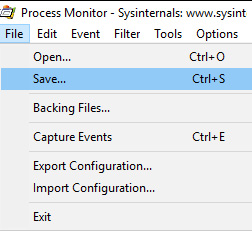
Figure 6.14 – Saving our ProcMon output
This will generate another window. Here, we'd like to save the file in CSV format, not the ProcMon Log (PML) format native to ProcMon. Choose a good location for your file and begin the export, which may take a while. The process is shown in the following screenshot:
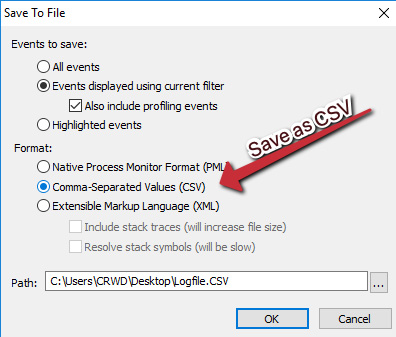
Figure 6.15 – The file must be in CSV format to be compatible with ProcDOT
Once we've completed this step, we can point ProcDOT to our dependencies, utilizing the popup that opens upon startup. Point ProcDOT to the correct binaries for each dependency. The process is illustrated in the following screenshot:
Figure 6.16 – Pointing ProcDOT to the correct dependency locations
Once complete, you may load your CSV file into ProcDOT by utilizing the ProcMon menu button. With this done, click the Launcher button, as illustrated in the following screenshot:

Figure 6.17 – Selecting the appropriate parent process within ProcDOT
Here, we want to select the first relevant process—in this case, Excel, as it was the source of the malicious macro:

Figure 6.18 – Here, Excel is our instigator
After double-clicking the relevant process and clicking the Refresh button, a large graph of processes should present itself! You can see an example graph in the following screenshot:
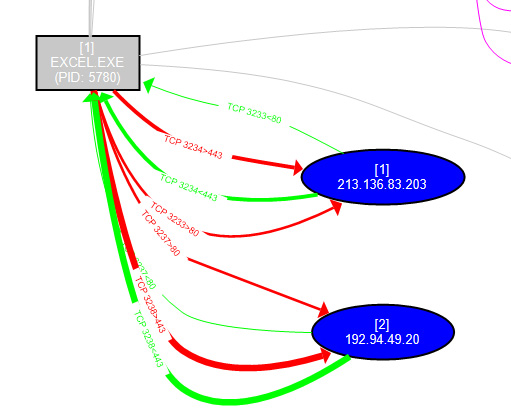
Figure 6.19 – Malicious C&C traffic as illustrated by ProcDOT
Here, we can see a graphical representation of the network C2 traffic captured by ProcMON to the DoppelDridex C2s, and scrolling further to the right, we can see the RegSvr32.exe processes spawned by Excel:
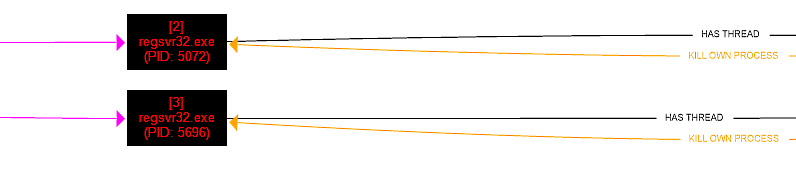
Figure 6.20 – The child processes responsible for executing the second stages
Unfortunately, in this instance, DoppelSpider appears to be onto our game, and the processes self-terminate, leaving us with only this activity.
While the tooling that we have discussed will be a great help to us in our analysis of adversarial software—an important point to remember is that adversaries frequently do not want to be monitored and will go to great lengths to prevent this.
Getting away with it
Malicious processes do not like to be watched. This is a fact of malware analysis that is unavoidable. Malware authors would much rather analysts never take interest in their work.
For instance, let's take a look here at some anti-analysis strings that are present in the Qakbot banking Trojan threat:
"Fiddler.exe;samp1e.exe;sample.exe;runsample.exe;lordpe.exe;regshot.exe;Autoruns.exe;dsniff.exe;VBoxTray.exe;HashMyFiles.exe;ProcessHacker.exe;Procmon.exe;Procmon64.exe;netmon.exe;vmtoolsd.exe;vm3dservice.exe;VGAuthService.exe;pr0c3xp.exe;ProcessHacker.exe;CFF Explorer.exe;dumpcap.exe;Wireshark.exe;idaq.exe;idaq64.exe;TPAutoConnect.exe;ResourceHacker.exe;vmacthlp.exe;OLLYDBG.EXE;windbg.exe;bds-vision-agent-nai.exe;bds-vision-apis.exe;bds-vision-agent-app.exe;MultiAnalysis_v1.0.294.exe;x32dbg.exe;VBoxTray.exe;VBoxService.exe;Tcpview.exe"
We can infer from this set of tool names that are present within an encrypted array in the Qakbot threat that it is likely utilizing the CreateToolhelp32Snapshot Windows application programming interface (API) to iterate through running processes and refuse to continue along the execution path if one of the images is found to be running.
However, what if instead of running procmon.exe or procmon64.exe we were running AngryPinchyCrab.exe? AngryPinchyCrab.exe doesn't appear in the list and, as such, may not raise an alarm to halt execution. There are other factors at play, but often, simply renaming our tools is enough to proceed along to the next step.
At this point, we've covered a large portion of dynamic analysis tricks—those that interact directly with the system. But malware has been network-aware for nearly all of its existence, and networking comprises a huge part of how malware behaves. Let's take a dive into how we can examine what malware may be doing at the network level.
Network-based deception
Often, we as analysts may want to execute malware without directly exposing our box to the internet, for a myriad of reasons covered in the first chapter. For this, tools such as the following are crucial:
- FakeNet-NG
- ApateDNS
- Python's SimpleHTTPServer
We'll cover each of these and their use cases in deceiving our adversarial counterparts so that we may better understand the ends they are attempting to achieve.
FakeNet-NG
FakeNet is a fairly simple application. The application hooks into the network adapter, and "tricks" the malware into believing it is the primary network adapter. As it does so, it also records all traffic, including outbound HTTP and HTTP Secure (HTTPS) requests. The FakeNet-NG logo is shown here:

Figure 6.21 – The FakeNet-NG logo
FakeNet can be started by searching in the Start menu and utilizing Ctrl + Shift + Enter to run the program as administrator. You can see the tool in operation here:

Figure 6.22 – Capturing HTTP traffic with FakeNet-NG
As you can see, after running our malicious DoppelDridex sample, FakeNet captures traffic to the malware distribution servers for a download request for /bfe2mddol.zip—a ZIP file containing the malicious files that would later be executed with RegSvr32.
ApateDNS
ApateDNS is a free tool from FireEye that intercepts Domain Name System (DNS) requests and—optionally—forwards them to a designated Internet Protocol (IP) of your choosing. It can be downloaded from the Uniform Resource Locator (URL) listed in the Technical requirements section of this chapter, and no setup is required as it is a portable application.
Upon opening the application, you'll be presented with the following screen:

Figure 6.23 – The ApateDNS startup screen
We can click the Start Server button to begin capturing DNS requests in ApateDNS. For now, we'll leave everything else blank. You should then be presented with the following screen:
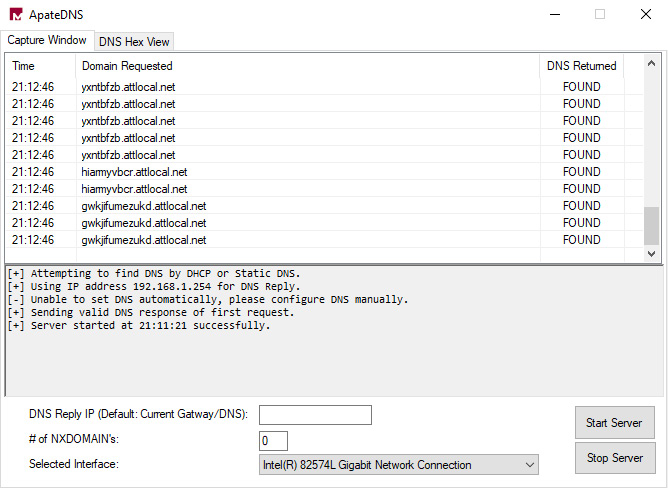
Figure 6.24 – ApateDNS capturing randomly generated domains
As you can see, the DoppelDridex launcher attempts to look up several randomly generated domains as an anti-analysis measure. Because ApateDNS responds to these and returns a known IP address, the malware sample halts execution to prevent further analysis of the malware.
We can also utilize ApateDNS in another way—combining it with Python's SimpleHTTPServer to really get the most out of our ability to lie to the malware on a network level.
Utilizing Python's SimpleHTTPServer with ApateDNS
The real power behind ApateDNS lies in being able to lie to malware samples and droppers. We can monitor for DNS lookups and respond with the IP of a web server we control—by extension, forwarding HTTP requests meant for the C2 to ourselves. Let's take a look at an example, using a sample of the ZLoader maldoc from Q4 2020.
First, running the sample and monitoring ApateDNS, we can see a request made to jmnwebmaker.com—a likely exploited host utilized for C2 or distribution, as illustrated in the following screenshot:

Figure 6.25 – ApateDNS capturing C2/distribution server traffic
Armed with this information, we can start a simple HTTP server—either on our current analysis machine or on an outside machine, as long as it is reachable by the analysis box itself—utilizing the python -m http.server 80 command line.
Once this is complete, we can then add our IP into the DNS Reply IP box in ApateDNS to lie to the malicious sample, and have it reach out to our server for further instruction or samples. The process is illustrated in the following screenshot:
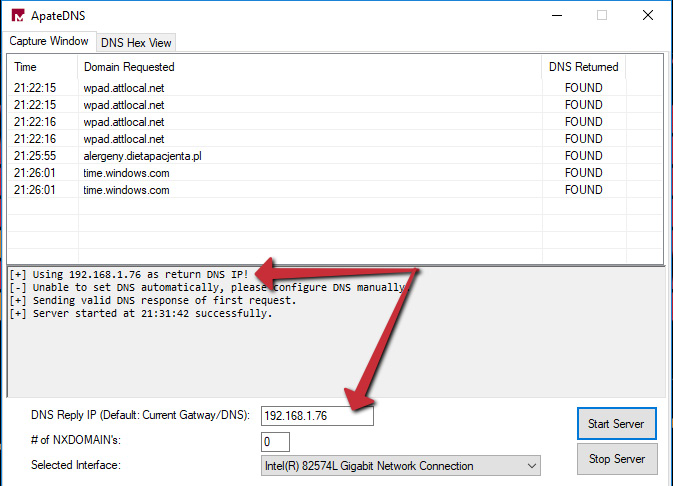
Figure 6.26 – Spoofing DNS replies for the malware
Once we have stopped the server and restarted it using the necessary buttons, we may run our sample once more.
After running the sample, you can see here that we've captured multiple HTTP requests for what are likely malicious secondary stages that exist on the web server:

Figure 6.27 – Captured HTTP traffic in Python!
We can compare the requests with the DNS queries ApateDNS has responded to in order to build a full URL, as illustrated in the following screenshot:
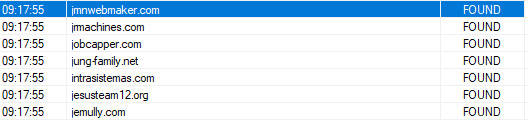
Figure 6.28 – The fully qualified domain names (FQDNs) of several malicious servers in ApateDNS
For instance, here are a few examples:
- hxxp://jmnwebmaker[.]com/images/vU/
- hxxp://jmachines[.]com/phpbb/F/
- hxxp://jobcapper[.]com/8.7.19/ii/
Analysis tip
Why hxxp? In malware analysis, it's a good best practice to "defang" URLs by utilizing hxxp instead of http and placing brackets around dots in URLs to prevent them from being accidentally clicked by your audience and causing them to download malware!
We can then utilize this information to pull down secondary stages for analysis without actually installing those secondary stages or allowing the malware to perform actions on the secondary stage such as decryption, quick running, and overwriting with a benign executable, and so on.
In the past few instances, our malicious processes have been fairly obvious, but what happens when malware hides inside of another "legitimate" system process? Let's take a look at some examples.
Hiding in plain sight
Malicious processes are often obvious and stand out to experienced malware analysts or to anyone who has a familiarity with which process(es) should be running on a standard Windows installation.
As with anything in analysis and prevention, this is a bit of an arms race with the adversaries responsible for writing malicious code. A common set of techniques utilized by malware authors falls under the category of process injection.
Adversaries can employ a number of techniques in order to accomplish process injection, including spawning new processes in a suspended state, allocating memory within them, and then writing malicious code into this created memory space (process hollowing), or injecting a thread into an existing process.
Some of these techniques can be inferred by the presence of certain API calls within the binary, as outlined in Chapter 6, Advanced Dynamic Analysis – Looking at Explosions. The API calls are listed here:
- VirtualAllocEx
- WriteProcessMemory
- CreateRemoteThread
- NtCreateThreadEx
- QueueThreadAPC
Any combination of these APIs, in combination with APIs such as CreateToolHelp32Snapshot, should be viewed as highly suspect by an analyst, as it's likely the sample is enumerating running processes in order to iterate through and find the process they would like to utilize as a target for process injection.
Types of process injection
We'll quickly cover the basics of each type of process injection. Although it's not going to be within scope to discuss the minute technical differences involved in calling the APIs and injecting into processes in myriad different ways, it's good to have a fundamental understanding of the types of process injection and how they work at a basic level.
Classic DLL injection
In classic DLL injection, the malicious process will often utilize CreateToolHelp32Snapshot in order to iterate through processes until it locates the process it would like to target. Once located, the malicious process will utilize VirtualAlloc and WriteProcessMemory to write the path for a malicious DLL into the virtual address space of the target process.
Once the DLL's path is written into the virtual memory space of the target process, the malicious process will utilize CreateRemoteThread in order to force the process to load the malicious library. This injection technique is commonly utilized by Dridex/DoppelDridex to inject into Explorer.exe.
PE injection
This technique is highly similar to classic DLL injection. Instead of injecting the path to the DLL into the virtual memory of the process, the malware will create address space utilizing VirtualAlloc, then write a PE directly into the memory address space using WriteProcessMemory, and ensure code execution by utilizing CreateRemoteThread or similar undocumented APIs such as NTCreateThreadEx.
Thread execution hijacking
In this technique, the malware will suspend an existing thread of a process. First, the malware will suspend the thread, utilize VirtualAlloc to clear memory space for the path of the DLL, and inject the path to the DLL and a call to LoadLibrary in order to load the malicious DLL into the existing thread in the process. The malware will then instruct the thread to resume.
For this reason, this technique is also known as Suspend, Inject, Resume.
AppInit DLLs, AppCert DLLs, Image File Execution Options
These injection techniques involve altering registry keys in order to force processes to load malicious DLLs. The altered keys to keep an eye out for are listed here:
- HKLMSoftwareMicrosoftWindows NTCurrentVersionWindowsAppinit_Dlls
- HKLMSoftwareWow6432NodeMicrosoftWindows NTCurrentVersionWindowsAppinit_Dlls
- HKLMSystemCurrentControlSetControlSession ManagerAppCertDlls
- HKLMSoftwareMicrosoftWindows NTCurrentVersionimage file execution options
Depending on the technique utilized, this will force legitimate processes that load certain libraries to additionally load the malicious DLL specified within the registry keys. The libraries for AppInit and AppCert DLLs are listed here:
- AppInit DLLs:
User32.dll
- AppCert DLLs:
CreateProcess
CreateProcessWithTokenW
WinExec
CreateProcessWithLogonW
CreateProcessAsUser
For Image File Execution Options (IFEO), the injection mechanism is not dependent on the process loading a library. The adversary can set a malicious DLL as a Debugger value in the corresponding registry key for the target process, and the library or process will be loaded upon execution of the target process.
Process hollowing
Process hollowing is a fairly simple technique. The malicious process will spawn a legitimate process in a suspended state and will then unmap the legitimate code from the process utilizing VirtualAlloc. The code within the process will then be replaced with malicious code utilizing WriteProcessMemory, and the process will be resumed.
Now that we've examined the most common methodologies utilized by malware to inject into legitimate system binaries, let's take a look at how we can detect process injection.
Detecting process injection
Detecting process injection can be a bit tricky since default logging within Windows does not necessarily supply this capability.
There are certain simple things we can utilize, such as the spawning of new processes as child processes of malicious ones, which would be apparent in ProcDOT. We can also utilize the AppInit DLLs section of AutoRuns in order to ascertain whether our malware has created values that will cause process injection upon startup.
However, these methods will not detect all kinds of process injection, so we require another way to be able to monitor our system for malicious processes utilizing CreateRemoteThread to inject into existing processes.
Thankfully, System Monitor (Sysmon) has this capability, and it tracks the utilization of CreateRemoteThread with Event Type 8. To install Sysmon, open Command Prompt on your FLARE VM as administrator, and simply run sysmon -i:, as illustrated in the following screenshot:
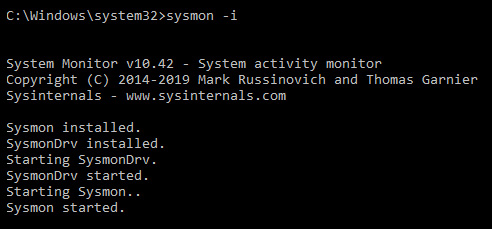
Figure 6.29 – Starting and installing Sysmon
Once installed, we can emulate a thread injection utilizing the AtomicRedTeam tool, in order to test several DLL injection methods at once for detection in Sysmon, as illustrated in the following screenshot:
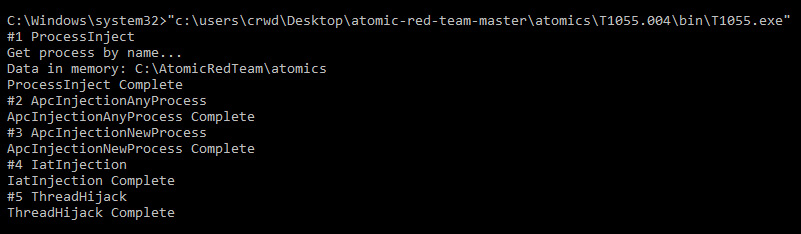
Figure 6.30 – Running the AtomicRedTeam tool for process injection
Once done, several windows will appear due to new processes being spawned for injection. Navigating to our Sysmon logs, we can see that process injection has been recorded with Event ID 8, and the source and destination executables are available, as illustrated in the following screenshot:
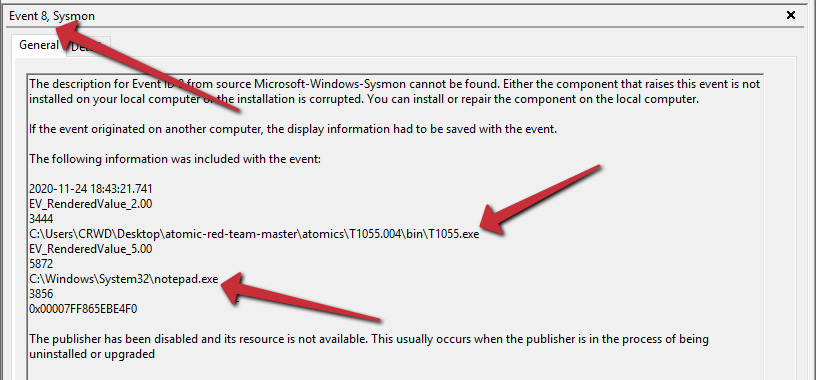
Figure 6.31 – Sysmon capturing the injection events
Utilizing Sysmon and tracking this event are a great way to detect process injection and track possible malicious activity in your Security Information and Event Management (SIEM). It's also likely your endpoint detection and response (EDR) platform has good detections for process injection, so be sure to not discount it.
With all of these new skills and abilities to detect under our belt, let's take a look at a real-world example in the case of TrickBot, and see how we may apply these techniques to real malware.
Case study – TrickBot
Let's take a look now at some real-world examples of malware that we can analyze and observe performing malicious activity, performing network requests and process injection, and being naughty in general.
TrickBot is a banking Trojan from a threat actor tracked as WIZARD SPIDER. TrickBot has many core functionalities, one of which is to utilize process hollowing to masquerade within the environment.
Let's grab a sample and run it within our VM. First, we'll utilize Regshot, ProcMon, and ProcWatch to identify file information and registry key changes, as follows:
- First, we'll take our baseline snapshot. This will serve as the comparison point, as we've previously discussed in the Regshot section. The following screenshot illustrates this:

Figure 6.32 – The results of our first TrickBot shot
- After taking our baseline shot, we'll go ahead and execute the malicious document containing the TrickBot downloader macro, as follows:

Figure 6.33 – TrickBot's latest and greatest social engineering
- After allowing the malicious script to execute for a few moments, we can take our second shot, and then press the Compare button in Regshot to reveal the following information:

Figure 6.34 – What changed after our malware sample was run
- Once the comparison is done, Regshot should automatically open the HTML or text file (TXT) report. Here, we can view the actions taken both by Windows and the malware between the two corresponding shots that we took:
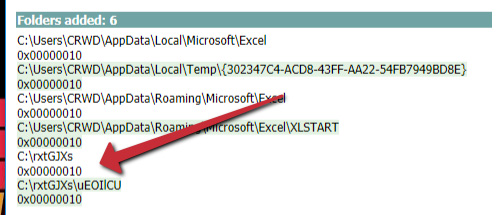
Figure 6.35 – Suspicious directories created
- As we can see in the following screenshot, the TrickBot sample has created the C:
xtGJXsuEOlCU directory, containing the URLdaxT.dll file:

Figure 6.36 – Obviously malicious DLLs dropped to disk
- Moving to ProcWatch, we can see that RunDll32.exe is then run with the TrickBot DLL, utilizing the DLLRegisterServer entrypoint. Shortly thereafter, WerMgr.exe is suspiciously spawned as a child process of RunDLL32, as illustrated in the following screenshot:

Figure 6.37 – The TrickBot processes and the corresponding injected child process
- Viewing the process and understanding WerMgr, it quickly becomes apparent that this process has been utilized for process hollowing. We can validate this assumption by checking to see whether or not the DLL imports WriteVirtualMemory, but given the central processing unit (CPU) and memory usage, it's a fair assumption that this process has been hollowed and is no longer the legitimate WerMgr.exe file. The process is shown in the following screenshot:
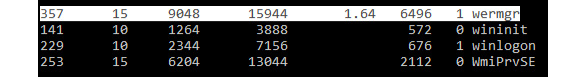
Figure 6.38 – The injected WerMgr process utilizing fairly high random-access memory (RAM) and CPU
Unfortunately, because this does not utilize the CreateRemoteThread API, it will not trigger Sysmon event 8. However, understanding that WerMgr is the Windows process responsible for uploading and handling error reports and should almost never be running consistently gives a good hint as to the malicious purpose of the process in this scenario.
However, monitoring the sample in ProcMon, and then loading the resultant CSV file into ProcDOT tells us a much different story, as we can see here:
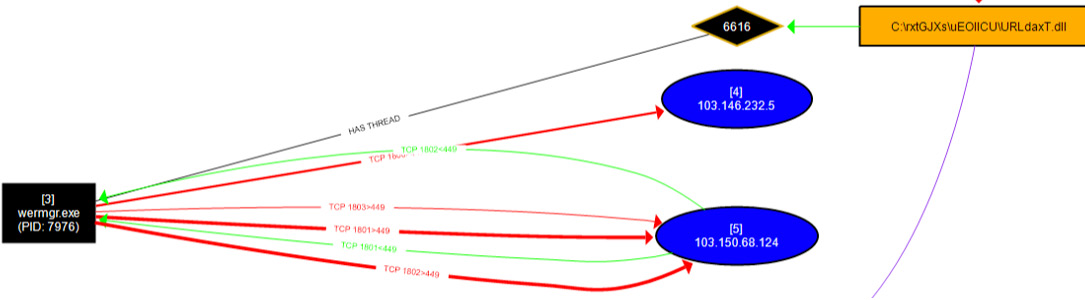
Figure 6.39 – ProcDOT showing the injection process and C&C communication from WerMgr
Here, it is very apparent that the malicious DLL being executed both spawned WerMgr.exe and has a thread on it—not to mention the fact that WerMgr.exe is currently making network calls to known TrickBot C&C servers.
Knowing a process is malicious and being able to prove a process is malicious are two very different things.
Now, let's test the knowledge we've gained in this chapter against real-world examples of malware—NetWalker!
Challenge
For this challenge, you'll be tasked with dynamically analyzing the ransomware threat NetWalker. Utilizing the sample pack located in the Technical requirements section of this chapter, attempt to answer the following questions:
- Which process(es) does PowerShell spawn as a result of opening the .PS1 file? Why?
- Does the malware attempt to download, or succeed in downloading any secondary stages? Why or why not?
- Does the malicious process inject into any other process(es)? If so, which ones?
- Bonus: Can you tell which technique the actor is using for process injection? How?
Summary
In this chapter, we discussed many different methods of coaxing information out of a malicious sample that is currently running within our environment. We've covered garnering information about files and registry keys changed or written with Regshot, monitoring processes with ProcMon, and increasing their legibility with ProcDOT. We've also examined how we can lie to the adversarial software about our network, and twist this to our advantage in the fight against malware.
In the next chapter, we'll take dynamic analysis even a step further, and examine how to defeat anti-analysis tricks that we may encounter and what debugging these samples looks like.