
Our Chief Data Scientist in the project is very skilled; unfortunately, he has no Apache Spark expertise since he is a mathematician mainly working with MATLAB and R. So in these cases, SparkR is a good choice to facilitate the transition to using Apache Spark. The following notebook is based on the R programming language. An Apache Spark expert created the initial DataFrame loading code, whereas the rest of the notebook was directly working on a local R DataFrame in contrast to an Apache Spark DataFrame -– something the Data Scientist was familiar with.
So, let's have a look at the steps executed in this notebook:
- Load the DataFrame from the ObjectStore.
- Generate some additional columns in the dataset based on mean and standard deviation.
- Plot the additional columns.
So again, loading data from ObjectStore using Apache SparkR is straightforward:

Now it's time for the Data Scientist to create some additional columns based on the mean and standard deviation. He is using SQL since this is within his skill set:
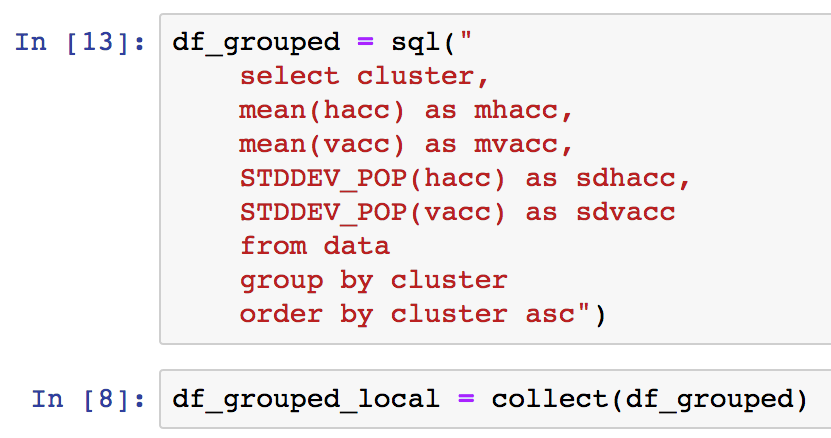
By calling collect, an R DataFrame called df_grouped_local is created, which can be used out-of-the-box by any R programmer without Apache Spark skills. This R DataFrame is used in order to plot those additional columns. Let's have a look at one:

As can be seen from the preceding figure, the standard deviation of the horizontal vibrations dramatically increases as the life of the bearing approaches it's end. This is enough for our Data Scientist to do some magic in R, which we than can port back to Apache SparkML in order to scale. Of course in the long term we hope that our Data Scientist will be able to write Apache Spark code himself.