Chapter 9

Understanding Plot Styles

To gain full control over the appearance of your output, you’ll want to know about plot style tables. By using plot style tables, you can control how colors are translated into plotted lineweights and how area fills are converted into shades of gray or screened colors in your printer or plotter output. You can also control other aspects of how the plotter draws each object in a drawing.

If you don’t use plot style tables, your plotter will produce output as close as possible to what you see in the drawing editor, including colors. With plot style tables, you can force all the colors to print as black, and you can also assign a fill pattern or a screen to a color. This can be useful for charts and maps that require area fills of different gradations. You can create multiple plot style tables to produce plots that fit the exact requirements of your project.

This chapter will show you firsthand how you can use plot style tables to enhance your plotter output. You’ll look at how to adjust the lineweight of the walls in the Plan file and make color changes to your plotter output.

In this chapter, you will learn to:

  • Choose between color-dependent and named plot style tables
  • Create a color plot style table
  • Edit and use plot style tables
  • Assign named plot styles directly to layers and objects

Choosing Between Color-Dependent and Named Plot Style Tables

You can think of a plot style as a virtual pen that has the attributes of color, width, shape, and screen percentage. A typical drawing may use several different line widths, so you use a different plot style for each line width. Multiple plot styles are collected into plot style tables that allow you to control a set of plot styles from one dialog box.

The AutoCAD® 2014 software offers two types of plot style tables: color and named. Color plot style tables enable you to assign plot styles to the individual AutoCAD colors. For example, you can assign a plot style with a 0.50 mm width to the color red so that anything that is red in your drawing is plotted with a line width of 0.50 mm. You can, in addition, set the plot style’s color to black so that everything that is red in your drawing is plotted in black.

Named plot style tables let you assign plot styles directly to objects in your drawing instead of assigning them in a more general way through a color. Named plot style tables also enable you to assign plot styles directly to layers. For example, with named plot styles, you can assign a plot style that is black and has a 0.50 mm width to a single circle or line in a drawing, regardless of its color.

Named plot styles are more flexible than color plot styles, but if you already have a library of AutoCAD drawings set up for a specific set of plotter settings, color plot styles are a better choice when you’re opening files that were created in AutoCAD 2000 and earlier. This is because using color plot styles is more similar to the older method of assigning AutoCAD colors to plotter pens. You may also want to use color plot style tables with files that you intend to share with an individual or an office that is still using earlier versions of AutoCAD.

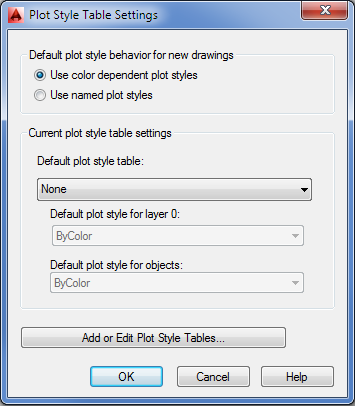
The type of plot style table assigned to the new default Drawing1 depends on the settings in the Plot Style Table Settings dialog box, which you access through the Plot And Publish tab of the Options dialog box.

You can change the type of plot style table assigned to a drawing. See the sidebar “Converting a Drawing from Color Plot Styles to Named Plot Styles” later in this chapter for more information on plot style conversions.

Here’s how to set up the plot style type for new files:

1. Open the Options dialog box (choose Options from the Application menu), and click the Plot And Publish tab.
2. Click the Plot Style Table Settings button in the lower-right corner of the dialog box to open the Plot Style Table Settings dialog box (see Figure 9-1).

Figure 9-1 The Plot Style Table Settings dialog box

c09f001.tif
3. In the Default Plot Style Behavior For New Drawings group, click the Use Color Dependent Plot Styles radio button. In a later exercise, you’ll select the Use Named Plot Styles option.
4. Click OK. Then click OK again in the Options dialog box to return to the drawing.

After you’ve set up AutoCAD for color plot style tables, the default Drawing1 file, which appears when you open AutoCAD, will use only color plot style tables. You can change this setting at any time for new files, but after a file is saved, the type of plot style (named or color dependent) that is current when the file is created is the only plot style available to that file. If you need to change a color plot style for a named plot style drawing, see the sidebar “Converting a Drawing from Color Plot Styles to Named Plot Styles” later in this chapter.

Next, you’ll set up a custom color plot style table. Plot style tables are stored as files with the .ctb or .stb filename extension. The tables with filenames that end with .ctb are color plot style tables. The tables with the filename extension .stb are named plot style tables.


Select a Plot Style When Starting a New Drawing
You can also select between color and named plot styles when selecting a new drawing template. When you choose New from the Quick Access toolbar, you’ll see that some of the template files in the Select Template dialog box have Named Plot Styles as part of their name, with the remainder utilizing Color Dependent Plot Styles. If you have AutoCAD set up to use the Startup dialog box, you’ll see these template files when you select the Use A Template option from the Create New Drawing dialog box.

Creating a Color Plot Style Table

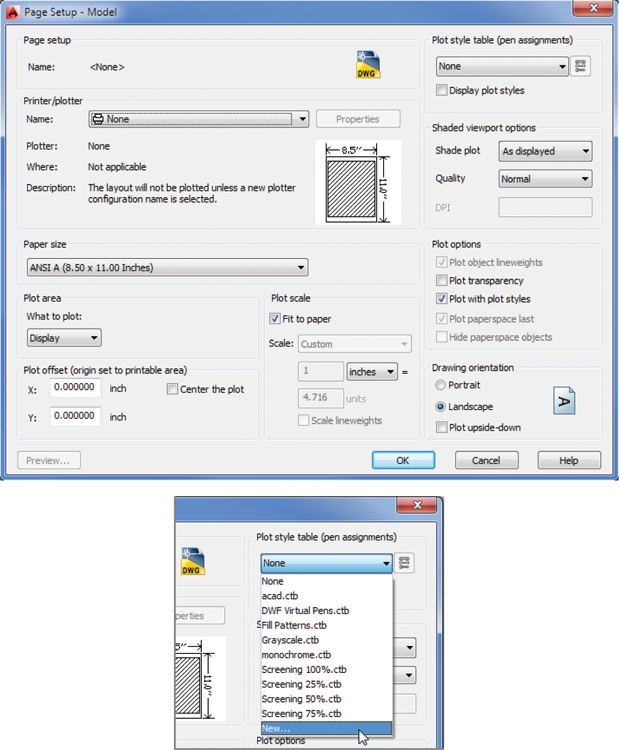
You can have several plot style table files on hand to apply plot styles quickly to any given plot or Layout tab. You can set up each plot style table to create a different look for your drawing. These files are stored in the Plot Styles folder of the C:UsersUser NameAppDataRoamingAutodeskAutoCAD 2014R19.1enuPlotters folder. Follow these steps to create a new plot style table. You’ll use an existing drawing to learn about the plot style features:

c09i001.tif
1. Open the sample file Plan-color.dwg, and then click the Layout1 tab below the drawing area. If you don’t see the Model and Layout tabs, click the Quick View Layouts tool in the status bar.
c09i002.tif
2. Click the Page Setup Manager tool in the Output tab’s Plot panel. Then click Modify in the Page Setup Manager dialog box.
3. The Page Setup dialog box (see Figure 9-2) is similar to the Plot dialog box. The main difference is that the Page Setup dialog box doesn’t have the Apply To Layout button at the bottom.

Figure 9-2 Creating a new plot style table

c09f002.eps
In the Plot Style Table (Pen Assignments) group at the upper right, open the drop-down list and select New to launch the Add Color-Dependent Plot Style Table Wizard.
4. Click the Start From Scratch radio button, and then click Next. The next screen of the wizard asks for a filename.
5. Enter Mystyle for the filename, and click Next. The next screen of the wizard lets you edit your plot style and assign the plot style to your current, new, or old drawings. You’ll learn about editing plot styles a bit later.
6. Click Finish to return to the Page Setup dialog box.
c09i003.tif

With the Add Color-Dependent Plot Style Table Wizard, you can create a new plot style table from scratch, or you can create one based on an AutoCAD 2000 CFG, PCP, or PC2 file. You can also access the Add Color-Dependent Plot Style Table Wizard by clicking the Plotter Manager tool in the Output tab’s Plot panel. Open the Plot Styles folder, and then double-click the Add-A-Plot Style Table Wizard application. You can also choose Print ⇒ Manage Plot Styles from the Application menu.

The steps shown here are the same whether your drawing is set up for color plot styles or named plot styles.

Editing and Using Plot Style Tables

You now have your own plot style table. In this exercise, you’ll edit the plot style and see firsthand how plot styles affect your drawing:

1. In the Page Setup dialog box, the filename Mystyle.ctb should appear in the drop-down list of the Plot Style Table (Pen Assignments) group. If it doesn’t, open the drop-down list to select it.
c09i004.tif
2. Click the Edit button to open the Plot Style Table Editor. The Edit button is the one just to the right of the Plot Style Table drop-down list. Click the Form View tab, which is shown at the top of Figure 9-3.

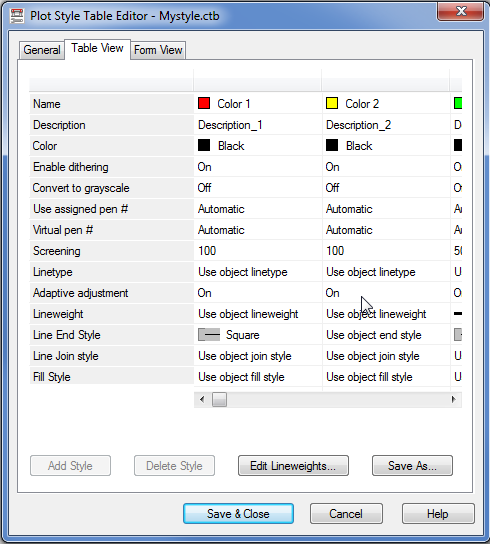
Figure 9-3 The Plot Style Table Editor, open at the Form View tab

c09f003.tif

Editing the Plot Style Tables Directly
You can also open and edit existing plot style tables by clicking the Plotter Manager tool in the Output tab’s Plot panel, which will open the Plotters dialog box. From there, open the Plotter Styles folder; you can then double-click the plot style you want to edit. You can use Windows Explorer to find the plot style tables in C:UsersUser NameAppDataRoamingAutodeskAutoCAD 2014R19.1enuPlottersPlot Styles.

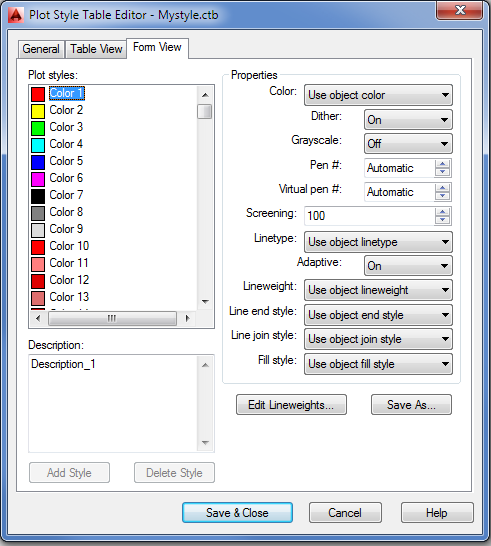
The Plot Style Table Editor has three tabs—General, Table View, and Form View—two of which give you control over how each color in AutoCAD is plotted. The Form View tab lets you select a color from a list box and then set the properties of that color by using the options on the right side of the tab.

The Table View tab displays each color as a column of properties. Each column is called a plot style. The property names are listed in a column to the far left. Although the layout is different, both the Table View tab and the Form View tab offer the same functions.

Now you’ll continue by changing the line width property of the Color 3 (green) plot style. Remember that green is the color assigned to the Wall layer of your Plan drawing.

1. Click Color 3 in the Plot Styles list box.
2. Click the Lineweight drop-down list (see Figure 9-4), and select 0.5000 mm. You may have to scroll down the list to find 0.5000 mm.

Figure 9-4 Set the lineweight.

c09f004.tif
3. Click Save & Close to return to the Page Setup dialog box.
4. Click the Display Plot Styles check box (Figure 9-5) in the Plot Style Table (Pen Assignments) group. Note that this option is not available in Model Space.

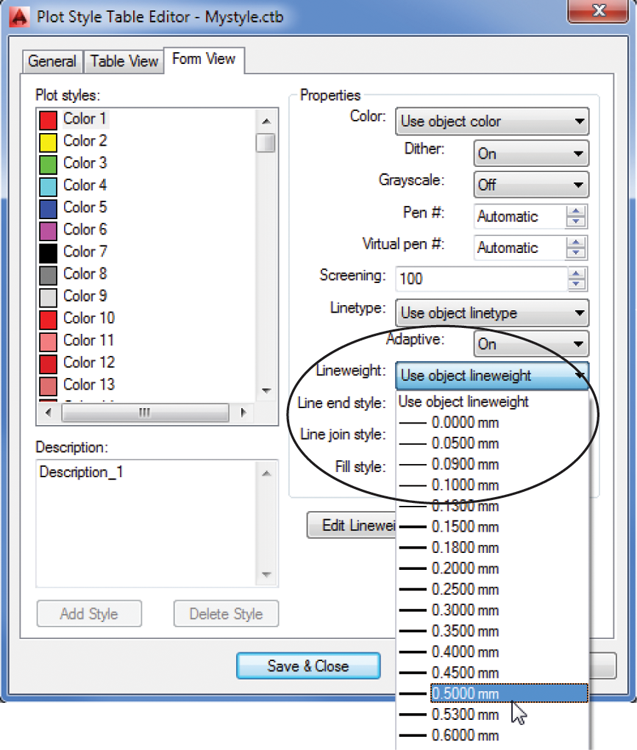
Figure 9-5 Check to display plot styles.

c09f005.tif
5. Click OK to close the Page Setup dialog box, and click Close to close the Page Setup Manager.
6. Zoom in to the plan to enlarge the view of a unit bathroom and entrance, as shown in Figure 9-6.

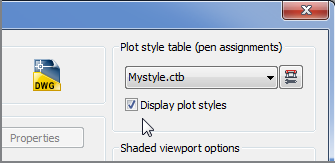
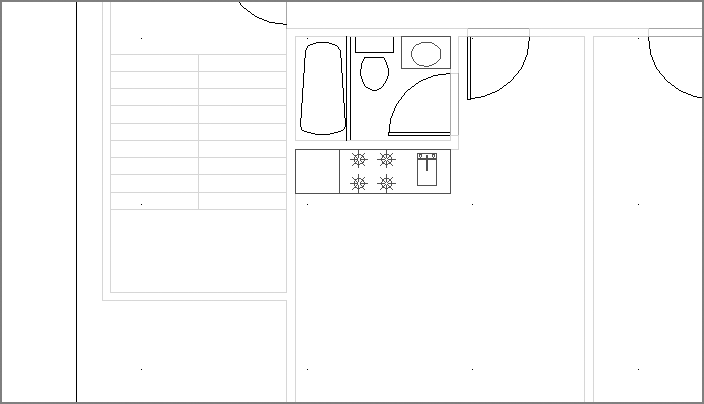
Figure 9-6 Adjust your view to look like this.

c09f006.tif

Making Your Plot Styles Visible

You won’t see any changes in your drawing yet. You need to make one more change to your drawing options:

1. Type LW↵ to open the Lineweight Settings dialog box (see Figure 9-7). You can also click the User Preferences tab in the Options dialog box and then click the Lineweight Settings button to open this dialog box. The Lineweight Settings dialog box lets you control the appearance of lineweights in the drawing. If lineweights aren’t showing up, this is the place to look to make them viewable.

Figure 9-7 Check to show the lineweights.

c09f007.tif
2. Click the Display Lineweight check box to turn on this option.
3. Just below the Display Lineweight option, click the Default drop-down list and select 0.09 mm. This makes any unassigned or default lineweight a very fine line.
4. Click OK. The layout displays the drawing with the lineweight assignments you set up earlier (see Figure 9-8).

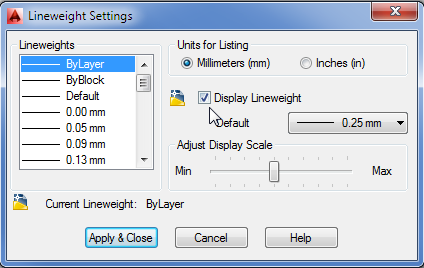
Figure 9-8 The drawing with new lineweight assignments

c09f008.tif

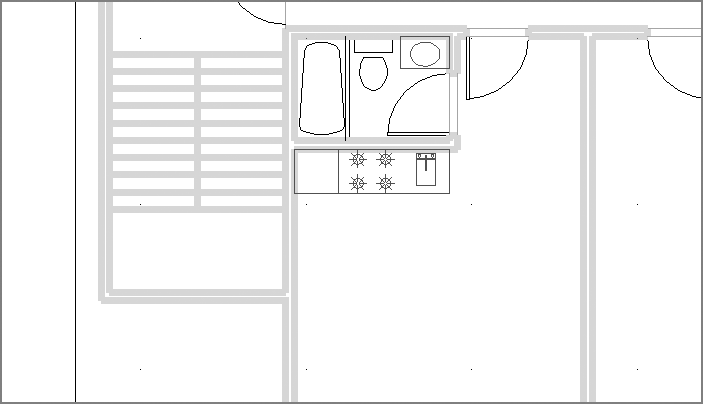
If your view doesn’t reflect the Plot Style settings, make sure you have the Display Plot Styles option selected in the Plot Style Table (Pen Assignments) group of the Page Setup dialog box.

Making Changes to Multiple Plot Styles

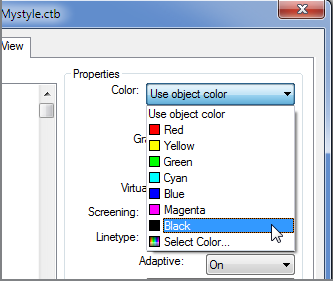
Chances are that you’ll want to plot your drawing in black and white for most of your work. You can edit your color plot style table to plot one or all of your AutoCAD colors as black instead of the AutoCAD colors.

You saw how you can open the Plot Style Table Editor from the Page Setup dialog box to edit your color plot style table. In this exercise, you’ll try a different route:

c09i005.tif
1. Click the Plotter Manager tool in the Output tab’s Plot panel to open the Plotters folder, and then open the Plot Styles folder.
2. Locate the file Mystyle.ctb, and double-click it to open the Plot Style Table Editor.
3. Click the Form View tab.
4. Click Color 3 in the Plot Styles list box.
5. Click the Color drop-down list and select Black (see Figure 9-9).

Figure 9-9 Select Black from the Color drop-down list.

c09f009.tif
6. Click Save & Close, and then close the Plot Styles window.
7. Type rea↵ to view your drawing. The green objects appear black in the Layout tab.
8. Click the Model tab in the lower-left portion of the drawing area or the Quick View Layouts tool in the status bar to view your drawing in Model Space. The objects are still their original colors. This shows that you haven’t changed the colors of your objects or layers; you’ve changed only the color of the plotted output.

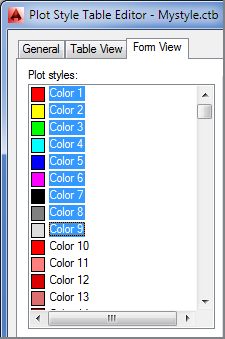
Next, try changing the first nine output colors to black:

1. Repeat steps 1 and 2 of the previous exercise to open the Mystyle.ctb file and the Plot Style Table Editor.
2. Click the Form View tab, and then click Color 1 in the Plot Styles list box.
3. Shift+click Color 9 in the Plot Styles list box to select all the plot styles from Color 1 to Color 9 (see Figure 9-10).

Figure 9-10 Select the colors from 1 to 9.

c09f010.tif
4. Click the Color drop-down list and select Black.
5. Click Save & Close, and close the Plot Styles window.
6. Click the Layout1 tab, and then type rea↵ to regenerate the view. All the colors have changed to black.

Now when you plot your drawing, you’ll get a plot that is composed entirely of black lines.

These exercises have shown that the Plot Style Table Editor lets you set the color of your printed output to be different from the colors you see in Model Space. In the exercises, you set the plot colors to black, but if you look down the Color drop-down list, you’ll see that you can choose from any number of colors. The Select Color option in the Color drop-down list lets you select colors from the Select Color dialog box (see Figure 9-11). To see the view shown in this figure, make sure the True Color tab is selected and the HSL option is selected in the Color Model drop-down list.

Figure 9-11 The Select Color dialog box

c09f011.tif

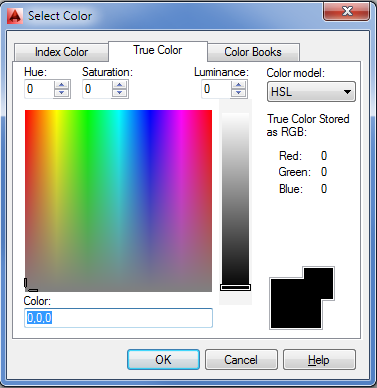
Chapter 5, “Keeping Track of Layers and Blocks,” introduced you to the Select Color dialog box in the context of selecting colors for layers. Here you can use it to assign colors to plot styles. The same three tabs are available: Index Color, True Color, and Color Books. The Index Color tab lets you select from the 255 colors of the standard AutoCAD Color Index (ACI). The True Color tab lets you choose virtually any color you want. The Color Books tab lets you use DIC, RAL, and PANTONE colors.

Setting Up Line Corner Styles

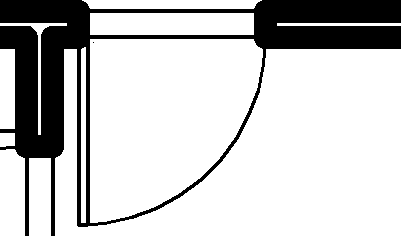
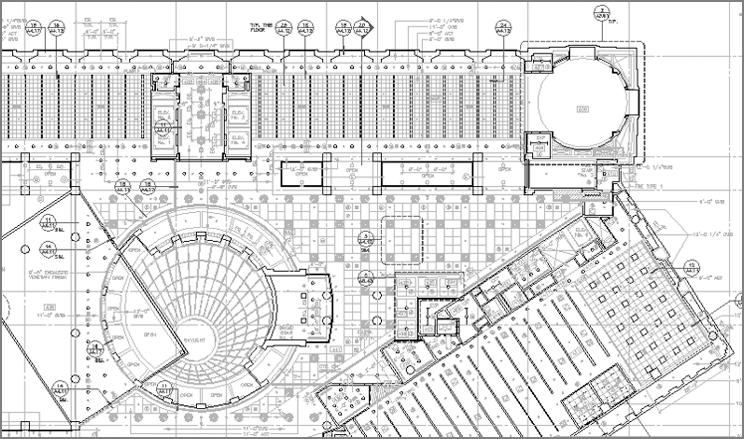
You may notice that the corners of the wall lines appear to be rounded, as shown in Figure 9-12, instead of crisp and sharp.

Figure 9-12 The corners of thick lines may appear rounded.

c09f012.tif

You can adjust the way AutoCAD draws these corners at plot time through the Plot Style Table Editor:

1. Open the Mystyle.ctb plot style table as you did in the previous exercise.
2. Click the Form View tab, and then click Color 3 in the Plot Styles list box.
3. Click the Line End Style drop-down list, and select Square (see Figure 9-13).

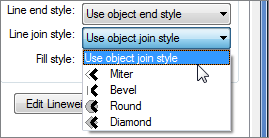
Figure 9-13 Choose square line ends.

c09f013.tif
4. Click Save & Close, and then close the Plot Styles window.
5. Type rea↵ to view your changes. Now the corners meet in a sharp angle, as shown in Figure 9-14.

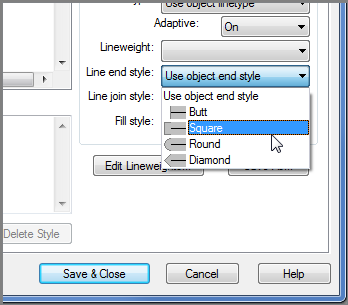
Figure 9-14 The Line End Style setting can alter the way corners are drawn.

c09f014.tif

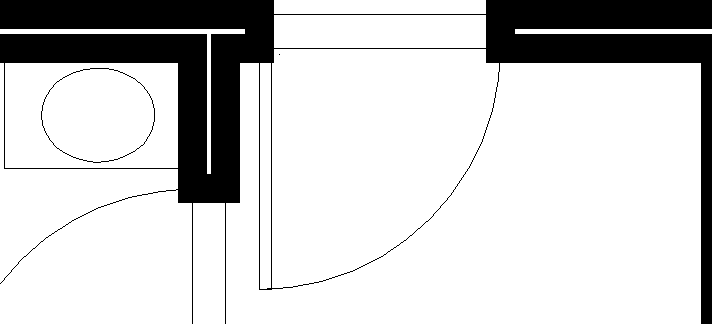
The Square option in the Line End Style drop-down list extends the endpoints of contiguous lines so that endpoints merge in a clean corner instead of a notch. The Line Join Style drop-down list offers similar settings options for polylines. For example, you can round polyline corners by using the Round option in the Line Join Style drop-down list.

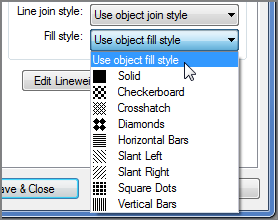
Setting Up Screen Values for Solid Areas

The last option we’ll look at is how to change a color into a screened area. Frequently, you’ll want to add a gray or colored background to an area of your drawing to emphasize that area graphically, as in a focus area on a map or to designate functions on a floor plan. The settings you’re about to use will enable you to create shaded backgrounds:

c09i006.tif
1. Click the Page Setup Manager tool in the Output tab’s Plot panel, and click Modify to open the Page Setup dialog box again.
c09i007.tif
2. Click the Edit tool to open the Plot Style Table Editor.
3. Select Color 3 from the Plot Styles list box.
4. In the Screening list box, click the number 100 to select it (see Figure 9-15).

Figure 9-15 Select the number 100 in the Screening list box.

c09f015.eps
5. Type 50↵.
6. Click OK in the Page Setup dialog box, and click Close in the Page Setup Manager dialog box.
7. Type rea↵. The walls are a shade of gray instead of solid black.

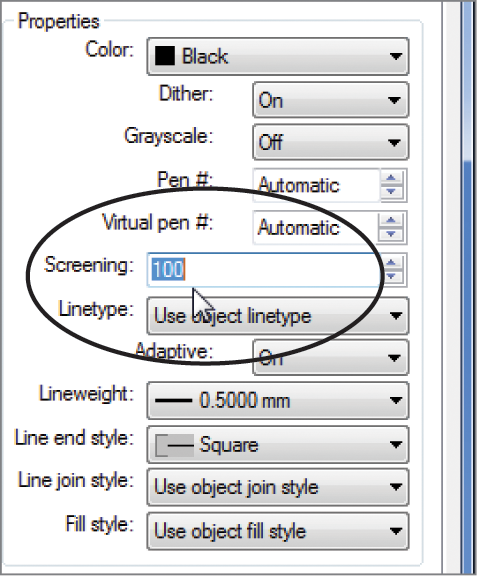
In this exercise, you turned a wide black line into a gray one. The Screening option lets you tone down the chosen color from a solid color to one that has 50 percent of its full intensity.

You can use the Screening option in combination with color to obtain a variety of tones. If you need to cover large areas with color, you can use the Solid hatch pattern to fill those areas and then use the Screening option in the Plot Style Table Editor to make fine adjustments to the area’s color.

Controlling the Visibility of Overlapping Objects

You should also know about the Draworder command in conjunction with solid filled areas. This command lets you control how objects hide or overlap when displayed or plotted. If your solid hatches are hiding text or other graphics, you need to learn about Draworder. See Chapter 14, “Copying Existing Drawings from Other Sources,” for more information. Some output devices offer a Merge Control option that determines how overlapping graphics are plotted. For more information, see Bonus Chapter 3, “Hardware and Software Tips.”

Other Options in the Plot Style Table Editor

You’ve seen a lot of the plot style options so far, but there are many others that you may want to use in the future. The following sections describe those options that weren’t covered in the previous exercises. Be aware that the options in the Plot Style Table Editor are the same regardless of whether you’re editing a color plot style table or a named plot style table.

The General Tab

You may not have really looked at the General tab of the Plot Style Table Editor in the exercise presented earlier. The General tab offers information regarding the plot style you’re currently editing. You can enter a description of the style in the Description box. This description can be useful if you plan to include the plot style with a drawing you’re sending to someone else for plotting.

The File Information group gives you basic information about the file location and name as well as the number of color styles included in the plot style table.

The Apply Global Scale Factor To Non-ISO Linetypes check box lets you specify whether ISO linetype scale factors are applied to all linetypes. When this item is selected, the Scale Factor input box becomes active, enabling you to enter a scale factor. International Organization for Standardization (ISO) linetypes are special linetypes that conform to ISO standards for technical drawings.

The Table View Tab

The Table View tab offers the same settings as the Form View tab, only in a different format. Each plot style is shown as a column, with the properties of the plot style listed along the left side of the tab. To change a property, click it in the column (see Figure 9-16).

Figure 9-16 The Table View tab

c09f016.tif

To apply the same setting to all plot styles at once, right-click a setting you want to use from a single plot style and choose Copy from the context menu. Right-click the setting again, and then choose Apply To All Styles from the context menu.

Click the Edit Lineweights button to open the Edit Lineweights dialog box, which lets you adjust the lineweight settings for the plot styles.

The Form View Tab

You’ve already seen and worked with the Form View tab, shown in Figure 9-3 earlier in this chapter. This tab contains the same settings as the Table View tab but in a different format. Instead of displaying each color as a column of properties, this tab lists the properties as options along the right side, and the colors are listed in a list box.

To modify the properties of a color, you select the color from the list and then edit the values in the Properties group on the right side of the dialog box. For example, to change the screening value of the Color 3 style, you highlight Color 3 in the Plot Styles list, double-click the Screening input box, and enter a new value.

The names of the properties in the Table View tab are slightly different from those in the Form View tab. The Table View property names are enclosed in brackets in this list.

You’ve already seen what the Screening, Color, Lineweight, and Line End Style options do. Here’s a description of the other style properties. The option names are shown as they appear in the Form View tab with equivalent Table View tab names shown in brackets where they differ:

Description This option enables you to enter a description for each color.
Dither [Enable Dithering] Dithering is a method that enables your plotter to simulate more colors beyond the ink colors it has available. Although this option is desirable when you want to create the impression of a wider range of colors in your plots, it can also create distortions, including broken fine lines and false colors, and it disables merge control. For this reason, dithering is usually turned off. This option isn’t available in all plotters.
Grayscale [Convert To Grayscale] This option converts colors to grayscale.
Pen # [Use Assigned Pen #] This option lets you specify which pen number is assigned to each color in your drawing. It applies only to pen plotters.
Virtual Pen # Many inkjet and laser plotters offer “virtual pens” to simulate the processes of the old-style pen plotters. Frequently, such plotters offer as many as 255 virtual pens. Plotters with virtual pens often let you assign AutoCAD colors to a virtual pen number. This is significant if the virtual pens of your plotter can be assigned screening, width, end style, and join styles. You can then use the virtual pen settings instead of using the settings in the Plot Style Table Editor. This option is most beneficial for users who already have a library of drawings that are set up for plotters with virtual pen settings.
You can set up your inkjet or laser printer for virtual pens under the Vector Graphics listing of the Device And Documents Setting tab of the Plotter Configuration Editor. See Bonus Chapter 3 for more on setting up your printer or plotter configuration.
Linetype If you prefer, you can use this setting to control linetypes in AutoCAD based on the color of the object. By default, this option is set to Use Object Linetype. We recommend that you leave this option at its default.

Colors and Lineweights in the San Francisco Main Library
Technical drawings can have a beauty of their own, but they can also be deadly boring. What sets a good technical drawing apart from a poor one is the control of lineweights. Knowing how to vary and control lineweights in both manual and CAD drawings can make a huge difference in the readability of the drawing.
In the San Francisco Main Library project, the designers at SMWM Associates were especially concerned with lineweights in the reflected ceiling plan. The following illustration shows a portion of the reflected ceiling plan from the library drawings:
c09uf001.tif
As you can see, it contains a good deal of graphical information which, without careful lineweight control, could become confusing. (Although you can’t see it in the black-and-white print, a multitude of colors were used to vary the lineweight.) When the electronic drawings were plotted, colors were converted into lines of varying thickness. Bolder lines were used to create emphasis in components such as walls and ceiling openings, and fine lines were used to indicate ceiling tile patterns.
By emphasizing certain lines over others, you avoid visual monotony, and the various components of the drawing can be seen more easily.

Adaptive [Adaptive Adjustment] This option controls how a noncontinuous linetype begins and ends. It’s on by default, which forces a linetype to begin and end with a line segment. With this option turned off, the same linetype is drawn without regard for its ending. In some cases, this can produce a line that appears incomplete.
Line End Style This option lets you specify the shape of the end of simple lines that have a lineweight greater than 0.
Line Join Style This option lets you determine the shape of the corners of polylines.
c09uf002.tif
Fill Style This option lets you set up a color to be drawn as a pattern when used in a solid filled area. The patterns appear as shown in the drop-down list.
c09uf003.tif
Add Style Clicking this button lets you add more plot styles or colors. This option isn’t available for color plot style tables.
Delete Style Clicking this button deletes the selected style. This option isn’t available for color plot style tables.
Save As Clicking this button lets you save the current plot style table with a different filename.

Line Join Style Can Affect Fonts
The Line Join Style setting can have an adverse effect on AutoCAD fonts. If text appears distorted, check to see whether it’s on a layer that uses a line join style other than the default Use Object Join Style setting.

Assigning Named Plot Styles Directly to Layers and Objects

So far, you’ve learned that you can control how AutoCAD translates drawing colors into plotter output. You’ve been using a color plot style table, which assigns a plot style to each color in AutoCAD. You can also assign plot styles directly to objects or layers. To do this, you need to employ a named plot style table. As we said earlier, named plot style tables enable you to create plot styles that have names rather than assign styles directly to colors in AutoCAD. You can then assign a plot style by name to objects or layers in your drawing. In the following sections, you’ll learn how to set up AutoCAD with a named plot style table to assign plot styles to objects; then you’ll create a new plot style table.

Using Named Plot Style Tables

Out of the box, AutoCAD uses the color-dependent plot style table for all new drawings. You can create a new drawing that uses named plot style tables in two ways. The simpler way is to use any of the named plot style template files when you create a new drawing. You’ll see these templates under the Use A Template option in the Create New Drawing dialog box or in the Select Template dialog box (see Figure 9-17).

Figure 9-17 Templates you can choose from

c09f017.tif

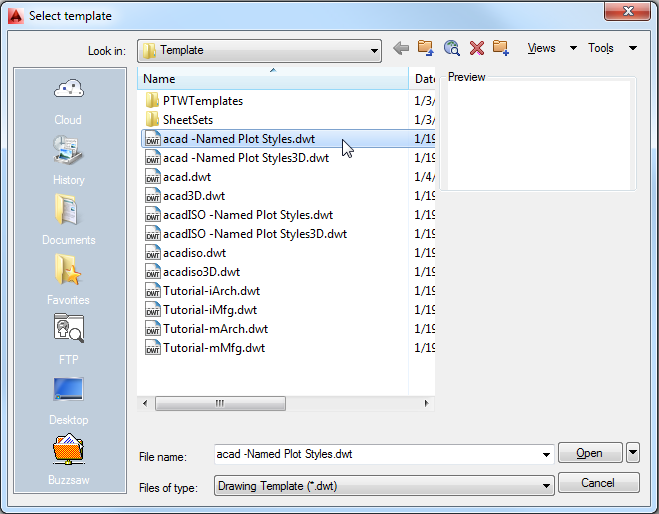
By offering both color and named plot style drawing templates, AutoCAD makes it easy to create and select the type of plot style for your drawing regardless of the current default style.

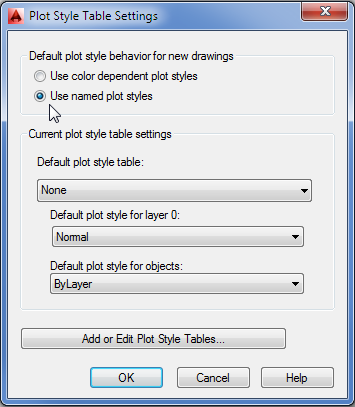
If you prefer, you can set up AutoCAD to use a named plot style by default when you create a drawing by using the Start From Scratch option in the Create New Drawing dialog box. To set up the default plot style table for new drawings, follow these steps:

1. Choose Options from the Application menu to open the Options dialog box, and click the Plot And Publish tab. This tab offers a variety of settings geared toward your plotter or printer.
2. In the lower-right corner of the dialog box, click the Plot Style Table Settings button.
3. In the Plot Style Table Settings dialog box (see Figure 9-18), click the Use Named Plot Styles radio button. Notice that the Default Plot Style For Layer 0 and Default Plot Style For Objects options become available. Click OK.

Figure 9-18 Select the Use Named Plot Styles option.

c09f018.tif
4. Click OK to close the Options dialog box.

To create and try out a new named plot style, you can open an existing file from an earlier version of AutoCAD. In the next few exercises, you’ll use the Plan-named.dwg file. This is a file to which you’ll assign the type of plot style table that is currently the default as determined by the Use Named Plot Styles option you set in the previous exercise. Follow these steps:

1. Open the Plan-named.dwg file.
c09i008.tif
2. Click the Plotter Manager tool in the Output tab’s Plot panel to open a window to the Plotters folder. From there, open the Plot Styles folder.
3. Double-click the Add-A-Plot Style Table Wizard icon to start the Add Plot Style Table Wizard.
4. Click Next to open the Begin screen, choose Start From Scratch, and then click Next to open the Pick Plot Style Table screen.
5. Click the Named Plot Style Table radio button, and then click Next to open the File Name screen.
6. Enter Mynamedstyle1 in the File Name input box, and click Next to open the Finish screen. Here you can exit, or you can edit the new plot style table. This time, you’ll edit the table from the wizard.
7. Click the Plot Style Table Editor button to open the Plot Style Table Editor (see Figure 9-19).

Figure 9-19 The Plot Style Table Editor with only one style named

c09f019.tif

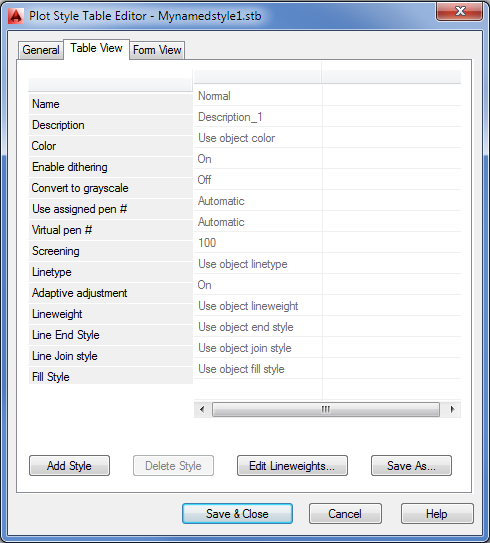
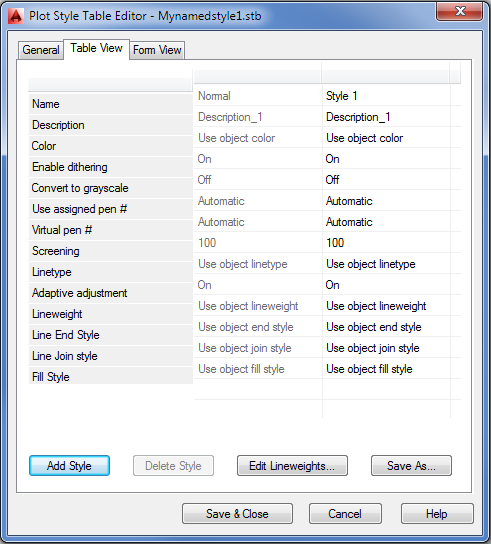
Notice that you have only one style named. Unlike with the color plot style tables, you aren’t assigning a style to each AutoCAD color; you don’t need a style for each of the 255 ACI colors. Instead, you can create a limited set of styles, giving each style the characteristics you want to apply to objects or layers. Continue by adding some plot styles:

1. Click the Add Style button to display a new Style 1 column (see Figure 9-20). If you choose, you can give the style a different name at this point by clicking in the Name box and typing a new name.

Figure 9-20 The Style 1 column appears after you click the Add Style button.

c09f020.tif
2. Click the Form View tab, and then select Style 1 from the Plot Styles list.
3. Click the Lineweight drop-down list, and select 0.5000 mm.
4. Click the Add Style button, and then click OK in the Add Plot Style dialog box.
5. Select Style 2 from the Plot Styles list, and then click the Lineweight drop-down list and select 0.7000 mm.
6. Click Save & Close to return to the Add Plot Style Table Wizard.
7. Click Finish to exit the wizard, and then close the Plot Styles window.

You may have noticed that the Add-A-Plot Style Table Wizard works in a slightly different way when you start it from the Plot Styles window. It adds an extra option (in step 5 of the exercise before the preceding one) that lets you choose between a color plot style table and a named plot style table.

You’ve just created a named plot style. Next, make Mynamedstyle1.stb the default plot style:

1. Open the Options dialog box, and click the Plot And Publish tab.
2. Click the Plot Style Table Settings button. Then, in the Default Plot Style Table drop-down list, select Mynamedstyle1.stb, the table you just created.
3. Click OK to exit the Plot Style Table Settings dialog box, and then click OK again to exit the Options dialog box.

Now you’re ready to start assigning plot styles to the objects in your drawing.

Assigning Plot Styles to Objects

cert.eps

After you’ve set up AutoCAD to use named plot styles, you can begin to assign plot styles to objects through the Properties palette. Here are the steps to assign plot styles to objects:

1. Back in the Plan-named.dwg file, click the Layout1 tab below the drawing area or the Quick View Layouts tool in the status bar.
c09i009.tif
2. Click the Page Setup Manager tool in the Plot panel, and then click the Modify button in the Page Setup Manager.

AutoCAD Wants a Plotter
If your plotter configuration is set up for a nonexistent printer, you’ll see a warning message telling you that a driver for the plotter assigned to this drawing can’t be found. This often occurs when you receive a file that has been set up to plot on a printer in another location. As the warning message explains, AutoCAD has set your plot device to None. You must then make sure your printer or plotter is selected in the Printer/Plotter group of the Page Setup dialog box.

3. In the Page Setup dialog box, select Mynamedstyle1.stb from the drop-down list in the Plot Style Table (Pen Assignments) group.
4. Make sure the Display Plot Styles check box is selected, check that a printer is designated in the Printer/Plotter group, and then click OK.
5. Click Close to close the Page Setup Manager.

You’ve assigned a named plot style table to Layout1. Note that you can assign different named plot styles to different layouts.

Next, make sure the plot styles will be displayed in the drawing:

1. Type LW↵, make sure the Display Lineweight check box is selected, and click OK.
2. Set up your view so that you see a close-up of the lower-left corner unit.
3. Double-click inside the viewport so that the viewport border becomes a bold outline. This enables you to select objects in the drawing while in a Layout view.
4. Select the line representing the outer wall of the unit in the lower-left portion of the plan, as shown in Figure 9-21; then right-click and choose Properties from the context menu.

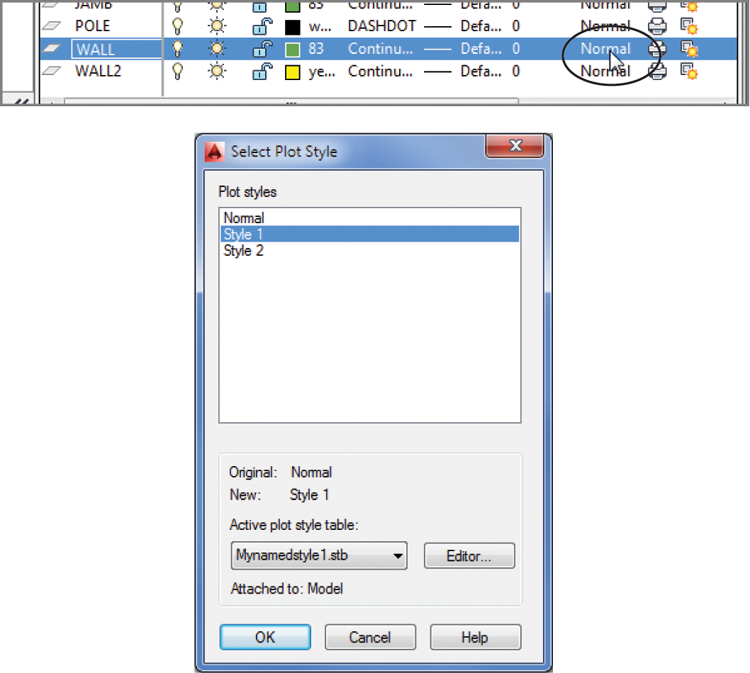
Figure 9-21 Select the line shown here.

c09f021.eps
5. In the Properties palette, click the Plot Style option (see Figure 9-22). The option turns into a drop-down list with a down-pointing arrow to the far right.

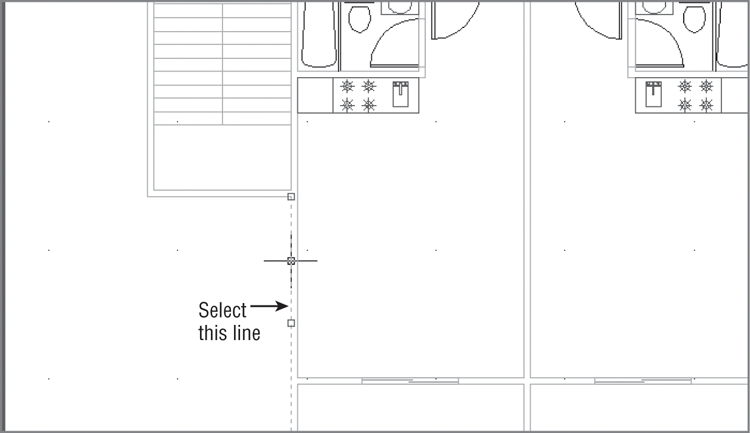
Figure 9-22 Click the Plot Style option to enable the drop-down list.

c09f022.tif
6. Click the down-pointing arrow, and then select Other from the drop-down list to open the Select Plot Style dialog box (see Figure 9-23).

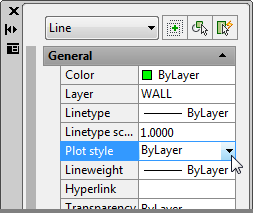
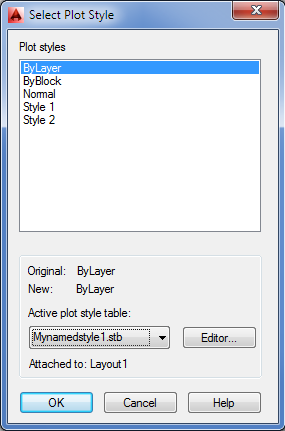
Figure 9-23 The Select Plot Style dialog box

c09f023.tif
7. Select Style 1, and click OK. Style 1 now appears as the value for the plot style in the Properties palette.
8. Close the Properties palette.
9. Type rea↵. If you have the lineweight visibility turned on, you see the results in the drawing editor. (Depending on how your display is set up, you may need to zoom in further.)

Another way to assign plot styles to individual objects is through the Plot Style drop-down list found in the Home tab’s expanded Properties panel. You may need to select Other from the drop-down list to view all the plot styles.

c09uf004.tif

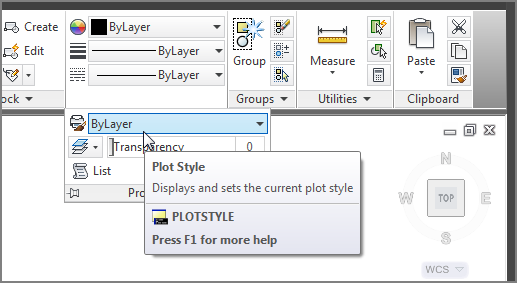
This enables you to select a plot style in a manner similar to how you would use the Layer and Linetype drop-down lists. You can assign plot styles to individual objects by selecting the objects and then selecting a plot style from the Plot Style drop-down list. If you’re using a color plot style table like the one you created in earlier exercises, the Plot Style drop-down list is unavailable.

Assigning Plot Style Tables to Layers

You can also assign named plot style tables to layers. This has an effect similar to using the color plot style tables. The main difference is that with named plot style tables, you assign the plot style tables directly to the layer instead of assigning a plot style to the color of a layer. Here’s how to assign a plot style table to a layer:

c09i010.tif
1. In the Home tab’s Layers panel, click the Layer Properties button to open the Layer Properties Manager dialog box.
2. Select the Wall layer.
3. Click the Normal label in the Plot Style column of the Wall layer listing. You may have to scroll to the right to see the Plot Style column (see Figure 9-24). The Select Plot Style dialog box opens.
4. Select Style 1 from the Plot Styles list.
5. Click OK. You return to the Layer Properties Manager. This time, it shows the Plot Style property for the Wall layer listed as Style 1.
6. Close the Layer Properties Manager dialog box, and then type rea↵. Your view of the plan changes to reflect the new plot style assignment to the Wall layer.

Figure 9-24 Assigning a plot style to a layer

c09f024.eps

Converting a Drawing from Color Plot Styles to Named Plot Styles
If you need to convert a color plot style drawing to a named plot style drawing, you can use the Convertctb and Convertpstyles commands. The conversion is a two-part process. In the first stage, which is needed only the first time you perform the conversion, you convert a color plot style table file into a named plot style table file. Then you convert the drawing file.
Here are the steps for the first part of the process:
1. Start AutoCAD and, at the Command prompt, enter Convertctb↵. This command lets you convert a color plot style table file into a named plot style table file. A Select File dialog box opens to enable you to select a color plot style table file; these files have the filename extension .ctb. For this example, choose the acad.ctb file.
2. Click Open to open the Create File dialog box, where you can provide a name for the converted file. If you opened the acad.ctb file in step 1, you may want to give the new file the name AcadConvert so you know it’s a converted CTB file. AutoCAD automatically adds the .stb filename extension.
3. After you click Save, AutoCAD creates a new named plot style table file, with the .stb filename extension from the CTB file you selected in step 1.
4. You see a message box telling you that the STB file was created successfully. Click OK to dismiss the message.
The next part is to convert the drawing file:
1. Open the file you want to convert, and enter Convertpstyles↵ at the Command prompt. You’ll see a warning message to make sure you’ve converted a CTB file to an STB file.
2. Click OK to open the Select File dialog box.
3. Select the converted STB file you created using the Convertctb command. The current drawing is converted to use a named plot style table.
In the process shown here, we’ve suggested converting the acad.ctb file, but if you’ve saved some custom settings in another CTB file, you may want to convert your custom CTB file instead.
To convert a drawing that uses a named plot style table to one that uses a color plot style table, open the file in question and use the Convertpstyles command. You’ll see a warning message telling you that all the named plot styles will be removed from the drawing. Click OK to convert the drawing.

The Bottom Line

Choose between color-dependent and named plot style tables. Plot styles let you control the way lines are printed on paper. You can control lineweights, shading of filled areas, corner treatment of thick lines, and more.
Master It Describe some of the differences between named plot styles and color-dependent plot styles.
Create a color plot style table. Both color and named plot styles are stored as files. You can create custom plot styles and apply them to any drawing.
Master It How do you select and edit plot styles?
Edit and use plot style tables. Plot styles give you a lot of control over the appearance of lines in your plotted output.
Master It Name some of the settings offered in the Plot Style Table Editor.
Assign named plot styles directly to layers and objects. Named plot styles offer a bit more control over the way lines are plotted. If you choose, you can assign named plot styles to objects, bypassing layer assignments.
Master It Describe a method for assigning a plot style to an object.
..................Content has been hidden....................

You can't read the all page of ebook, please click here login for view all page.
Reset
18.117.76.204