Chapter 11

Using Fields and Tables

Adding text to a set of drawings can become a large part of your work. You’ll find that you’re editing notes and labels almost as frequently as you’re editing the graphics in your drawings. To make some of those editing tasks easier, the AutoCAD® 2014 software provides a few special text objects.

In this chapter, we’ll look at fields and tables, two features that can help automate some of the most common tasks in AutoCAD.

Fields are a special type of text object that can automatically update to reflect changes in the drawing. The Table feature is a tool that helps automate the process of creating and editing tables and schedules. Tables are a common part of technical drawings and are similar to spreadsheets. In fact, AutoCAD tables behave much like spreadsheets, giving you the ability to add formulas to cells.

We’ll start this chapter with an introduction to fields and then go on to explore tables. Toward the end, we’ll revisit fields to see how they can be used to add formulas to tables.

In this chapter, you will learn to:

  • Use fields to associate text with drawing properties
  • Add tables to your drawing
  • Edit the table line work
  • Add formulas to cells
  • Import and export tables
  • Create table styles

Using Fields to Associate Text with Drawing Properties

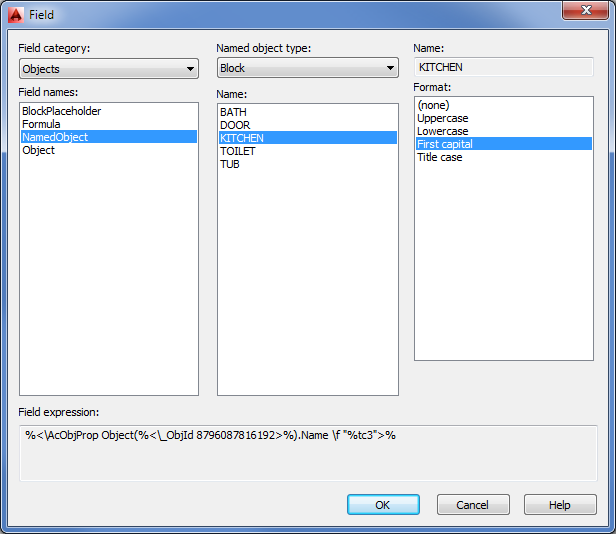
The text labels you worked with in Chapter 10, “Adding Text to Drawings,” are static and don’t change unless you edit them by using the tools described in that chapter. Another type of text object, called a field, behaves in a more dynamic way than the multiline text. A field can be linked to the properties of other objects so that it updates itself automatically as the associated properties change. For example, you can create a field that is associated with a block name. If the block name changes, the field text automatically changes as well.

Try the following exercise to see how this works:

1. Open the 11c-unit.dwg file. This file is similar to the drawing you worked on in Chapter 10.
2. Double-click the Kitchen text to highlight it and make it available for editing.
3. Right-click the highlighted Kitchen text, and then choose Insert Field to open the Field dialog box (see Figure 11-1). A list to the left shows the types of fields available.

Figure 11-1 Choose the field you want to insert.

c11f001.tif
4. In the Field Category drop-down list, select Objects. This limits the display of field types to object fields.
5. In the Field Names list, select NamedObject.
6. Make sure that Block is selected in the Named Object Type drop-down list in the top of the dialog box, and then select KITCHEN from the Name list. This associates the field with the KITCHEN block name.
7. In the Format list to the far right, select First Capital. This causes the field text to be lowercase with a capital first letter (also referred to as sentence case), regardless of how the block name is spelled.
8. Click OK to exit the Field dialog box, and then press ↵ twice to return to the Command prompt.

When you return to the drawing, the text appears in a gray background. This tells you that the text is a field rather than an Mtext or text object. The gray background is a device to help you keep track of field text; it doesn’t plot.

You’ve converted existing text into a field that is linked to a block name. Now let’s see how the field works:

1. Enter Rename↵ at the Command prompt to open the Rename dialog box.
2. Make sure Blocks is selected in the Named Objects list, and then select KITCHEN from the Items list. The word KITCHEN appears in the Old Name box near the bottom of the dialog box.
3. Enter Kitchenette in the box just below the Old Name box, and then click the Rename To button.
4. Click OK to close the Rename dialog box.
5. Type Re↵. The field you created changes to reflect the new block name.

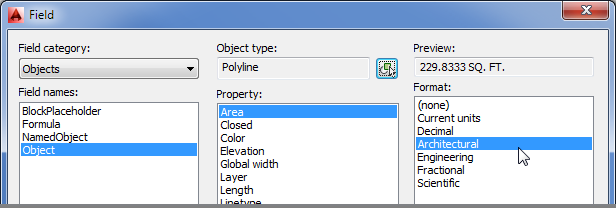
Fields can be associated with a wide variety of properties. You’ve just seen how a block name can be associated with a field. In this exercise, you’ll use a field to display the area of an object:

1. Click Zoom Extents from the Zoom flyout on the Navigation bar or type ZE↵ to view the entire plan.
2. Use the Rectangle command to place a rectangle in the living room area, as shown in Figure 11-2.

Figure 11-2 Place a rectangle that fills the living room.

c11f002.eps
3. Double-click the Living Room text to open the Text Editor tab and the text editor.
4. Highlight the text that reads 230 square feet. Right-click the selected text, and choose Insert Field from the context menu.
5. In the Field dialog box, select Object from the Field Names list.
c11i001.tif
6. Click the Select Object button next to the Object Type box at the top of the Field dialog box (see Figure 11-3). The Field dialog box momentarily closes to enable you to select an object.

Figure 11-3 Click the Select Object button.

c11f003.tif
7. Select the rectangle you just added. The Field dialog box returns.
8. In the Property list just below the Object Type box, select Area.
9. Select Architectural from the Format list to the far right (see Figure 11-4).

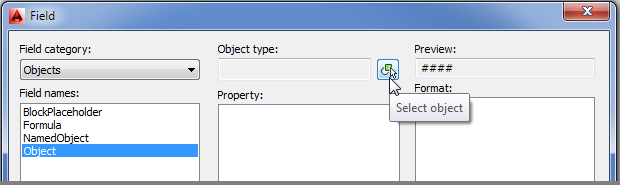
Figure 11-4 The Architectural option in the Format list

c11f004.tif
10. Click OK. The field you just added appears in the drawing as the area of the rectangle.
11. Click Close Text Editor in the Text Editor tab’s Close panel.

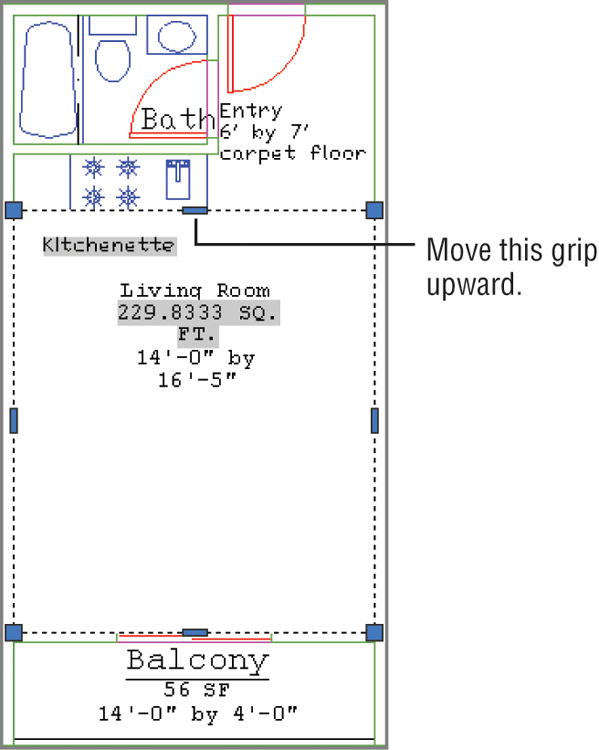
Next, you’ll alter the rectangle to see how it affects the field:

1. Click the rectangle to expose its grips (see Figure 11-5). Then select the top-middle grip of the rectangle, and move it upward so that the top edge aligns with the bathroom wall.

Figure 11-5 Expose the grips.

c11f005.eps
2. Type Re↵. The field you just added updates to reflect the new area of the rectangle.
3. After reviewing the results, close 11c-unit.dwg without saving it.

In previous exercises, you changed existing text into fields. You can create new fields in either the Text or the Mtext command by selecting Insert Field from the context menu whenever you’re typing the text content.

In this exercise, you used a rectangle, but you can use any closed polyline to create an area field.

We’ve touched on just two of the many possible uses for fields. You can associate other types of properties, including the current layer, the drawing name, linetypes, and more. You can include Diesel macros as part of fields. (You’ll learn about Diesel macros in Chapter 26, “Customizing Toolbars, Menus, Linetypes, and Hatch Patterns.”) Fields can also be used in the Table feature (described in the next section), which enables you to create tables and schedules quickly. Fields are used to coordinate sheet labels with reference symbols in the AutoCAD Sheet Set feature described in Chapter 28, “Keeping a Project Organized with Sheet Sets.”

For most of your projects, the standard text objects will work just fine, but you may find fields useful when you know a label has to be associated with specific types of data in your drawing. In later chapters, you’ll have more opportunities to work with fields.

Adding Tables to Your Drawing

One of the most common text-related tasks you’ll do for your drawings is create schedules, such as door and window schedules or parts schedules. Such schedules are tables used to provide detailed information about the elements in your design.

In the past, AutoCAD users used Mtext or Text to create the content of schedules and then used line-drawing tools to create the cells of the schedule. Since AutoCAD 2006, you have been able to use tables to help you generate schedules more quickly. Tables allow you to format the columns and rows of text automatically, similar to formatting in spreadsheet programs.

Creating a Table

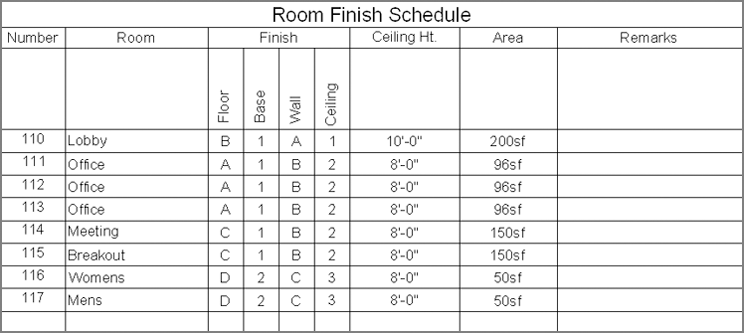
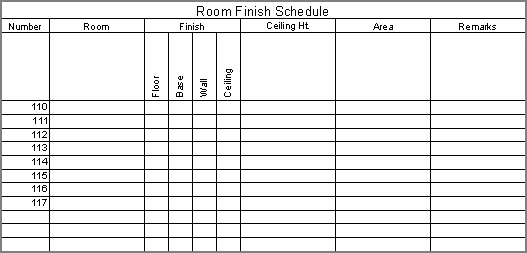
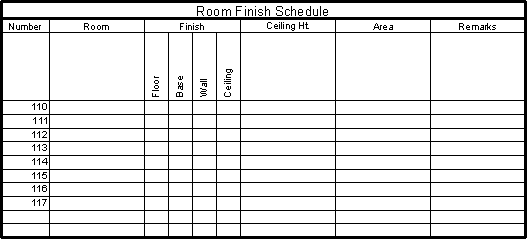
The first step in creating a table is to determine the number of rows and columns you want. Don’t worry if you aren’t certain of the exact number of rows and columns; you can add or subtract them at any time. In this exercise, you’ll create a table that contains 12 rows and 9 columns, as shown in Figure 11-6.

Figure 11-6 A sample table created with the Table tool

c11f006.tif

Start by creating the basic table layout:

c11i002.tif
1. Click New on the Quick Access toolbar, and use the standard acad.dwt drawing template.
c11i003.tif
2. Click Table in the Home tab’s Annotation panel to open the Insert Table dialog box (see Figure 11-7). You can also click the Table tool in the Annotate tab’s Tables panel or type Tb↵.

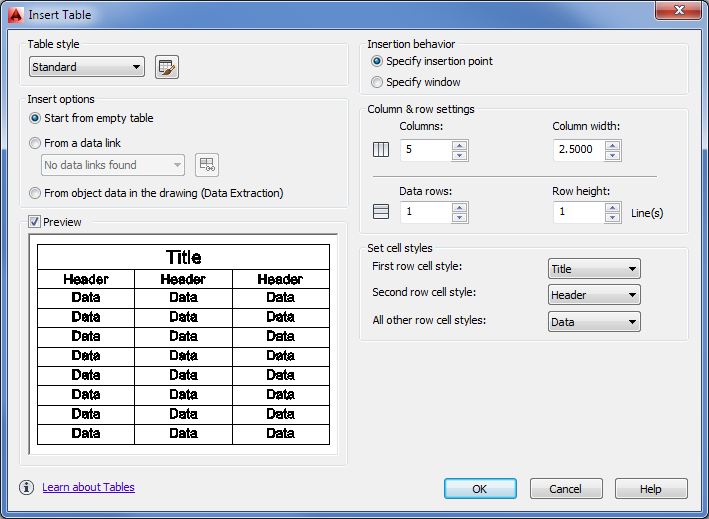
Figure 11-7 The Insert Table dialog box

c11f007.tif
3. In the Column & Row Settings group, enter 9 for Columns and 12 for Data Rows.
4. Click OK. The dialog box closes and the outline of a table follows your cursor.
5. Position the table in the center of your drawing area, and click to place it. The table appears with a cursor in the top cell. You also see the Text Editor tab in the Ribbon.
6. Enter Room Finish Schedule, and press ↵. The cursor moves to the next cell.
7. Click Close Text Editor in the Text Editor tab’s Close panel.

Adding Cell Text

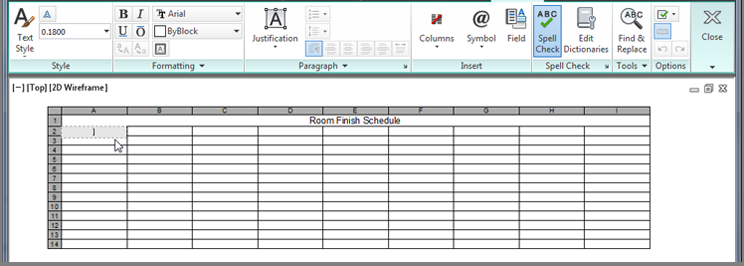
You’ve just created a table and added a title. Notice that the table actually contains 14 rows, including the title row at the top and an additional row for the headings of each column. You can delete these additional rows if you don’t need them, but for now you’ll start to add some text to the table:

1. Adjust your view so the table fills most of the drawing area.
2. Double-click in the first cell at the top left, just below the Room Finish Schedule label (see Figure 11-8). The cell turns gray, and the Text Editor tab appears in the Ribbon. You also see labels across the top and left side showing the row and column addresses.

Figure 11-8 Double-click the first cell shown here.

c11f008.tif
3. Enter Number for the room number column at the far left, and then press the Tab key to advance to the next cell to the right.
4. Enter Room, and press the Tab key again.
5. Enter Finish, and press the Tab key four times to advance four columns. You do this because the Finish heading shown in Figure 11-6 has four columns under it: Floor, Base, Wall, and Ceiling. In the next exercise, you’ll learn how to format those four columns under the single heading.
6. Enter Ceiling Ht. and press the Tab key again.
7. Enter Area, press the Tab key, and enter Remarks.
8. Click Close Text Editor in the Text Editor tab’s Close panel.

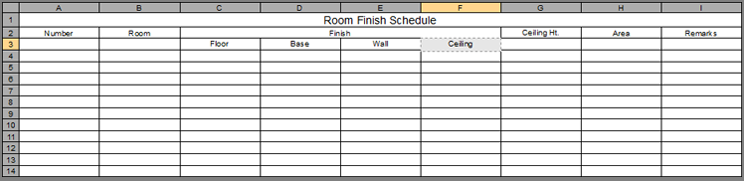
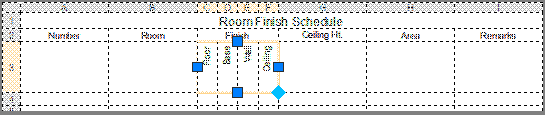
You have the column headings in place. Now you need to do a little extra formatting. In step 5, you left three cells blank because four of the columns will be combined under one heading: the Finish heading covers the Floor, Base, Wall, and Ceiling columns. Next, you’ll combine the blank cells with the Finish heading:

1. Click in the center of the cell with the Finish label to select it.
2. Shift+click in the third cell to the right of the Finish cell to select all four cells (see Figure 11-9).

Figure 11-9 Select a group of four cells.

c11f009.tif
3. Right-click in the selected cells, and choose Merge ⇒ All. The four selected cells merge into a single cell with the word Finish.

Now you need to add the subheads under the Finish header:

1. Double-click in the leftmost cell below the Finish cell. The Text Editor tab appears in the Ribbon (see Figure 11-10).

Figure 11-10 Double-click this cell and the Text Editor tab appears.

c11f010.eps
2. Enter Floor, and press the Tab key.
3. Enter Base, Wall, and Ceiling in each of the following columns as you’ve been doing. Remember that the Tab key advances you to the next cell to the right. Your table should look like Figure 11-11.

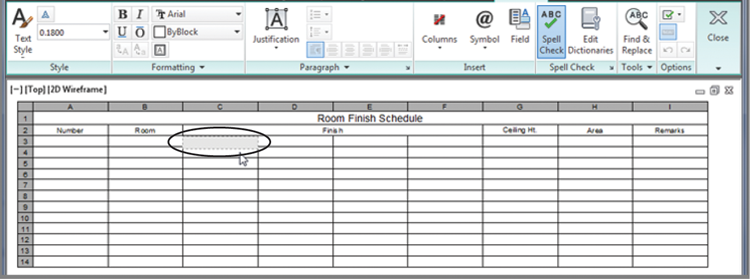
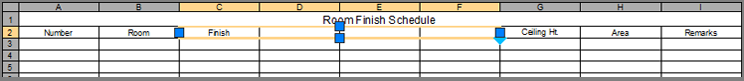
Figure 11-11 The table so far

c11f011.tif
4. Click Close Text Editor in the Text Editor tab’s Close panel.

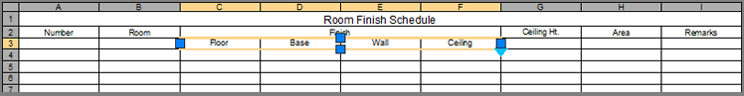
Adjusting Table Text Orientation and Location

You now have the basic layout of the table, with one difference: The Floor, Base, Wall, and Ceiling labels you just added are oriented horizontally, but you want them oriented vertically, as shown in Figure 11-6. The following steps will show you how to rotate a set of labels in a table so they appear in the orientation you want:

1. Click in the cell labeled Floor to select it. The Table Cell tab appears in the Ribbon.
2. Shift+click in the cell labeled Ceiling to select all four of the cells below the Finish heading. The combined cells have four grips, one on each side of the group.
c11uf001.tif
3. Click the grip at the bottom of the selected group, and move it down about four rows. Click to “fix” the row height in place. The entire row becomes taller. This provides room for the text when you rotate it.
4. Right-click in the selected cells, and choose Properties from the context menu to open the Properties palette.
5. In the Properties palette, click the Text Rotation box under the Content group.
c11uf002.tif
6. Enter 90↵ for a 90-degree rotation of the text. The text rotates into a vertical orientation.
7. Close the Properties palette.
With the text in this orientation, the columns are too wide, so you’ll change the cell width for the selected cells.
8. Move the right grip to the left to decrease the width of the cells.
c11uf003.tif
9. For the final touch, you’ll center the text in the cells. With the cells still selected, right-click in the selected cells, and choose Alignment ⇒ Bottom Center. The text becomes centered in the cells and aligned at the bottom of the cells.
c11uf004.tif

Setting Margins with the Properties Palette
You can also control the margin between the text and the cell border by using the Cell Margin options in the Properties palette. Select a group of cells in the table, right-click, and choose Properties. In the Properties palette, click the Vertical Cell Margin option or the Horizontal Cell Margin option in the Cell group.

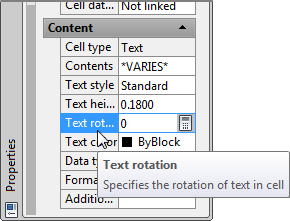
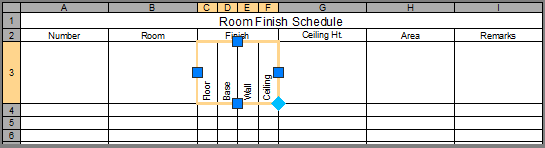
In the previous exercise, you learned how you could adjust the text orientation through the Properties palette. You can also adjust the width of cells through the Properties palette. Or if you prefer, you can adjust the width of multiple cells by adjusting the grip location of selected cells.

Now continue to add text to the cells and adjust their sizes:

1. Double-click in the cell in the Number column just below the row that contains the Floor, Base, Wall, and Ceiling cells. A text cursor appears in the cell, and the Text Editor tab appears in the Ribbon.
2. Enter 110, and press ↵. Instead of advancing to the next cell to the right, you advance to the next cell below.
3. Enter 111, and press ↵ again. Continue to enter each room number in this way until you reach room number 117. When you’ve finished entering the room numbers, click Close Text Editor in the Text Editor tab’s Close panel.
Next, you’ll reduce the width of the column to fit the text a bit better.
4. Click in the cell with the Number text label. It’s the first column heading in the table.
5. Shift+click in the bottom cell of the Number column to select the entire column.
6. Click the grip to the left of the column, and move the grip to the right so that the column width is approximately half the width of the Room column. You can zoom in on the column to allow more control over the positioning of the grip.
7. Press Esc to exit the selection and view your table so far (see Figure 11-12).

Figure 11-12 The table with the columns resized

c11f012.tif

Now, suppose you want to delete one of the extra rows of cells at the bottom of the table or add a new row. Here’s how:

1. Click the bottom-left cell of the table to select it.
2. Right-click, and choose Rows ⇒ Delete from the context menu. The row disappears.
3. To add a row, select a cell, right-click, and choose Rows ⇒ Insert Above or Rows ⇒ Insert Below, depending on where you want the new row. (You don’t have to do this last step.)

You may notice the Delete Columns and Insert Columns options in the context menu that let you add or delete columns. These options function in a way that’s similar to how the Delete Rows and Insert Rows options function. You can also use the tools in the Rows and Columns panels of the contextual Table Cell tab to insert and delete rows and columns.

Editing the Table Line Work

So far, you’ve concentrated on how you can format text and cells in a table, but you’ll also want some control over the lines in the table. Typically, heavier lines are used around the border of the table and between the title and the rest of the table.

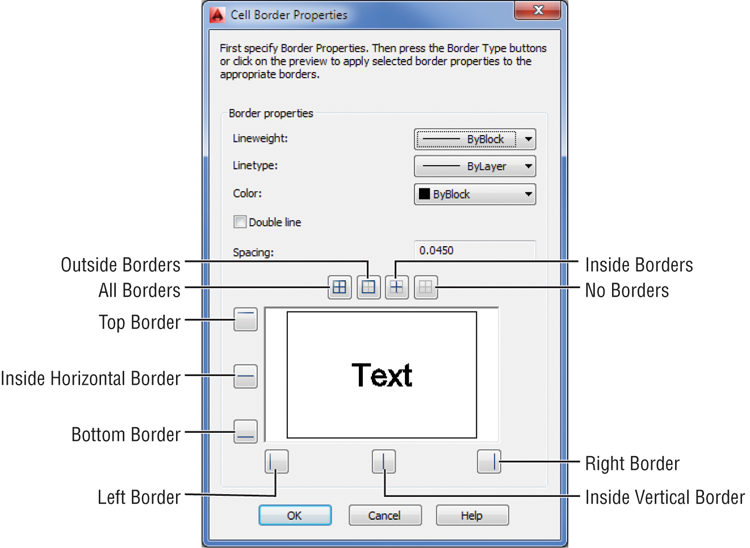
Selecting a cell, right-clicking, and selecting Borders from the context menu option lets you modify the outline of the border. When you select this option, the Cell Border Properties dialog box opens (see Figure 11-13).

Figure 11-13 Setting border properties

c11f013.tif

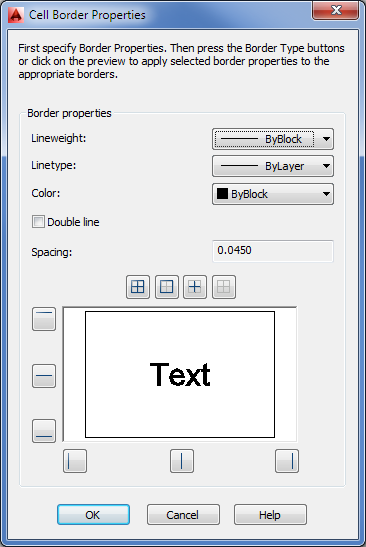
You can use this dialog box to fine-tune the appearance of the line work of the table. Try the following exercise to see firsthand how this dialog box works:

1. Make sure you do not have a cell selected, and then turn on the display of lineweights by typing LW↵.
2. In the Lineweight Settings dialog box, turn on the Display Lineweight setting and then click OK.
3. Click in the title cell at the top of the table to select the cell, and then right-click and choose Borders to open the Cell Border Properties dialog box.
4. Click the Lineweight drop-down list, and select 0.30 mm.
5. Click the Outside Borders button that appears just above the preview panel to tell AutoCAD to change the borders of the cell to the selected lineweight (see Figure 11-14).

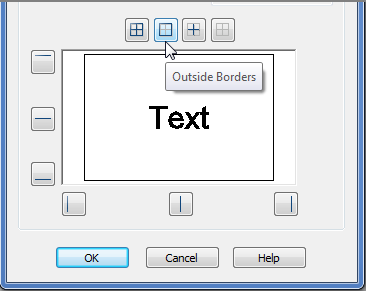
Figure 11-14 Click to display outside borders.

c11f014.tif
6. Click OK. The title cell is now outlined in a heavier line. To see it clearly, press the Esc key.

You can also adjust the lineweights of the borders that encircle a group of cells, as demonstrated in the following exercise:

1. Click the cell in the upper-left corner with the Number label.
2. Shift+click the cell in the lower-right corner of the table so that all the cells from the second-from-the-top row down are selected.
3. Right-click and choose Borders.
4. Select 0.30 mm from the Lineweight drop-down list. Then click the Outside Borders button as you did in step 5 of the previous exercise.
5. Click OK. The outlines of the selected cells are given the new lineweight setting (see Figure 11-15).
6. Save this file for future reference.

Figure 11-15 The borders updated

c11f015.tif

Changing the Background Color
In addition to the table borders, you can change the background color for the cells of the table using the Table Cell Background Color drop-down list in the Cell Styles panel of the contextual Table Cell tab. You can also use the Background Fill option in the Properties palette to set cell background colors.

The Cell Border Properties dialog box also lets you set the line colors by selecting a color from the Color drop-down list before selecting an Apply To option. In addition, there are several other buttons around the preview panel (see Figure 11-16) that let you select the lines that are affected by the Cell Border Properties settings.

Figure 11-16 Setting which borders will be affected

c11f016.eps

You can also use the preview panel to select individual borders by clicking the sample border in the preview panel. The sample changes to show you which border lines are affected.

Adding Formulas to Cells

In the beginning of this chapter, we mentioned that you can include formulas in cells of AutoCAD tables. This can be a great time-saver because you can set up a table with quantities that automatically adjust to changes in values in individual cells. You don’t have to calculate the changes manually.

You may recall that formulas are a type of field and that a field can be linked with objects in a drawing so that the field displays the linked object’s properties. The formula field can be linked to several numeric text values.

Although fields are the tools you use for formulas, you don’t have to choose deliberately to add a field to a cell every time you want to add a formula. The exercise in the following section will demonstrate how you can add a formula by typing directly in a cell. AutoCAD takes care of converting your input into a field.

Using Formulas Directly in Cells

The simplest way to add a formula to a cell is to double-click the cell and then, when the Text Editor tab appears in the Ribbon, enter the formula directly in the cell with the addition of an = (equal sign) at the beginning. Try the following exercise to see how it works:

1. Open the FieldSample.dwg file.
2. Double-click in the cell, as shown in Figure 11-17, to select the location for your formula.

Figure 11-17 Selecting the cell for your formula

c11f017.eps
3. Enter =A2+D4 in the cell to add the values in cell A2 and cell D4.
4. Press ↵ after you enter the formula. The value of A2 plus D4 appears in the cell (see Figure 11-18).

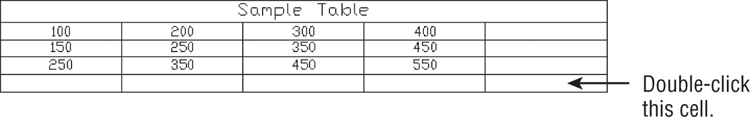
Figure 11-18 The cell with the sum of two other cells

c11f018.eps

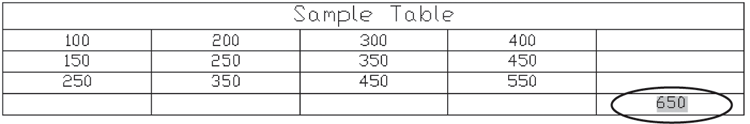
In step 3, the equal sign tells AutoCAD to convert the text into a formula field. You may have noticed that when you start to edit a cell in a table, the row and column labels appear along the top and left side of the table. You can use these labels to determine the cell addresses for your formula.

In typical spreadsheet fashion, you can change the formula in a cell at any time. Double-click the cell containing the formula, and then edit the formula values and operators.

You can also use the Formula drop-down list from the Table Cell tab’s Insert panel to select from a set of predefined math operations (see Figure 11-19).

Figure 11-19 The Formula drop-down list in the Insert panel

c11f019.tif

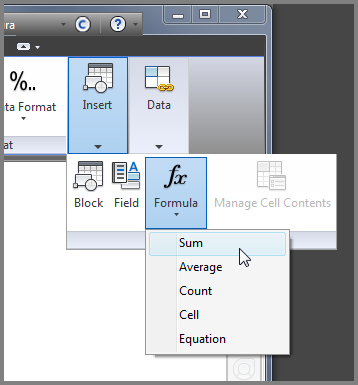
Click in the cell where you want to place the formula; then, in the Table Cell tab, click the Formula drop-down list in the Insert panel and select the operation you want to use. Next, place a selection window around the cells you want to include in the formula. Click in the first cell that you want to include in the formula, and then click in the second cell. As you do this, a selection window appears. All the cells that are included in the selection window are included in the formula.

Using Other Math Operations

In the previous exercise, you used the plus sign to add the value of two cells. You can string together several cells’ addresses to add multiple cells, as follows:

=A2+A3+A4...

You can also subtract, multiply, or divide by using the – (subtract or minus), * (multiply or asterisk), or / (divide) signs. To perform multiple operations on several cells, you can group operations within parentheses in a way similar to how you would in a typical spreadsheet formula. For example, if you want to add two cells together and then multiply their sum by another cell, use the following format:

=(A2+A3)*A4

The Average, Sum, and Count buttons that appear in the Formula flyout on the Table Cell tab’s Insert panel give you quick access to these frequently used functions. You can add to a cell the average value of a set of cells, the sum of a set of cells, or the count of the number of cells. When you click one of these options after selecting a cell, you’re prompted to select several cells with a selection window. Once you’ve selected a set of cells, you see the appropriate formula in the currently selected cell. Clicking the Average button, for example, produces a formula similar to the following:

=Average(A1:B5)

Clicking the Sum button produces a formula like the following:

=Sum(A1:B5)

In both cases, a range of cells is indicated by a colon, as in A1:B5. You can use this format when entering formulas manually. You can also include a single cell with a range by using a comma:

=Sum(A1:B5,C6)

Importing and Exporting Tables

Data of the kind found in tables is often shared with others who may not be AutoCAD users. For this reason, you’ll want to be able to move table data to and from your drawing to other applications so that it can be viewed and edited by others. AutoCAD offers the following methods for importing and exporting tables.

Importing a Table

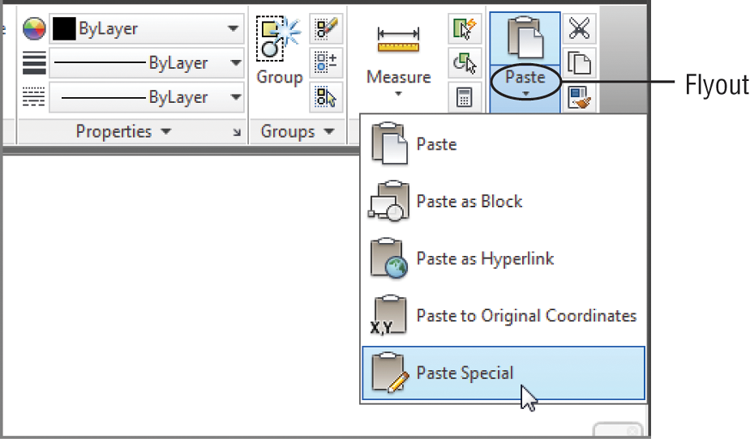
Frequently, tables are created outside AutoCAD in a spreadsheet program such as Microsoft Excel. You can import an Excel worksheet as an AutoCAD table by using the AutoCAD Entities option in the Paste Special feature. The ability to import tables lets non-AutoCAD users create the table data while you concentrate on the drawing.

Try the following exercise to see how you can import a table from a worksheet:

1. Open the Excel worksheet called 11a-plan.xls, and highlight the door data, as shown in Figure 11-20. You may see a security message in Excel.

Figure 11-20 Selecting the door data in the 11a-plan.xls spreadsheet

c11f020.tif
2. Right-click and select Copy to place a copy of the selected data into the Windows Clipboard, and then switch back to AutoCAD.
3. Choose Paste Special from the Paste flyout on the Home tab’s Clipboard panel (see Figure 11-21) to open the Paste Special dialog box.

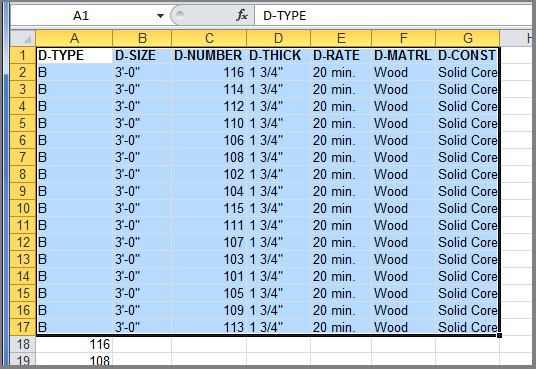
Figure 11-21 The Paste flyout

c11f021.eps
4. With the Paste radio button selected, click AutoCAD Entities in the list and then click OK.
5. At the Specify insertion point or [paste as Text]: prompt, click a point in the lower-right area of the drawing. The worksheet data appears in the drawing as a table.

In this exercise, you imported the worksheet by using the default standard table style. This gives you a simple-looking table using the AutoCAD Txt font. You can set up a custom table style, as described later in this chapter, with the fonts and borders you want and then import the table for a more customized appearance. Make sure your custom table style is the current style before you import the worksheet.

Exporting Tables

You might want to export your AutoCAD table to a spreadsheet program or database. You can do this using a somewhat hidden option in a context menu. Follow these steps:

1. Select the entire table. You can do so by clicking in a spot above and to the right of the table. With the crossing selection window, completely enclose the table and click.
2. Right-click anywhere in the table, and choose Export from the context menu to open the Export Data dialog box.
3. Specify a name and location for your exported table data, and click Save.

The file is saved with a .csv filename extension. This type of file is comma delimited and can be read by most spreadsheet programs, including Excel. Unfortunately, the CSV file doesn’t retain the AutoCAD table formatting.


Adding Graphics to Table Cells
One of the most interesting features of the Table tool is its ability to include blocks in a cell. This ability can be useful if you want to include graphic elements in your table. Adding a block to a cell is a simple process. Here are the steps:
1. Click in a cell to select it.
2. Right-click, and choose Insert ⇒ Block from the context menu to open the Insert A Block In A Table Cell dialog box.
c11uf005.tif
3. Select a block name from the Name drop-down list. You can also click the button to the right of the list to open the Select Drawing File dialog box, which lets you select a drawing file for import to the cell.
4. After you’ve selected a block and specified the settings in the Properties group of the dialog box, click OK. The block appears in the cell you’ve selected.
The dialog box enables you to specify the alignment (Overall cell alignment) and size (Scale) of the inserted block. By default, the AutoFit option is turned on. This option adjusts the size of the block to make it fit in the current cell size.

To open the exported file from Excel, choose File ⇒ Open in the Excel menu bar; then, in the Open dialog box, select Text Files (*.prn, *.txt, *.csv) in the Files Of Type drop-down list. You can then locate the exported table and open it.

Creating Table Styles

If you find that you’re creating the same table layout over and over, you can set up predefined table styles. You can set up the properties of the title, column headings, and data in advance so that you don’t have to set them up each time you create a table. For example, if you prefer to use Arial bold at 0.25″ for the title and standard Arial at 0.125″ for the column headings, you can create a table style with those settings. The next time you need to create a table, you can select your custom table style and specify the number of columns and rows; then you’ll be ready to add the data without having to format the text.

Adding or Modifying a Table Style

The method you use to create a table style in AutoCAD is similar to the method used to modify an existing one.

To create a table style, follow these steps:

c11i004.tif
1. Click Table Style in the Home tab’s expanded Annotation panel to open the Table Style dialog box.
c11i005.tif
You can also select the Table Style tool from the Annotate tab’s Tables panel title bar. The Table Style tool is the arrowhead at the right end of the Tables panel title bar. You see the Standard table style in the Styles list box (see Figure 11-22). This is the one you used in the previous exercises.

Figure 11-22 The Table Style dialog box

c11f022.eps
2. Click the New button to open the Create New Table Style dialog box. This is where you give your new table style a name.
3. Enter My Table Style, and click Continue to open the New Table Style dialog box (see Figure 11-23).

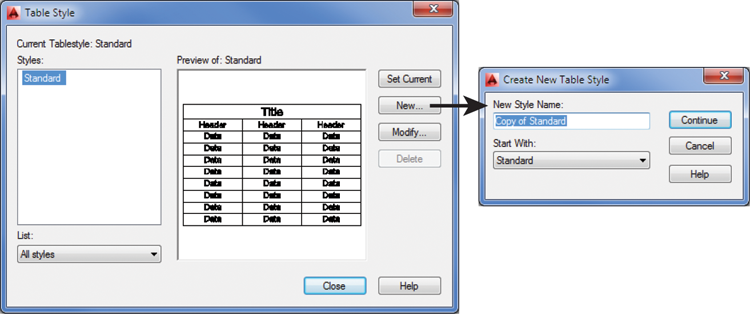
Figure 11-23 The New Table Style dialog box

c11f023.tif
4. You’ll learn more about the options in this dialog box next. For now, click OK to close the dialog box.
5. Your new table style now appears in the Styles list of the Table Style dialog box. If you want to edit an existing table style, you can select the style from the list and click the Modify button. The Modify Table Style dialog box will appear, enabling you to edit the existing style. The Modify Table Style dialog box is identical to the New Table Style dialog box shown in Figure 11-23.
6. Click Close to exit the dialog box.

After you’ve created a style, you can select it from the Table Style group of the Insert Table dialog box that you used to create the sample table (see Figure 11-24). To open the Insert Table dialog box, click Table in the Home tab’s Annotation panel.

Figure 11-24 Select the table style in the Insert Table dialog box.

c11f024.tif

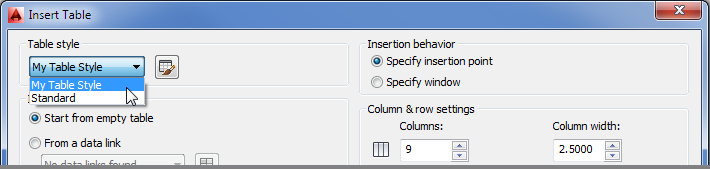
You can also open the New Table Style dialog box by clicking the Launch The Table Style Dialog button just to the right of the Table Style drop-down list in the Insert Table dialog box.

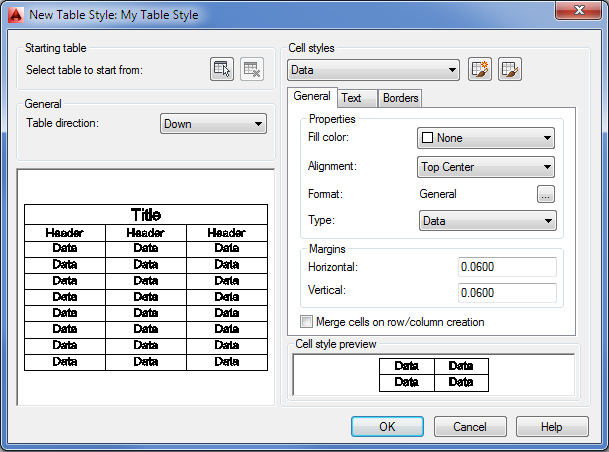
The Table Style Options

Let’s take a closer look at the New Table Style dialog box, shown earlier in Figure 11-23. It may seem a bit bewildering at first, but once you take the time to explore the parts of this dialog box, it’s fairly straightforward. The following offers a description of the parts of the New Table Style dialog box by group:

Starting Table Typically, you can set up a new table style using the settings in the other groups of this dialog box, but the Starting Table group gives you the ability to use an existing table in the drawing as the basis for your new table style. This can be helpful if you’ve already done some work formatting a table in your drawing. This group includes two buttons. The one on the left lets you select an existing table in the drawing for your new style. If you click this button, the dialog box closes temporarily to allow you to select a table in your drawing. The button on the right removes your in-drawing table selection and reverts to the settings in the dialog box.
General The General group offers only one setting: the direction for the table. Typically, you’ll use the Down option, which means the table reads from top to bottom. If for some reason you need a table with titles at the bottom, choose the Up option.
Cell Styles You have a high degree of control over the appearance of individual cells through the cell styles. By default, your new table style will have three cell styles, called Data, Header, and Title. You can select these cell styles from the drop-down list at the top of the Cell Styles group. You can then edit the selected style using the three tabs below the drop-down list. Here are brief descriptions of the function of each tab:
  • General gives you control over the fill color, alignment, format, and type of information presented in the cell. The Margins options control the margins in the cell. The Merge Cells On Row/Column Creation option at the bottom of the General tab causes the cells to merge into a single cell for the selected cell style.
  • Text gives you control over the default text style, the height and color, and the angle of the text in the cell.
  • Borders lets you control the lineweight for the borders of the cell.
You can also create your own cell style using the two buttons to the right of the Cell Styles drop-down list. The left button lets you create a new cell style. The button on the right lets you create, rename, or delete a cell style through the Manage Cell Styles dialog box.
Cell Style Preview This window gives you a preview of what the cell style will look like with the settings you make in the tabs of the Cell Styles group. This preview changes in real time as you change the settings in the General, Text, or Borders tab.

The Bottom Line

Use fields to associate text with drawing properties. Fields are a special type of text object that can be linked to object properties. They can help to automate certain text-related tasks.
Master It Name two uses for fields that you learned about in the first part of this chapter.
Add tables to your drawing. The Tables feature can help you make quick work of schedules and other tabular data that you want to include in a drawing.
Master It What is the name of the dialog box that appears when you click the Table tool in the Annotate tab’s Tables panel?
Edit the table line work. Because tables include line work to delineate their different cells, AutoCAD gives you control over table borders and lines.
Master It How do you get to the Cell Border Properties dialog box?
Add formulas to cells. Tables can also function like a spreadsheet by allowing you to add formulas to cells.
Master It What type of text object lets you add formulas to cells?
Import and export tables. The Table feature allows you to import Microsoft Excel spreadsheets into AutoCAD.
Master It Describe how to import a spreadsheet from Excel into AutoCAD.
Create table styles. Table styles can save time by enabling you to set up preformatted tables with a title, column headings, and other data.
Master It Name the four groups in the New Table Style dialog box.
..................Content has been hidden....................

You can't read the all page of ebook, please click here login for view all page.
Reset
3.142.133.180