
Now that you are comfortable with modeling in a 3D environment, it is time to delve into the often talked about but never fully explained fourth dimension. That's right, the fourth dimension, which refers to the nongraphical side of Revit Structure. Using schedules and quantities allows us to keep track of all of the components that compose our model.
You may ask yourself, or even be asked by someone else, "Why are we using BIM over standard 2D drafting?" We were successful before—why take the risk? The answer, as it pertains to the topic of this chapter, is simple.
The effort expended to model your building begins to be rewarded by the ability to mine the vast amount of data you have created. The fact that in five minutes you can create a comprehensive steel quantity takeoff that is accurate and will adjust to changes in the model is priceless. To take this one step further, typically a firm is going to have predefined schedules and quantity takeoffs in the project before the first beam or column is placed. This means during the life of the project, this information can be viewed or printed literally at the push of a button. Not bad for having to do nothing more than place elements into a model.
In this chapter you will learn to:
Create schedules
Create schedule keys
Create material takeoffs
Export schedules to Microsoft Excel
Create keynote legends
You do not need a "populated" model to create schedules. In fact, schedules can and should be provided in a template. The modeler can then focus on the modeling process while the schedules and quantity takeoffs are being populated behind the scenes.
Most every project will have different requirements for the schedule output data. In many cases, schedules are used to simply keep track of the design. This is possible because in Revit a schedule is a two-way street. Any changes to the model will immediately update the schedule. Any changes in the schedule will immediately update the model. For example, if there was a group of beam sizes you needed to change in a certain area, you could open the schedule, locate the beams, and change them right there in the schedule. This updates not only the schedule you are currently in but also the plans, elevations, and sections. This is typical Revit behavior. If you make a change in one place, other areas of the model are also influenced by the changes.
To follow along with this exercise you can open the Scheduling Basics.rvt file from this book's website. To create a schedule, navigate to the View tab of the Ribbon
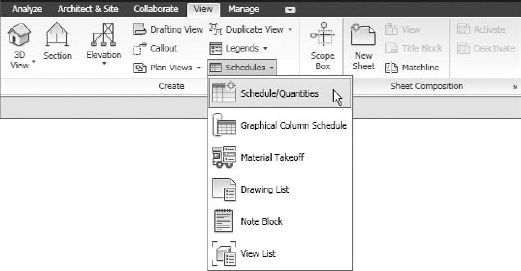
Typically the schedule of choice will be a Schedule/Quantities form of schedule. Other forms are the Graphical Column Schedule, which shows an actual view of project columns in elevation overlaid on a schedule. The Material Takeoff Schedule can quantify and total materials by volume. Finally, you can create schedules populated with a sheet list, project model symbols, and lists of the various views in the model.
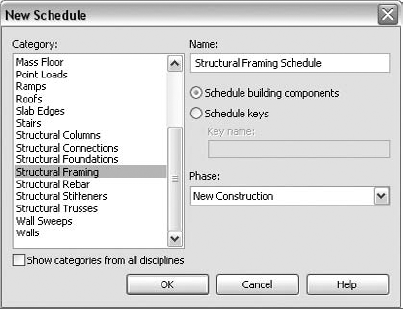
Once you are presented with the New Schedule dialog, it suddenly becomes apparent there is a multitude of category choices.
After you start the Schedule/Quantities command, you will need to make a choice in the Category area of the New Schedule dialog box, as illustrated in Figure 11.2. If, for example, you would like a schedule of all the structural framing elements in the project, you can select Structural Framing from the Category list on the left side of the dialog box. Once you choose a category, click OK.
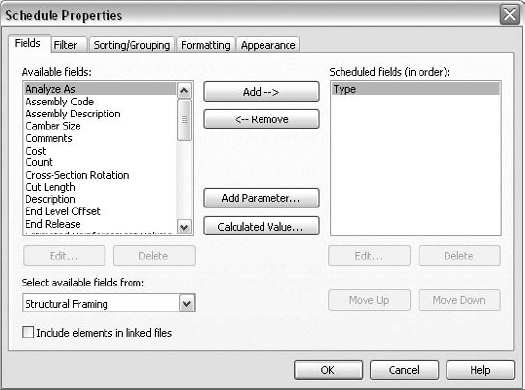
This will bring you to the Schedule Properties dialog box, as illustrated in Figure 11.3. Once this dialog box opens, you will see a series of tabs across the top. The first tab is the Fields tab. It is the default tab when you start a new schedule for good reason. You obviously need to add some fields to tell Revit Structure which parameters to include in the schedule.
At this point, you will probably want to decide whether this schedule is going on the drawing sheets or if it will be just for internal use as the model is being created. The desired result will have an impact on what information needs to be included in the schedule and how it is arranged, among other things. Whatever its purpose, there are five basic groups of options when creating a schedule.
- Fields
This tab determines which parameters (fields) will be added to the schedule and the order in which they will appear. These form the columns of the schedule. You can also create new parameters to store information and make calculations based on other fields in the schedule.
- Filter
This tab determines which model elements will appear in the schedule. Filters can be used to exclude any unwanted elements or to specify which elements are desired in the schedule.
- Sorting/Grouping
This tab determines how the chosen fields will be arranged and grouped.
- Formatting
This tab determines how the data is formatted and the format of any mathematical calculations.
- Appearance
This tab determines how the schedule will look in terms of font types and sizes. The border and grid of the schedule are addressed here as well.
These groups are explained in detail in the following sections.
The Fields tab is broken into two columns. The column to the left shows all of the available fields in the chosen category. For this example the category is Structural Framing, so the available choices reflect this category. The column to the right is a list of scheduled fields. These are parameters that have been moved from the left column for inclusion in the schedule. To add a field to the schedule, simply highlight an available field in the left column and click the Add button. You can also double-click an item to move it to the opposite side.
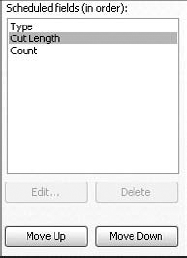
For example, if you wanted to find all of your structural framing based on Type, Cut Length, and Count, you would add these three parameters to the Scheduled Fields column on the right of the Fields tab, as shown in Figure 11.4.
Once a field is added to the Scheduled Fields column, the Remove button becomes available. This can be used to remove any unwanted fields from the schedule.
When you add fields to the Schedule Fields column, the fields are displayed in the order in which they will be displayed in the completed schedule, but you do not have to worry about the order in which they are added. Below the Schedule Fields column you will see buttons that allow you to move the fields up or down to adjust their order, as illustrated in Figure 11.4.
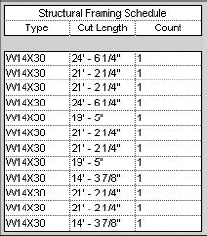
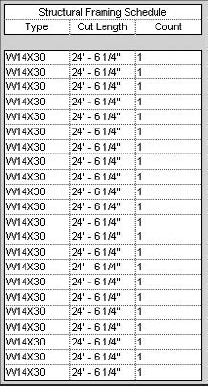
Once the needed fields are moved to the Schedule Fields column and are in the correct order, you can click OK. This will create the new schedule view, as illustrated by the example in Figure 11.5.
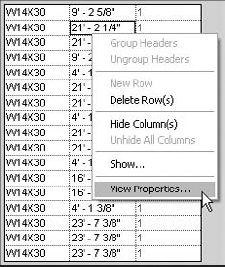
To return to the Schedule Properties dialog box, first right-click anywhere in the schedule view and select View Properties, as illustrated in Figure 11.6. Alternatively, any time the schedule view is not active, you can locate and right-click on the schedule view name in the Project Browser. Select Properties from the resulting shortcut menu to bring up the Properties dialog box for the schedule.
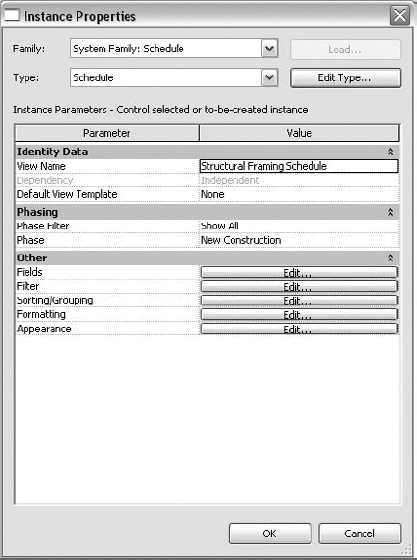
After selecting View Properties (or Properties) from the shortcut menu, you will see the Instance Properties dialog box, which will list the various tabs from the Schedule Properties dialog box under Other, as illustrated in Figure 11.7. Clicking any of the long Edit buttons in the Value column will take you to the corresponding tab in the Schedule Properties dialog box. Once there, you are free to navigate to any of the tabs.
Just because this schedule appears to simply be a list of items, it does not mean it is not live. If the field contains an editable value, you can click into the cell and edit the information. This interaction is a two-way exchange. If you change a value here, you are changing it in the model. Suggesting that you be careful here is the understatement of the century. Since all model elements associated with the schedule field will change accordingly with an edit, you should make sure any changes made in a schedule are deliberate and accurate.
Because Revit Structure acts as a database, creating a schedule filter is similar to creating a query within a specific schedule form. You can tell Revit what you want to see and how you want to see it. Revit will then display that information. Once you have included the desired fields, you can apply a filter.
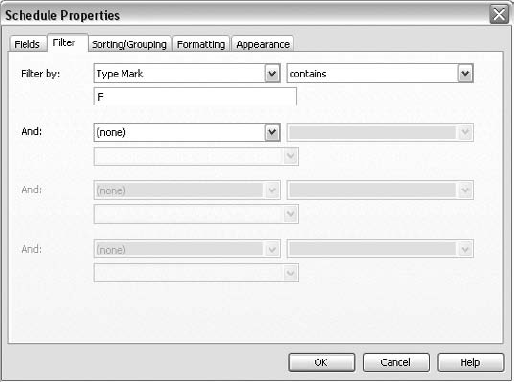
The second tab in the Schedule Properties dialog box is Filter. This is a different form of filtering than that used for Visibility/Graphic Overrides but just as powerful. The more fields you are using in the schedule, the more powerful this feature becomes. Filters are used to narrow down the elements shown on the schedule to exactly what is needed.
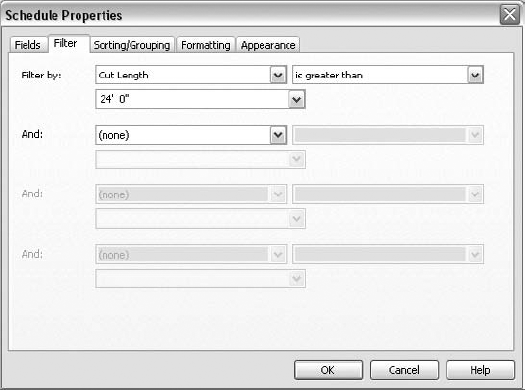
To access the filters, click the Filter tab, as illustrated in Figure 11.8. In the Filter By: category, you can then select the field you would like to filter with. This is telling Revit that you want to see only the items that match these criteria. Any other elements in the model that don't meet the specified conditions will be excluded from this schedule. For this example, to find all beams of a certain length, you would filter by Cut Length.
To the right of the Filter By: option is a drop-down list that allows you to add a condition. To find all framing members that exceed 24′-0″, you can select Is Greater Than from the drop-down list. Once this is set, you can then select or input the specific increment from the drop-down below the Filter By: category. In this case the distance would be 24′ 0″. These settings are illustrated in Figure 11.8.
In many cases, you may wish to filter based on additional criteria. Note that each element must meet the conditions specified in the filter for it to be displayed. As more parameters are used to filter by, you increase the risk of having absolutely nothing show up in the schedule. To prevent this from happening, be sure you are targeting the exact information you would like to filter by and nothing more. If you find yourself with nothing showing in the schedule, back out of some of the specified filters until you can see data again.
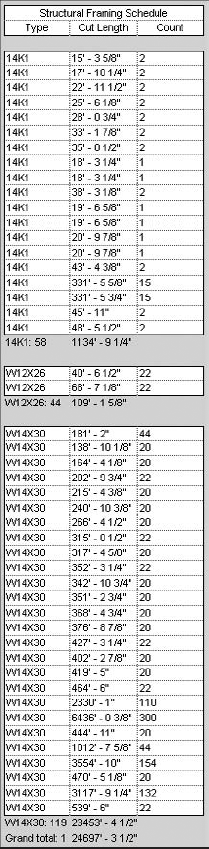
Notice in Figure 11.9 that there are no framing members shorter than 24′-0″. You will notice that each element is independently listed. For some scheduled items, this may be exactly what you want to see. For others, such as finding the number of beams that exceed 24′-0″, you may want all identical members to be listed together. You can accomplish this within the Sorting/Grouping tab.
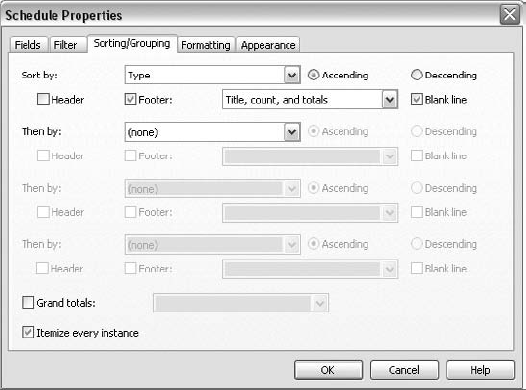
The Sorting/Grouping tab of the Schedule Properties dialog box allows you to organize the schedule data. Here you can produce line item counts and totals. You can also tell Revit to combine similar instances of elements into one row and report grand totals as well as an overall count of the elements.
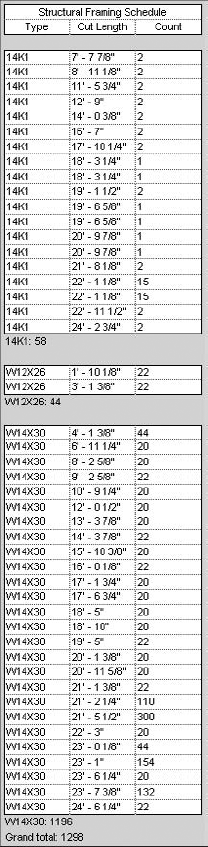
On the Sorting/Grouping tab, the first thing you will see is the Sort By: field followed by multiple Then By: fields. This allows you to create a sorting hierarchy. Typically, a schedule's first sorting criteria will be based on either its name or type. The second criteria can then be determined by what differentiates these similar elements. In the case of the example illustrated in Figure 11.10, the framing members are sorted first by Type, then by Cut Length.
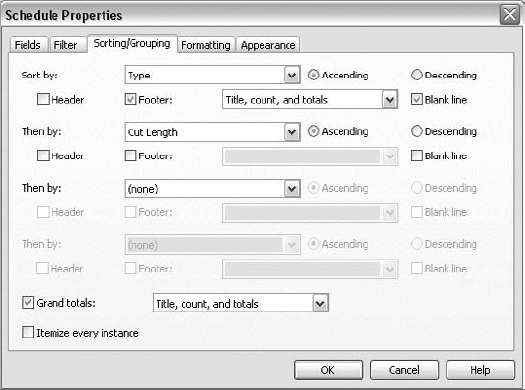
For each group, you can add a header or footer. This helps organize the display of information. A header will display the common sort criteria of the group. For example, if sorted by Type, the type name would be displayed as the header of the grouping. If you choose to provide a footer for each group, you can display the title, counts, and totals of the group or a few combinations of the three. To the right of the Header/Footer options is a Blank Line option. You can check this to insert a blank line between each entry to further break up the element listings. See Figure 11.10.
Toward the bottom of the dialog box, you will see a check box that allows you add grand totals to the end of the schedule. The grand total is calculated by counting every element eligible for the schedule regardless of its sort criteria. Just below the Grand Totals check box is the Itemize Every Instance check box. If unchecked, this option will group all identical elements in one line. See Figure 11.10.
Adding a footer will allow you to display a total count of elements that meet each sorting criteria, among other things. There will be times where you need these totals at the end of each group. In those cases, you will almost certainly require the grand totals for the project as well. See Figure 11.11 for an example of a sorted schedule with the previously implemented filter removed.
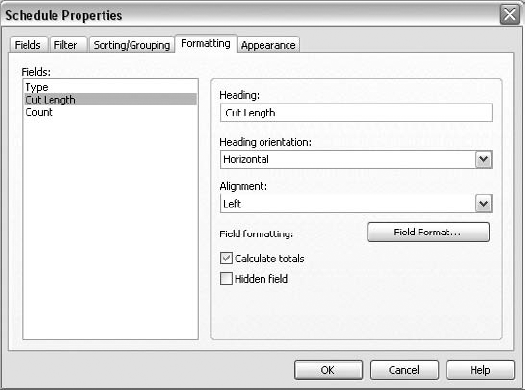
On the Formatting tab, you can specify the format of each field of the schedule. This gives you additional control over how the information will be presented on the printed sheet. The left side of the tab displays the fields you have added to the schedule. The right side contains the formatting choices:
- Heading
This is a text field that allows you to define the heading of the column. This allows you to name and control capitalization of the field's heading in the schedule independent of the parameter name, which is the default heading value. You can also change this by clicking in the heading cell within the schedule view.
- Heading Orientation
This option sets the rotation of the heading to either horizontal or vertical. This is typically kept horizontal, but some types of schedules may require a vertical heading.
- Alignment
This option horizontally justifies the heading text left, center, or right.
- Field Formatting
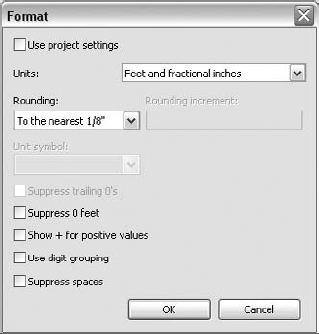
This option pertains to parameters that are affected by Project Unit settings. Click the Field Format button with a qualified parameter highlighted to gain access to the Format dialog box, as illustrated in Figure 11.12. This is similar to the Project Units Format dialog box pertaining to length and can be used to override the project settings for each qualified field within the schedule. If you want to format a particular parameter value differently than the default, you can uncheck the Use Project Settings control at the top of the dialog box. This is useful for parameters such as beam width, where you may want to see the value in inches, as opposed to the project in general, where you want lengths to be shown in feet and inches.
When enabled, the Calculate Totals option of the Schedule Properties dialog box will return a total for all the elements represented by the schedule row. For example, if you had several identical beams that were represented by one row in the schedule and you wanted the Length parameter to return the total length of every instance added together, you could get that by checking the Calculate Totals check box. Compare Figure 11.13 to Figure 11.11; now that the Calculate Totals option has been enabled, as shown in Figure 11.14, the Cut Length field now returns the total length for each row. When used in conjunction with the Footer option for the Type group on the Sorting/Grouping tab, the total length of the entire group is displayed in the footer.
If you do not want the field to be displayed at all, you can check the Hidden Field check box. This option allows the schedule to be sorted and grouped based on the information in this field even if you do not want it to be shown in the schedule view. This should be left unchecked, as illustrated in Figure 11.14, for any fields that are to be displayed in the schedule view or on the drawing sheet. The Hidden Field option can also be enabled from the schedule view. Select any cell in a column or click and drag to select multiple columns, right-click, and select Hide Column(s) from the shortcut menu. All hidden fields can be displayed similarly by right-clicking anywhere in the schedule view and selecting Unhide All Columns from the shortcut menu. Be aware, however, that just as its name implies, this command will unhide all hidden columns indiscriminately. If you do want to display just one hidden column, return to the Schedule Properties dialog box and use the Formatting tab to apply your change.
As you continue to modify items in the Schedule Properties dialog box, you will probably need to bounce back and forth between the schedule view and the various tabs quite a bit until you get the information to display the way you need it. However, you don't need to repeat this procedure every time you need a schedule. Once a suitable schedule has been created, you can add it to your project template. This particular schedule is almost ready to be placed on a drawing sheet.
You may need to create some schedules for internal use only, which are not intended to go on a drawing sheet. In that situation the next and final tab is not critical. However, if this schedule is going to be displayed on the drawings, then the Appearance tab will certainly need to be configured.
The Appearance tab is broken into two areas:
Graphics
Text
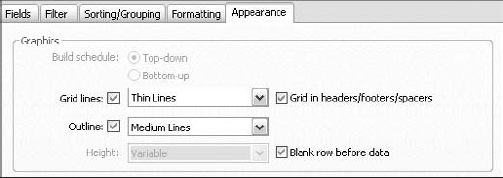
The Graphics area concentrates on options for the lines that make up the grid of the schedule. The Grid Lines check box controls the display of the grid lines, as illustrated in Figure 11.15. Typically, you will want the grid lines turned on; otherwise it may be hard to tell where one cell ends and the next begins. By default, the grid lines show up very light, but you can control the line style of the grid lines with the adjacent pull-down.
To the right of the grid line and the line weight options is a check box to show the grid in headers/footers/spacers. You will typically want this checked if you are using any of these options. The grid and line weight settings can be seen only when a schedule is placed on a sheet and will not be apparent in the schedule view.
The next option, Outline, allows you to turn on a line that wraps around the entire schedule as well as assign it a different line style. If this is left unchecked, the schedule will not add the outline around the overall schedule; it will only close off the fields on the edge of the schedule. Those fields' outside lines will take on the line style assigned in the Grid Lines option above. Typically, this option is used, as illustrated in Figure 11.15, to make the outline a thicker line weight than the grid, but you can assign any line style you need. Again this option controls the display of the schedule only when it is placed on a sheet.
The Blank Row before Data option will add a blank line to serve as a separator between the schedule header and the data. This line can be added by checking the box.
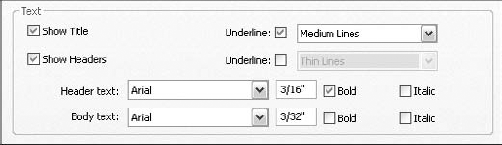
In the Text area of the Appearance tab, you can configure the appearance of the text in the schedule. The first check box is the Show Title option. This allows you to place an overall title at the top of the schedule. The Underline option to the right of the Show Title check box will allow you to override the line style of the line below the title. This option can be used, for example, to make the line under the title the same thickness as the outline, as illustrated in Figure 11.16. If the Underline option is left unchecked, the line under the title will use the grid line setting.
The next check box controls the Show Headers option. This allows you to turn the field headers on or off in the schedule. Typically, this will be left checked, as illustrated in Figure 11.16, but the option to not show headers is available if your particular schedule doesn't require field headers. This option contains Underline and line style selections just like the Show Title option.
Below the Show Headers toggle are the formatting options for Header Text and Body Text. These allow you to set the font and the font size of the headers and body text independently. You can also bold and italicize the text when needed, as illustrated in Figure 11.16.
Now that you have explored the five tabs of the Schedule Properties dialog box, you can get some hands-on experience by creating a schedule from the beginning.
Exercise: Creating a Schedule from the Beginning
The following exercise will guide you through the steps involved in creating a footing schedule. The procedure given in the example used here can then be applied to your specific needs.
To begin, open the file called Scheduling Basics.rvt, provided on this book's website, and follow these steps:
With the
Scheduling Basics.rvtfile open, activate the T.O. FOOTING plan view. If you look closely, you'll see that there are two different sizes of rectangular footings.On the View tab, select Schedules

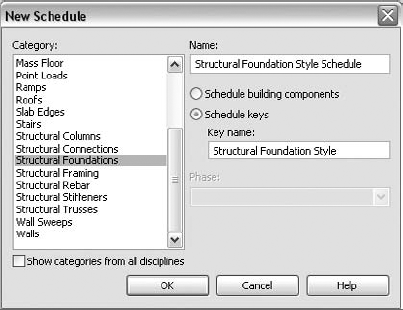
In the New Schedule dialog box, select Structural Foundations. The other options can remain at their defaults. Click OK.
On the Fields tab (the default tab), you can add fields to the schedule. In the Available Fields column on the left, scroll down and select Type.
Between the two field columns there is an Add button. Click it. The Type field moves to the Scheduled Fields column. It will now be shown in the schedule.
Using the same process, add the Family and Type Mark fields as well. After all fields are chosen, use the Move Up or Move Down buttons to organize them as needed.
Navigate to the Filter tab.
Filter by Type Mark.
In the drop-down list to the right, select Contains.
In the input box below the Filter By drop-down list, type the capitalized letter F.
Navigate to the Sorting/Grouping tab.
Use the Sort By drop-down list and select Type.
Check the Footer option and choose Title, Count, and Totals. Also check the Blank Line option.
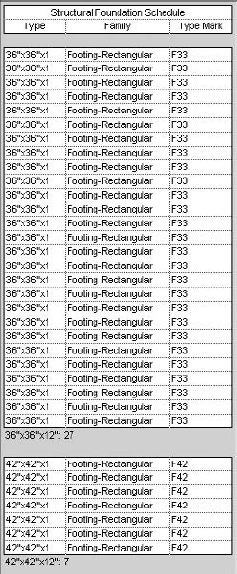
Click OK. The schedule is now displayed separated into two groups. Other structural foundation elements that do not have a type mark containing the letter F are excluded from this schedule.
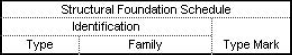
At the top of the schedule you will see the headings Type and Family. Click and hold within the Family cell, and drag your mouse to the left, selecting both cells.
On the Modify Schedule/Quantities tab of the Ribbon, under Headers, select Group. The headers are now grouped together with a new header of their own.
Name the new group header cell Identification.
Now that the schedule has been created, you should save this little gem to your standard template. This will prevent the need to re-create a frequently used schedule over and over. Refer to Chapter 2 for methods for creating templates.
Now that you have explored the basics of schedule creation, let's dig a little deeper and add some formulas to certain fields in your schedule that will provide additional functionality.
When you add a calculated value, you are adding a field that contains a mathematical formula to your schedule, similar to a formula in a spreadsheet. The big difference is you are not calculating based on the contents of cells such as G2*A4. In Revit the formula is based on parameter values and would read like Material: Volume * 2. This would be the volume of whatever material you are scheduling multiplied by 2. A default schedule will only get you so far in terms of the information you may need reported to you, so these calculated values should be added manually as needed. If these are commonly used equations, you should definitely have these calculated values in your office template's schedule(s) so the end user does not have to create them over and over again.
A good example of using a calculated value would be in a floor schedule where the designer needs a total floor volume based in cubic yards, with a given waste factor. To follow along with this example, open the Other Schedules.rvt file provided on this book's website.
To achieve this, create a new schedule following the steps listed below:
Navigate to the View tab of the Ribbon and on the Create panel, select Schedules
In the New Schedule dialog box, select Floors as the category and click OK.
Add the following fields:
Level
Area
Volume
On the Fields tab of the Schedule Properties dialog box, you will see a Calculated Value button between the Available Fields and the Scheduled Fields areas, as shown in Figure 11.17. Click this button.
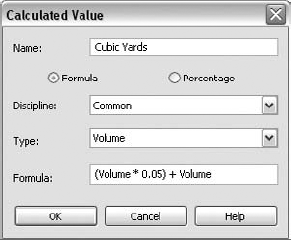
In the Calculated Value dialog box shown in Figure 11.18, fill in the name as Cubic Yards. Choose Common as the discipline and Volume as the type.
In the Formula field, enter (Volume * 0.05) + Volume. This will take the Volume field and multiply it by a factor of 0.05. This result is then added to the volume again, creating the volume plus the waste factor. See Figure 11.18. Note that references to parameters are case sensitive. Click OK.
With the field now created, click the Formatting tab. Select the newly created Cubic Yards field, and click the Field Format button.
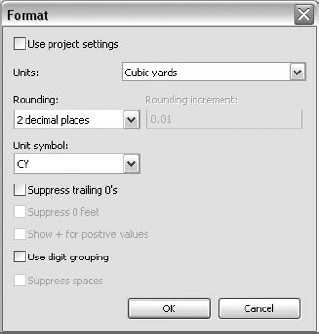
In the Format dialog box, uncheck Use Project Settings and set the Units to Cubic Yards, as illustrated in Figure 11.19.
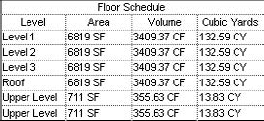
Click OK until you are back in the schedule view. You will see the new field, as illustrated in the example shown in Figure 11.20.
As you can see, schedules can be a powerful information source regarding your model. You can use a schedule to edit, or organize, or quantify your model. The key to success is looking for opportunities during your work, as just about anything in your model can be viewed in a schedule form.
Creating a schedule key requires a slightly different mindset than creating a normal schedule. The purpose of a schedule key is to control multiple parameter values by creating a key designation and applying it to elements directly or within normal schedules. For this example, say you had a building with an expansion joint between the north and south halves. You may want to identify where a particular foundation exists. Let's also say a portion of this particular building was to be built over a lake, which would put the footings in this area below the water table. These are two details that may be of interest to the designer. You can follow along with this exercise by opening the Schedule Key.rvt file from this book's website.
You can create a schedule key with the same command you used to create a regular schedule. On the View tab, on the Create panel of the Ribbon, select Schedules
On the Fields tab, you will see only two parameters available to add to the Scheduled Fields list. Additional parameters can be added by clicking the Add Parameter button between the field columns. While you can add parameters by creating project Instance parameters manually, adding them here automatically sets the requirements for use with schedule keys.
The Key Name field will be scheduled by default. Add the Comments parameter to the Scheduled Fields list to use for the water table warning. Now you just need to add one more for the footing location. Click the Add Parameter button between the column fields. Notice the parameter defaults to a Project parameter as well as being an Instance parameter. Name this parameter Location, group it under Identity Data, and click OK. Move the Location parameter above the Comments parameter, as shown in Figure 11.22. Click OK.

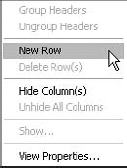
You are then presented with your new, albeit empty, schedule view. At this point, you can add new rows with the New button under Rows on the Modify Schedule/Quantities tab or by right-clicking and selecting New Row, as illustrated in Figure 11.23.
Additional parameters can be created for use with schedule keys but they must adhere to some logical restrictions. They can be created by navigating to the Manage tab and selecting Project Parameters from the Project Settings panel. If you do this you'll notice the Location parameter we just added is listed here too. Then in the Project Parameters dialog box, click the Add button. Verify that the parameter type is set to Project parameter, and in the Parameter Data area, verify that you are creating an Instance parameter. Set the other parameter data options as needed, and give the parameter a category from the list on the right side of the dialog box. This choice is derived from the element category you wish to use with the schedule key.
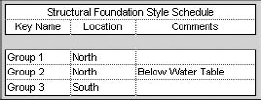
Create three new rows, one for each of the possible footing groups. Under Key Name, call them Group 1, Group 2, and Group 3. For Group 1 and Group 2, enter the Location as North. The Location of Group 3 will be South. Under Comments add Below Water Table to Group 2. The schedule key should now look like Figure 11.24.
In this example, foundations are the target of this schedule key, so your next goal is to get your hands on some. Navigate to the foundation view, where you will find foundation elements that are affected by the schedule key. Select the four foundations in the upper-left corner, as illustrated in Figure 11.25, and click the upper half of the Element Properties button on the Modify Structural Foundations tab of the Ribbon.
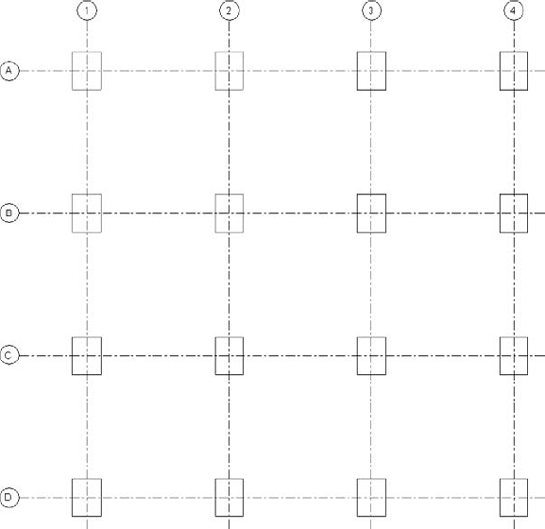
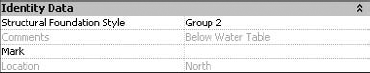
In the Instance Properties dialog box, you will see a parameter called Structural Foundation Style under the Identity Data heading. By default this will be set to (none). Notice that the Comments parameter is available for input when no Structural Foundation Style has been assigned. If you click in the Value cell of this parameter, a drop-down list will appear. In the list you will see the three groups available. Select Group 1 for this quarter of the building. The Location parameter will change to reflect the location you added to the schedule key for Group 1. The parameters affected by the schedule key will become unavailable for manual input after a key is assigned. Repeat this process for the four upper-right foundations and assign them to Group 2; see Figure 11.26. Finish by assigning the remaining eight foundations to Group 3.
Complete this example by creating a Standard Schedule that uses these parameters. On the View tab, select Schedules
As you can see, creating a schedule in Revit is not a difficult task, and you can display quite a bit of information from the model. Next you will take it a step further and pull material quantities from the model. This might be referred to as 4D, a subject often discussed, and in this case it means an extended use of the model beyond project documentation. Material takeoffs are created using the same procedure as for schedule creation.
A nice thing about Revit Structure is that many of the procedures are similar, if not exactly the same as another. Creating a material takeoff, compared to creating a schedule, is one such example. Once you have mastered one method, the other is virtually the same.
To follow along with the description below, open the Other Schedules.rvt file found on this book's website.
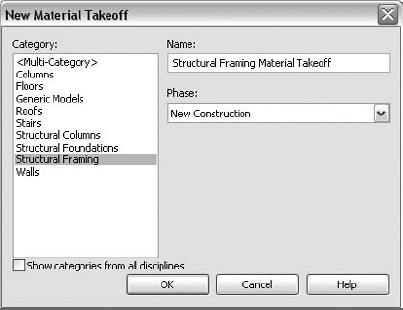
A concrete structure with pan-formed joists is a good example of a material takeoff. The material of the concrete framing can be quickly quantified. Go to the View tab
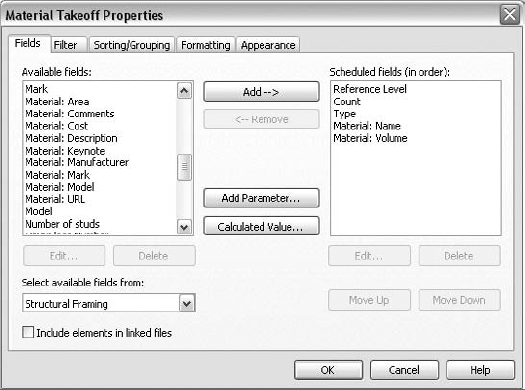
As you are looking at the fields to add in the Material Takeoff Properties dialog box, scroll down the Available Fields column and notice the new parameter types that are prefixed with Material:
Here you can add fields such as:
Reference Level
Count
Type
Material: Name
Material: Volume
See Figure 11.28 for an illustration.
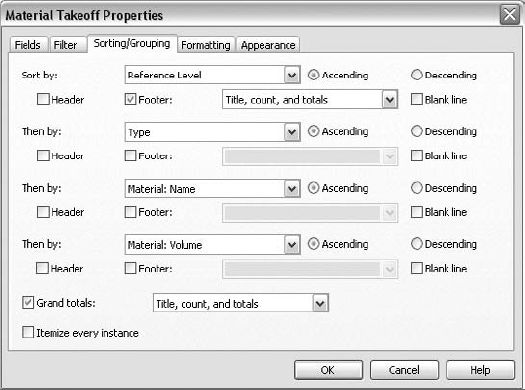
This type of schedule is oftentimes heavily dependent on how the fields are sorted. If you navigate to the Sorting/Grouping tab, you will notice you can sort the fields by many of the added parameter fields. It is also particularly important to create footers and to display the value totals in material takeoffs. At the bottom you should also uncheck Itemize Every Instance. In this example, the fields are sorted by
Reference Level
Type
Material: Name
Material: Volume
See Figure 11.29 for an illustration.
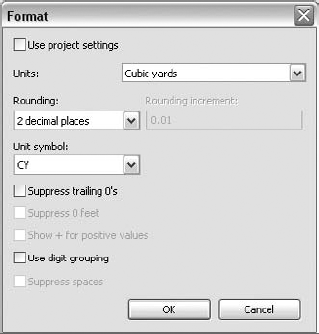
Material: Volume is an important field in this example. This field can be formatted and calculated independently of the rest of the schedule to provide a more informative material takeoff. On the Formatting tab, select the Material: Volume field, and in the Field formatting area, check the Calculate Totals option. Click the Field Format button. This button allows you to override the default unit formatting of this field. Uncheck Use Project Settings and select Cubic Yards as the units of this field, as illustrated in Figure 11.30. Click OK until you arrive at the schedule view, and you will notice the Material: Volume column displays total concrete volume for each level as well as a grand total for all the framing in the building.
You now have a material takeoff of the volume of concrete needed to cast the framing for this structure, displayed in cubic yards. As the design of the building changes, so do the takeoff values, resulting in an accurate and current quantification of the concrete volumes throughout the life of the project.
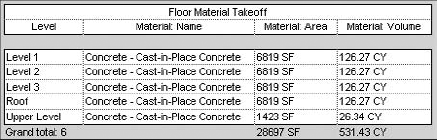
Another good example is a floor area calculation. This takeoff can contain both area and volume information, serving as a dual-purpose schedule/takeoff. To follow along, still within the Other Schedules.rvt file, go to View tab and select Schedules
Level
Material: Name
Material: Area
Material: Volume
The Sorting/Grouping tab allows you to sort the entries according to your need. For this example, sort by Level. Grand Totals should be checked and set to display Title, Count, and Totals.
On the Formatting tab, select the Material: Area field and check the Calculate Totals option. For Material: Volume, check the Calculate Totals option, click the Field Format button to override the units to reflect Cubic Yards, and click OK until you are presented with the schedule view. The result is another accurate material takeoff that can be produced and referenced at any point in the life of the project. See Figure 11.31.
Schedules can be used in a multitude of ways. One way is to display this information on the construction documents by adding the schedule to a drawing sheet. Another is to mine the project for material takeoff information. A third is to use the schedule to drive design changes back to the model, and we will explore this concept next.
As you have seen, changes to the model will be shown in your schedules automatically. Suppose you wanted the opposite to happen. It sure would be nice if you could make changes in the schedule and have them propagate back to the physical model. Well, in Revit, you can do just that. Schedules always accurately represent the model, so it makes sense that it would be impossible to change a schedule and not have that change affect the model. While it is very efficient, this two-way street burdens the modeler with the responsibility of being certain the changes made are correct. For this reason, you should be careful when editing schedules. The reality is, if you change an item in a schedule, it will change in the model.
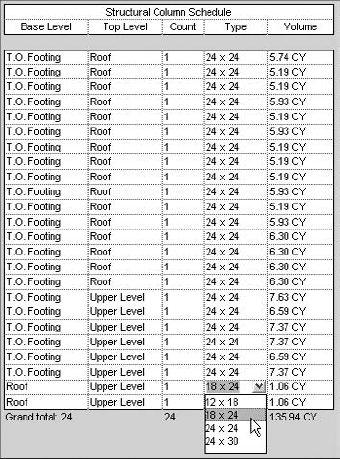
Not every field in a schedule is editable. If the scheduled field is a calculated result (such as volume), then the field cannot be changed in the schedule. It must physically be changed in the model. If the field is a parameter that can be modified in the Element Properties dialog box (such as family type), then it can be modified in the schedule. For example, Figure 11.32 shows a Structural Column Schedule you will create in the next exercise. Notice that the Count field is a calculated value. The Count value will change only if identical instances of this element are created or deleted in the model. The Type field, however, can be modified in the schedule.
You can tell if a field is editable by clicking into the cell. If a cursor appears along with a drop-down list, as shown in Figure 11.32, the field can be changed. In an editable field you can choose one of the values in the drop-down list or type a new one. Although some parameters, such as the Type parameter here, depend on the available types of elements in the model so that a new one cannot simply be typed in, it must be created in the model to be available. The schedule and model will be updated to reflect the changes made, so be careful. Tiling the schedule view with a 3D view is a good idea in this situation so you are certain exactly what you are changing when editing model elements from a schedule view.
Real World Scenario: Proceed with Caution!
Occasionally when making a schedule view, I'll miss a step and end up with a blank cell where I expect to see values. I once made the mistake of thinking that was expected and changed the cell value. I then saw all my beams lose the proper stud counts—but only after plotting it out. I had missed a crucial filter and ended up with hundreds of beams listed in a single schedule row.
Being able to modify model elements using schedules is a very powerful tool, but it can also get you into trouble. Be sure when you are altering schedule field values that you are doing it deliberately and are checking the model after the changes have been made. Although Revit changes your approach to modeling, it does not negate the need for a thorough back check of the affected views and of the documents.
Exercise: Creating a "Working" Schedule
Follow these steps to create a schedule and use it to modify the model elements.
Open the file named
Other Schedules.rvt.On the View tab, select Schedules
Select Structural Columns as the Category and click OK.
Add the following fields:
Base Level
Top Level
Count
Type
Volume
Navigate to the Sorting/Grouping tab.
Sort by Base Level and then by Top Level.
Navigate to the Formatting tab.
Highlight the Count field and check the Calculate Totals option.
Highlight the Volume field and check Calculate Totals.
With the Volume field still highlighted, click the Field Format button.
Uncheck Use Project Settings, set the Units to Cubic Yards, and click OK.
Click OK on the Schedule Properties dialog box, and the schedule will appear.
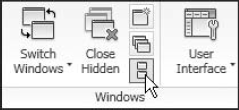
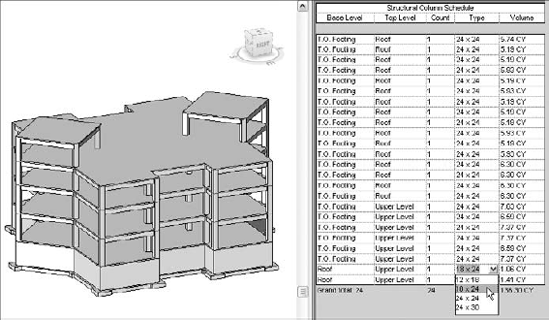
When editing model elements from a schedule view, it is a good idea to display both the schedule and the 3D model. With the schedule view and the {3D} view open, select Tile Windows on the View tab of the Windows panel. This allows you to more confidently modify elements from the schedule view since you can verify the affected elements and see the modification happen in real time.
At the bottom of the schedule, there are two 24x24 columns that run from the roof to the upper level. These columns are too big and can be sized down. Click anywhere in the row of the column; it will highlight in the 3D view. Adjust the 3D view so you can see the highlighted column. Click in the Type cell for this column and change it to 18x24. Notice the column changes in size in both the schedule and the model.
Repeat the process for the other column that runs from the roof to the upper level.
Modeling due diligence is still of paramount concern. You cannot simply model by schedule, because many of the issues like specific placement cannot be addressed in a schedule. In a pinch you can use schedules to adjust things, but always return to your plans and sections to see that orientation issues are not a problem.
Although Revit Structure is a comprehensive database that is fully capable of performing most tasks, there is still—and always will be—a need to export data to other formats. You may know how to export the model to other CAD applications, but what about the data in the schedules? You will find others in the industry who don't use Revit. They could be involved in other aspects of the project that don't require Revit, or maybe they are just slower to adapt. This could even be true inside your office. An estimator or project manager probably will not be using Revit but will still need to have access to and/or manipulate data generated by the model.
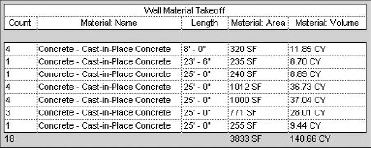
In order to have something to export, you need to create a schedule or a material takeoff in Revit Structure. This example continues with the Other Schedules.rvt file. This example uses a Wall material takeoff. This material takeoff should consist of the following fields:
Count
Material: Name
Length
Material: Area
Material: Volume
The options to choose in this example are as follows:
See Figure 11.33.
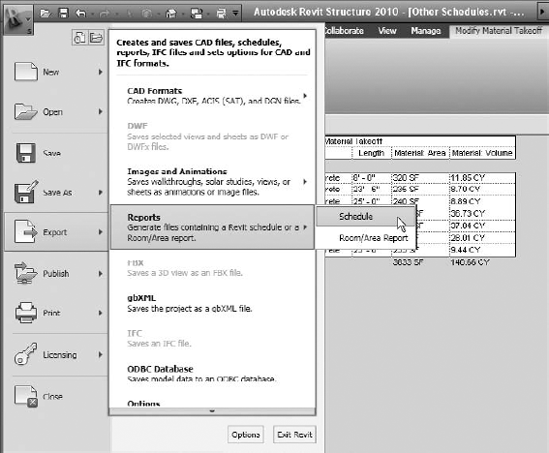
Now that you have a material takeoff to export, you can get down to business. One not-so-obvious detail you need to remember when exporting takeoffs and schedules is that you need to have the schedule view you wish to export open and active. If the schedule view is not active, it will be grayed out in the list of available views to export, giving the impression it cannot be exported. As long as the view is active, the schedule will be available for export. With the Wall Material Takeoff view active, navigate to the Application menu and select Export
You should recognize the next dialog as a Save As opportunity that will allow you to name and locate the soon-to-be-scheduled export file. If applicable, you can set up a directory within the project directory where all team members have access to the files being generated from Revit. It is also a great idea to alert the team to expect this kind of information and to communicate exactly where it is to be stored. Notice that the only file type available to save as is a delimited .txt file. This file type is an application-neutral format, which is used since most database and spreadsheet programs can read these types of files. Once you verify the filename and locate the directory into which you want to save the .txt file, click Save.
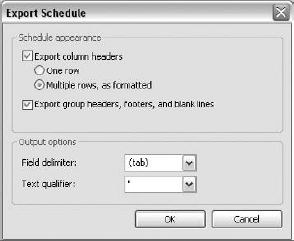
The Export Schedule dialog box provides some options for how the data will be written to file. The default options should work for most situations and probably won't need to be changed unless the database software you are working with requires it or if you are an advanced user who is aware of the effects of such changes.
The defaults in the Schedule Appearance area of the dialog box will export column headers and create multiple rows as formatted in Revit, as well as include group headers, footers, and blank lines in the export. The defaults in the Output Options area will use (tab) spacing to delimit the fields. Traditionally, comma delimited is most popular, but tab delimited is a much cleaner import for software such as Excel. The text qualifier is quote marks. See these options in Figure 11.35. Click OK to write the file.
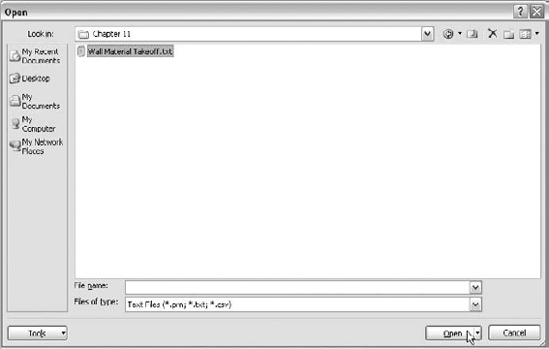
Once the .txt file has been created, it can be imported into other database software. This example will use Microsoft Excel 2007. To import the data, open Microsoft Excel and select Open using the Office button, which is similar to the Revit Application menu. For the Files of Type option, select Text Files (*.prn; *.txt; *.csv), as shown in Figure 11.36. Browse to the directory where your .txt file is stored, select the file, and click Open.
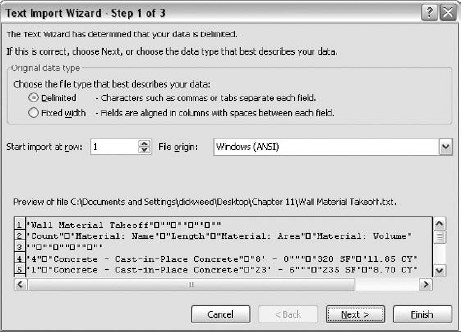
Excel will now prompt you to make some additional choices using the Text Import Wizard, as shown in Figure 11.37. Essentially, this is a confirmation of the dialog box shown in Figure 11.35. As Excel has detected, we are using tab-delimited data. If for some reason you don't want to import the entire file from the beginning, you can set the Start Import at Row value to the desired starting row. The File Origin is 437 : OEM United States. You will also see a very basic preview of the data in the bottom window shown in Figure 11.37.
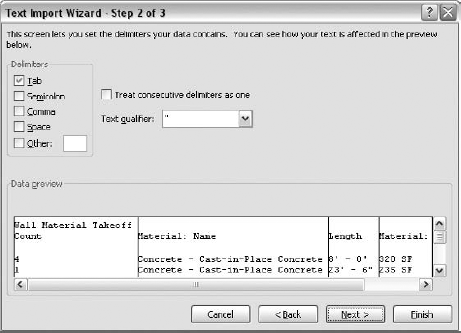
Since this is a wizard, you will see a Next button at the bottom of the dialog box. Clicking this will bring you to the next step in the process, as illustrated in Figure 11.38. Again, the defaults are simply a reflection of your initial settings in Revit. The Delimiters field is set to Tab. Here you can add additional delimiters, but the delimiter(s) should match the format of the file you are importing. If the delimiters used don't match the .txt file, the data may import unreadable or unorganized. On the flip side, if the data doesn't come in correctly, you may have to adjust these settings until the data appears the way you wish to see it. Click Next to continue.
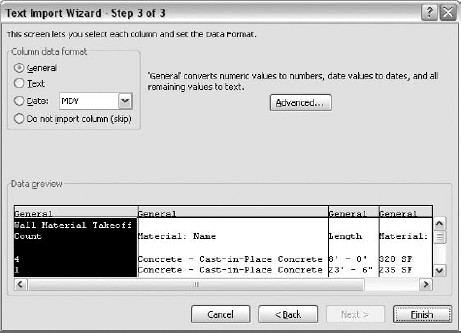
The third step in the Text Import Wizard will allow you to set the formatting of the data cells by column. Under Column Data Format, you can select the cell format for the highlighted data column below. Notice that the data columns in the Data Preview are selectable. You can format the cells of the entire column by highlighting a data column and then selecting the formatting choice in the Column Data Format area above, as illustrated in Figure 11.39. Click Finish.
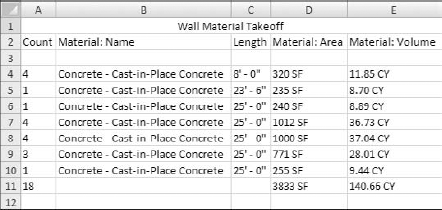
The Excel table will appear with all of the data from your Revit material takeoff. Of course some of the column widths and justifications may need to be adjusted, and perhaps the cells on the title line could be merged and the title centered, as shown in Figure 11.40. Note that the totals are not using formulas, just a strict data value extraction.
Exercise: Creating a Material Takeoff and Exporting It to Microsoft Excel
The following step-by-step example will take you through creating a wall material takeoff and exporting it to Excel as explained in the previous section.
Open the file called
Other Schedules.rvtfrom this book's website.Navigate to the View tab. On the Create panel select the Schedules button and select Material Takeoff from the drop-down list.
Select Walls from the Category list on the left, and click OK.
Add the following fields:
Count
Material: Name
Length
Material: Area
Material: Volume
Navigate to the Sorting/Grouping tab.
Sort by Material: Volume.
Near the bottom of the dialog box, enable the Grand Totals option and select Count and Totals from the drop-down list.
Uncheck Itemize Every Instance.
Navigate to the Formatting tab.
Highlight Material: Volume and click the Field Format button.
Uncheck the Use Project Settings option, change the Units format to Cubic Yards, and click OK.
With Material: Volume still highlighted, check the Calculate Totals option and click OK.
Navigate to the Application menu and select Export
Verify the name of the
.txtfile, browse to the directory in which you want to save the file, and click Save.In the Export Schedule dialog box, use the defaults and click OK.
Open Microsoft Excel.
Open the
Wall Material Takeoff.txtfile. Remember to change the Files of Type drop-down in the Open dialog box.In the first step of the Text Import Wizard, keep the default as Delimited and click Next.
In the second step of the Text Import Wizard, keep the default delimiter set to (tab) and click Next.
In the third and final step of the Text Import Wizard, keep the default Column Data Format set to General, and click Finish.
In Excel, adjust the cell widths so the data is displayed clearly, and make any other desired cell formatting changes.
At the bottom of the program, notice the current worksheet tab was given the same name as the
Wall Material Takeoff.txtfile.Click the Save icon in Excel. You will get a message regarding the file format. Even though you opened the file in Excel, it is still regarded as a
.txtfile. When you get the message warning you of this, click No and save it to the.xls(.xlsor.xlsx) format.
This procedure is useful for getting project information to the estimator or others involved in the project who do not use Revit. Some may handle their work in other software programs, and exporting the model data using this procedure will allow you to give them the information they need quickly and easily.
Another option to track model elements or materials is to use keynote legends. While keynoting will allow you to change the data in many elements at once, it is a multistep process that has some special requirements. Keynoting is driven by an external .txt file that contains all the keynote entries. Each element or material's keynote parameter, located in the Element Properties dialog box, can then be given a keynote value. Note that no keynote values have been populated by default. Each element or material must then be tagged to display that entry in a keynote legend. Whew!
Thankfully, once you have set up keynotes in your template, they will be much easier to implement in future projects. To follow along with this lesson, open the Other Schedules.rvt file from this book's website.
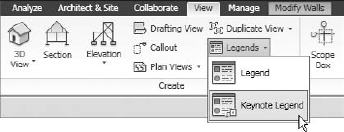
Creating a keynote legend is very similar to creating any other schedule; we just have to start from a slightly different location. Navigate to the View tab, and from the Create panel select Legends
This will take you to the New Keynote Legend dialog box, where you can name the view. For this example, the legend will be used with beam elements, so name the keynote legend Beam Keynote Legend and click OK.
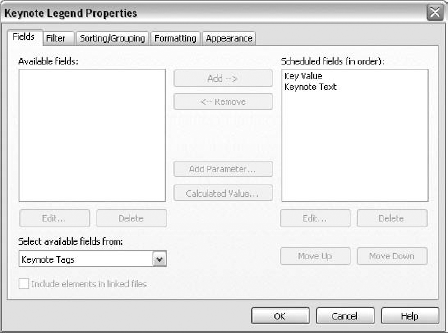
You will then see the Keynote Legend Properties dialog box. This should be immediately familiar to you since it is virtually identical to the Schedule Properties dialog box you have been using throughout this chapter. On the Fields tab, there are only two available fields for keynote legends, Key Value and Keynote Text, and they are added by default, see Figure 11.42.
Most of the tabs in the Keynote Legend Properties dialog box look and function exactly as within the Schedule Properties dialog box with one exception. At the bottom of the Filter tab you will find the option Filter by Sheet. If this option is left unchecked, the keynote legend will display all keynote entries for the entire project on all sheets it is placed on. When the Filter by Sheet option is checked, however, the keynote legend placed on a particular sheet will display only the entries relevant to that sheet, thus filtering the entries by sheet. This check box is typically turned on.
Once you verify the two available fields have been added and click OK, a blank keynote legend will appear. It is blank because, as mentioned before, there are multiple steps to this process. You have created the legend view; now you need to associate a keynote table file to the project.
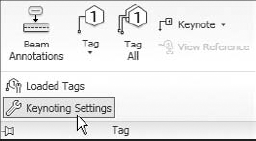
Before you can begin to assign keynote values to elements, you must first associate a keynote file with your project. To access the Keynoting Settings dialog box, navigate to the Annotate tab and click the Tag panel drop-down to expand it, as shown in Figure 11.43. Select Keynoting Settings from the list, and the Keynoting Settings dialog box will appear.
In the Keynote Table area at the top of this dialog box, you will find the path information for any associated files. There is a Browse button to use if a file has not been associated or if you need to associate a different file. Below the Browse button is a View button. This will allow you to view the keynote table in a tree format. Note that the keynote table cannot be edited from this view.
Next is the Path Type area, where you can set the resolve method for the keynote table file. Absolute specifies an exact location defined by the saved path. Relative will find the file anywhere the model file is located; thus the files can be moved and the table file will be searched for relative to the project file. At Library Locations will search for the table file wherever the libraries are defined for your particular Revit installation, whether it is a standalone installation or a network deployment.
At the bottom of the Keynoting Settings dialog box are the Numbering Method options. You can choose to number By Keynote or By Sheet when you place keynotes. The difference between these is simple but significant. When numbering by keynote, the keynote number specified in the keynotes file will be used, and it will be consistent for a given keynote across all sheets. When numbering by sheet, each keynote is assigned a number that is unique on a particular sheet; however, the same keynote could be assigned a different number on a different sheet. When you use the By Sheet numbering option, views containing keynote tags must be placed on a sheet before the keynote number will be generated. For this example, leave this set to By Keynote.
The keynote table file can be edited by opening it with a text editor or Excel, since it is created in tab-delimited format. Revit's standard keynote table file should be associated by default. If so, you can use the Browse button to determine the location of your Imperial Library. Open the default keynote table file (RevitKeynotes_Imperial_2004.txt) with Notepad by browsing to the Imperial Library in your library location. Note that this file is likely set with read-only protection, but you can make it editable by right-clicking on the file, selecting Properties, and unchecking the Read-Only option.
Notice that the file is not terribly easy to read in this format. For this reason, it is helpful to open this file in Excel or similar software. Open Excel and open the same file. When you're in the Open dialog box, select Text Files (.txt) using the Files of Type drop-down list, and then browse to and open the file. The Text Import Wizard will appear, just as it did when you were opening an exported schedule. Click Next twice and then click Finish to use the defaults. After you adjust the column widths a bit, the file is much easier to read than before.
There are three columns in a keynote table file. The first column represents the Keynote Value parameter. The middle column houses the Keynote Text parameter values. The last column helps define the directory tree you see when you view the file from within Revit. A blank third column means the keynote represented by the row is a top directory on the tree. If a particular keynote is located under another in the tree structure, the keynote value of the parent keynote will reside in the third column. Take a look at the default file for a minute. Notice that the rows that define the various divisions have no value for the third column. Below those, notice that the entries have values in the third column. This means these entries will be located under the various divisions in the tree within Revit.
Revit keynote table files can also be created from scratch. The format is simple: just separate each value in a row with a tab. Revit will recognize any file in this format so long as it has been associated with the project within the Keynoting Settings dialog box. For this example, verify that the default file is associated with your project. The next step involves tagging elements with the keynotes defined in the associated file.
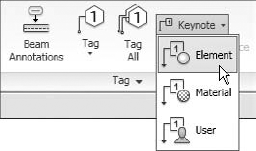
Now that Revit has a keynote table file to draw values from, you can begin to associate those values with model elements. Navigate to the Level 2 plan view of the Other Schedules.rvt file. A keynote tag can be placed whether or not a keynote value has been assigned to a model element. If no keynote value has been assigned, the tag will prompt you for a value. Start the keynote tag command from the Annotate tab by clicking the Keynote button on the Tag panel and selecting Element from the drop-down list, as shown in Figure 11.44.
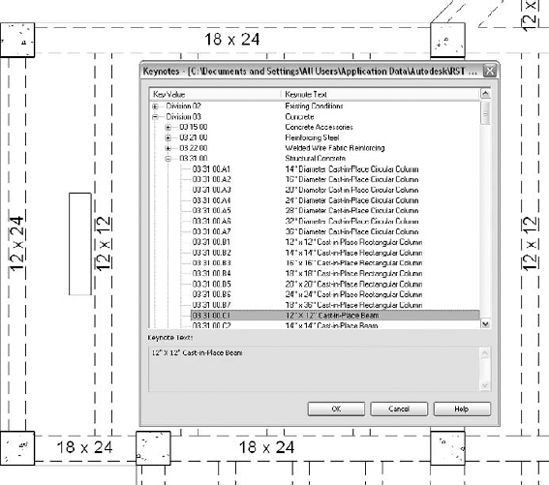
Before placing the tag, look at the Options bar. Uncheck the Leader option and change the tag orientation to Vertical. Select one of the 12x12 beams to tag, and you will be presented with the tree view of the keynote table file, as illustrated in Figure 11.45.
Here you can choose the keynote value to assign to this element. Browse the key values and expand Division 03 - Concrete
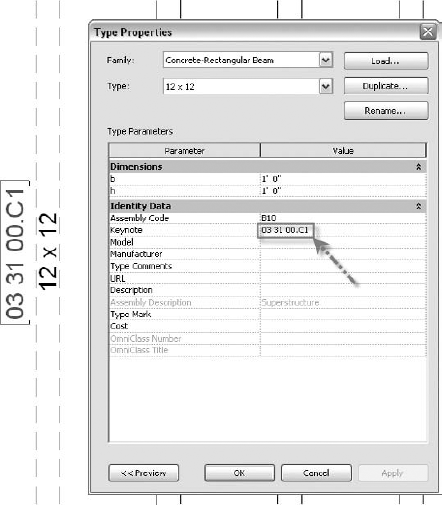
The value can be edited after the tagging process by clicking in the Value cell of the Keynote parameter. This will display the familiar Browse button on the right side of the cell, which you can click to return to the keynote table tree. Add several keynote tags to the other beams in this plan, giving them the proper keynote value according to their size. The tag type can be changed as you would expect, by highlighting the tag and selecting a different type from the Type Selector drop-down list. Notice that when you tag a beam that is of the same type as one you have already tagged, the keynote value appears automatically.
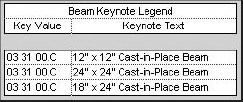
As you have learned throughout this chapter, you can edit Element parameters by accessing the Element Properties dialog box or by editing the schedule directly, and keynoting is no different. Return to the Beam Keynote Legend schedule view. You will find a row for each type of beam for which you assigned a keynote. Click in the Key Value cell of the schedule to assess the keynote table tree and edit the value. Note that if all the tags of a particular type are deleted, the entry will no longer exist in the keynote legend.
Keynoting a material works in much the same way except instead of element types driving the value, the material of the element controls it. In order for Revit Structure to keynote a material, the element must be visible in the view, and the material may need to be displayed by adjusting the detail level in some cases.
Here are a couple of situations you may encounter:
If you are not able to keynote an element in a particular view, check the settings of the family. Nested family components must be shared in order to place or display a keynote value.
If a family is created using a keynote table file that is different from the one the project is associated with and the same value exists in each keynote table, the project's keynote file values are used. You should always try to select a value from the keynote table the project is associated with. At times this may require you to copy values from one table to another.
The last step for a keynote legend would be to put it on a sheet. Just as for other schedule views, simply make a sheet view active and then use the Project Browser to drag the sheet and place it as needed.
- Create schedules
Revit Structure benefits from a strong link between schedules and data. Once a schedule is created, the elements and parameter values can be manipulated either in the model or in the schedule. Each will influence the other.
- Master It
The Schedule Properties dialog box can be accessed in two ways. One way is to right-click on the schedule name in the Project Browser and select Properties. What is the second way of accessing the Schedule properties?
- Create schedule keys
Schedule keys can be used to control multiple parameter values by creating a key designation and applying it to model elements.
- Master It
How can you create additional parameters for use with schedule keys, and what are their restrictions?
- Create material takeoffs
Material takeoffs are known as a fourth-dimension modeling use. Using Revit Structure to track cost and material can be a big advantage in any project. Once the tools are developed and the basic takeoffs are in place, the efficiency of these features will be greater than ever.
- Master It
A material takeoff is a bit different from a schedule; however, the two are similar in many ways. What is the primary difference between material takeoffs and schedules?
- Export schedules to Microsoft Excel
Keeping track of the quantities may not be in the designer's scope of work. Many times the task is assigned to an estimator who is not involved with the modeling process at all. This functionality allows the designer to output accurate model data to an estimator in a format that person can use.
- Master It
Once a schedule or material takeoff is created in Revit Structure, how is it exported to Excel?
- Create keynote legends
Keynote legends are a great way to track items and materials in Revit. The keynote values and keynote text values are easily editable and create reliable keynotes for your drawings.
- Master It
A keynote is tied directly into the element type being scheduled. What is the procedure for giving an element a keynote value?