09 Metering, Exposure Modes, and Histogram

Woodchuck Paradise © 2016 Mark Morrison (Lunastar)
I’ve been using Nikon cameras since 1980. It seems that with each new camera, there have been improvements in metering and exposure modes. The Nikon D500 is no exception. Within this camera, Nikon has designed metering and exposure to work not only with still images, but also with broadcast-quality video (D-Movies).
In this chapter, you’ll learn how the exposure metering system and modes work. We’ll look at how each of four different light meter types is best used. We’ll examine the various modes you can use when taking pictures, and finally, we’ll look in detail at how the histogram works on the Nikon D500. This little readout gives you great control over metering and will help you make the most accurate exposures you’ve ever made. It is very important that you understand the histogram, so we’ll look at it in detail. This chapter is divided into three parts:
- Section 1 – Metering: The Nikon D500 provides four major light metering systems: 3D Color Matrix Metering III, Center-weighted, Highlight-weighted, and Spot.
- Section 2 – Exposure Modes: The camera’s MODE button allows access to various shooting or exposure modes, such as Programmed auto (P), Shutter-priority auto (S), Aperture-priority auto (A), and Manual (M).
- Section 3 – Histogram: The histogram is a digital bell-curve readout that shows how well an image is exposed. It’s an important tool for advanced photographers. This chapter discusses how to read the histogram and better control your exposures.
Let’s get started by looking more deeply into the four exposure metering systems.
Section 1: Metering
The basis for the Nikon D500’s exposure meter is a 180,000-pixel RGB sensor that meters a wide area of the frame, measuring the light and providing a correct image exposure.
When used with a Nikkor G, E, or D lens that contains a CPU, the camera can set the exposure based on the distribution of brightness, color, distance, and composition. Most people leave their light meter set to Matrix metering and enjoy excellent results.
The Nikon D500 uses a newly developed Advanced Scene Recognition System, including the 180K-pixel RGB sensor, which measures each scene’s light properties, color spectrum, and brightness levels. It then compares your subject against the camera’s built-in image database to provide even more accurate autoexposure. With a metering sensor this sensitive, the D500 can do things with ease that other cameras struggle to accomplish.
Figure 9.1A shows the controls used to select a metering mode—the Metering button and rear Main command dial—along with the four metering mode symbols on the top Control panel. Matrix metering is the factory default setting for the camera.

Figure 9.1A – Four meter types (in order): Matrix, Highlight-weighted, Spot, and Center-weighted
To switch among the four exposure meter types, use the following steps:
- 1. Press the info button to open the Information display on the Monitor (figure 9.1A, image 2, lower red arrow). Hold down the Metering button and rotate the rear Main command dial (figure 9.1A, images 1 and 2, top red arrow).
- 2. You will see a series of four metering symbols on the Information display as you rotate the rear Main command dial (figure 9.1A, images 3–6). The metering symbol appears on the left side of the Information display at all times. While you hold down the Metering button, the metering symbol also appears at the bottom of the Information display next to a symbol that represents the rear Main command dial (image 3, lower red arrow).
- 3. The symbol shown in image 3 is the Matrix metering symbol. Image 4 shows the Highlight-weighted metering symbol; image 5 displays the Spot metering symbol; and image 6 shows the Center-weighted symbol. (Note: If you prefer to use the top Control panel instead of the Information display, these same metering symbols will appear in the upper-left corner of the Control panel while you hold down the Metering button. The symbols can also be seen at the bottom-left corner area of the Viewfinder so that you can make metering adjustments without removing your eye from the Viewfinder.)
- 4. Once you have selected a metering mode, and the correct symbol is showing on the Information display, Control panel, and Viewfinder, release the Metering button. Your camera will now use the selected metering mode until you change it.
Learn to recognize what each metering symbol means so that you can make metering mode changes quickly. Now let’s examine the four meter types to see which you will use most often.
3D Color Matrix III Metering
The Nikon D500 contains the 3D Color Matrix III metering system, one of the most powerful and accurate automatic exposure metering systems in any camera today (figure 9.1B). 3D Color Matrix III metering is active only when you are using a Nikkor G, E, or D lens. For other lenses with a CPU, the D500 uses Color Matrix III metering (no 3D, which is what tracks subject color). When you are using camera-registered, non-CPU lenses, the D500 switches to basic Color Matrix metering (no 3D or type III), which is an older type of Matrix metering better suited to lenses that do not pass distance information from a CPU to the camera.

Figure 9.1B – Matrix metering
How does Matrix metering work? There are characteristics for many thousands of images stored in the camera. These characteristics are used along with proprietary Nikon software and complex evaluative computations to analyze the image that appears in your Viewfinder or in Live view. The meter is then set to provide accurate exposures for the greatest majority of your images.
Whether you are taking a scenic picture with the bright sky above and the darker earth below, or a group shot with one or several human faces, the metering system evaluates the image and compares it to hundreds of similar images in the camera’s database; then it automatically selects and inputs a meter setting for you.
3D Color Matrix III metering examines four critical areas of each picture. First it compares the levels of brightness in various parts of the scene to determine the total range of EV values. Then it notices the color of the subject and surroundings. Next it determines how far away your lens is focused so it can determine the distance to your subject. Finally, it looks at the compositional elements of the subject.
When it has all that information, it compares your image to tens of thousands of image characteristics in its image database, makes complex evaluations, and comes up with an exposure value that is usually right on target, even in complex lighting situations.
Highlight-Weighted Metering
Some types of photography, such as theater, concert, or other types of event photography, may have a bright subject against a dark background. Since most other meter types tend to average the light in the frame, you may see a burned-out, overly bright subject as the camera tries to compensate for the extreme contrast between the subject and the background.

Figure 9.1C – Highlight-weighted metering
Highlight-weighted metering (figure 9.1C) causes the camera to pay more attention to the highlights of your subject than to its darker surroundings, often giving you a much better exposure for the subject.
In figure 9.1C you can see the Highlight-weighted metering symbol: the small dotted square with the asterisk on the top-right corner.
If you are photographing a concert singer at a microphone under a spotlight, for instance, this type of metering will give you a better exposure of the singer, at the expense of letting the background and surroundings go dark.
I can imagine all types of situations where the subject is bright and the surroundings are dark. This meter type should help you create better images under those circumstances.
Spot Metering
Often only a spot meter will do. In situations where you must get an accurate exposure for a very small section of the frame, or if you must get several meter readings from various small areas, the D500 can be adjusted to fit your needs. The Spot meter evaluates only 2.5 percent of the frame, so it is indeed a spot meter.

Figure 9.1D – Spot meter and approximate size of 3.5mm spot
In figure 9.1D, you can see the Spot metering symbol (image 1) and the approximate size of the metered area in the Viewfinder (image 2). The D500’s Spot meter consists of a 3.5mm circle (0.14 inch) surrounding the currently active AF point in both Single and Continuous AF modes (AF-S and AF-C)
How big is the 3.5mm spot? The Spot meter barely surrounds the AF point square in your viewfinder (figure 9.1D, image 2). It is a little larger than the brackets that appear around the active AF sensor when you slightly press the Shutter-release button. In fact, the Spot meter follows the currently active AF point around the Viewfinder, so you can move the Spot meter around the frame with the Multi selector pad.
When your D500 is in Spot meter mode and you move the AF point to some small section of your subject, you can rest assured that you’re getting a true spot reading. In fact, you can use your Spot meter to determine an approximate EV range of light values in the entire image by taking multiple manual spot readings from different parts of the subject and comparing the values. If the values exceed 5 or 6 EV steps, you have to decide which part of your subject is most important and meter for it.
On an overcast day, you can usually get by with no worries since the range of light is often within the recording capability of the sensor. On a bright, sunny day, the range of light can be more than a single image can record, and you might have to use a graduated neutral-density filter or HDR imaging to rein in the excessive light range.
Just remember that spot metering is often a trade-off. Either you have the highly specific ability to ensure that a certain portion of an image is exposed with spot-on accuracy (Spot meter), or you can use the camera’s multiple averaging skills (Matrix meter) to generally get the correct exposure throughout the frame. The choice is yours, depending on the shooting situation.
If you spot meter the face of someone who is standing in the sun, the shadows around the person will usually be underexposed and have little or no data. If you spot meter the areas in the shadows instead, the person’s face is likely to be blown out and lose detail. We’ll discuss this more in section 3 of this chapter, which explores the histogram.
Center-Weighted Metering
If you were raised on a classic center-weighted meter and you still prefer that type, the D500’s exposure meter can be transformed into a flexible center-weighted meter with variable-sized weighting that you can control.

Figure 9.1E – Center-weighted meter
In figure 9.1E, you can see the Center-weighted metering symbol. The Center-weighted meter in the D500 meters the entire frame but concentrates 75 percent of the metering into an adjustable circle in the middle. The 25 percent of the frame outside the circle provides the rest of the metering. If you’d like, you can make the circle as small as 6mm or as large as 13mm. You can even completely eliminate the circle and use the entire Viewfinder frame as a basic averaging meter.
Let’s examine the Center-weighted meter more closely. Using Custom Setting Menu > b Metering/exposure > b6 Center-weighted area, you can change the size of the circle where the camera concentrates the meter reading. (See Custom Setting b6: Center-weighted Area on page 258.)
The default circle is 8mm in the center of your camera’s Viewfinder (figure 9.1F, screen 2). However, by changing Custom setting b6 Center-weighted area, you can adjust this size to one of the following:
- 6mm (0.24 inch)
- 8mm (0.31 inch)
- 10mm (0.39 inch)
- 13mm (0.51 inch)
- Average (entire frame)

Figure 9.1F – Center-weighted metering, approximate sizes
Again, the Center-weighted meter is a pretty simple concept. The part of your subject that’s in the center of your D500’s Viewfinder influences the meter more than the edges of the frame, on a 75/25 basis. The circle gets 75 percent importance. The red circles shown in figure 9.1F are just rough approximations. Simply meter the subject with the center of the Viewfinder, and you should have good results.
Note: If you are using a non-CPU lens, the Center-weighted meter defaults to 8mm and cannot be changed. Adjustments to Custom setting b6 Center-weighted area have no effect.
Where’s the Circle?
You can’t actually see any indication of circles in the Viewfinder, so you’ll have to imagine them, as I did in figure 9.1F.
Locate your current autofocus (AF) sensor in the middle of your Viewfinder. Now imagine the smallest circle, 6mm, which is about a quarter of an inch. The largest circle is 13mm, which is a little bigger than half of an inch. This unseen circle in the center area of the View-finder provides the most important 75 percent metering area.
Settings Recommendation: If I used the Center-weighted meter often, I would stay with the 8mm setting. That’s a pretty small circle—almost a spot meter—so it should give you good readings. I would point the circle at the most important part of my subject, get a meter reading, use the AE-Lock button to lock the exposure, recompose the picture, and then release the shutter.
The most sensitive area is large enough at 8mm to see more than a pure spot meter, though, so you have the best of both worlds. There is so little difference between 6mm and 13mm that it probably makes little difference which one you use. If you are concerned, then experiment with the settings and see which one works best for you.
Using the Average Setting
If you set your meter to Average (Avg) in Custom setting b6 Center-weighted area, the light values of the entire Viewfinder are averaged to arrive at an exposure value. No particular area of the frame is assigned any greater importance (figure 9.1F, screen 5).
This is a little bit like Matrix metering but without the extra smarts. In fact, on several test subjects, I got similar meter readings from the Average and Matrix meters. However, Matrix metering should do better in difficult lighting situations because it has a database of image characteristics to compare with your current image—including color, distance, and where your subject is located in the frame.
Settings Recommendation: Use your Spot meter to get specific meter readings of small areas on and around your subject; then make some exposure decisions yourself and your subject should be well exposed. Just remember that the Spot meter evaluates only for the small area that it sees, so it cannot adjust the camera for anything except that one tiny area. Spot metering requires some practice, but it is a very professional way to expose images.
On cameras previous to the D500, I often used the Spot meter on a person’s face when I was taking pictures in darker surroundings so that the person’s face was not blown out (due to the meter being influenced by the dark surroundings). However, the D500 is much better at locating and exposing for faces accurately, especially with Highlight-weighted metering, even when using the Viewfinder instead of Live view. I now use the Spot meter much less than I did before.
Section 2: Exposure Modes
My first Nikon was an FM, which I remember with fondness because that was when I first got serious about photography. It’s hard for me to imagine that it has already been 36 years since I used my first Nikon. Things were simpler back then. When I say simple, I mean that the FM had a basic center-weighted light meter, a manual exposure dial, and manual aperture settings. I had to decide how to create the image in all aspects. It was a camera with only one mode—M, or manual.
Later on, I bought a Nikon FE and was amazed to use its A mode, or Aperture-priority auto. I could set the aperture manually and the camera would adjust the shutter speed for me. The FE had two modes: M-manual and A-Aperture-priority.
A few more years went by and I bought a Nikon F4 that was loaded with features and was much more complex. It had four modes, including the two I was used to (M and A) and two new ones: Shutter-priority auto (S) and Programmed auto (P). I had to learn even more stuff! The F4 was my first P, S, A, M camera.
Does this sound anything like your progression? If you’re at least 50 years old, maybe so; if not, I ought to stop reminiscing and get to the point.
Today’s cameras are amazingly complex compared to cameras only a few years ago. Let’s examine how we can use that flexibility for our benefit. The D500 is also a P, S, A, M camera. That’s the abbreviated progression of primary shooting modes that allow you to control the camera’s shutter speed and aperture yourself.
To select the P, S, A, or M mode, simply hold down the MODE button (found next to the Metering button) and turn the rear Main command dial in either direction. The mode changes will be displayed in the upper-left corner of the Control panel and the Information display screen, which I use in this chapter for ease of viewing. You will also see a tiny P, S, A, or M at the bottom middle of the Viewfinder, near the aperture readout. Let’s examine each exposure mode in detail.
Programmed Auto Mode (P)
Programmed auto (P) mode is designed for those times when you just want to shoot pictures and not think much about camera settings but still want emergency control when needed. The camera takes care of the shutter speed and aperture for you and uses your selected exposure meter type to create the best pictures it can without human intervention. You can override the aperture by turning the rear Main command dial.
The big P in the upper-left corner of the Information display (figure 9.2A), and also in the upper-left corner of the Control panel (not shown), indicates that the camera is set to Programmed auto (P) mode. This mode is called Programmed auto because it uses a software program built into the camera. It tries its best to create optimal images in most situations.

Figure 9.2A – Programmed auto mode on the Information display
However, even the User’s Manual calls this a “snapshot” mode. P mode can handle a wide variety of situations well, but I wouldn’t depend on it for my important shooting. It can be great at a party, for example, when I want some nice snapshots. I don’t have to think about the camera then, and I can just enjoy the party. P mode to me is “P for Party.”
It’s a good mode to use when you want to let the camera control the aperture and shutter while you control the flash. In a sense, it’s like auto mode on lesser cameras.
Programmed auto mode also lets you override the camera’s aperture in an emergency. You may need more depth of field and decide to use a smaller aperture. The camera allows you to do that by turning the rear Main command dial. When you do, the aperture is under your control, and the camera controls the shutter.
P mode actually comes in two parts: Programmed auto and Flexible program. Flexible program is similar to Aperture-priority auto (A) mode. Why do I say that? Let me explain with an example.
Get Down, Uncle Ben!
You’re shooting at a family reunion and suddenly you see a perfect shot of a somewhat tipsy Uncle Ben dancing on the dinner table and Aunt Myrtle standing on the floor behind him with her hand over her mouth. You (being a well-trained photographer) glance down at your camera and realize that the f/4 aperture showing on the Control panel won’t give you enough depth of field to focus on Uncle Ben and still have a sharp image of Aunt Myrtle, who by this time is tugging at Ben’s pant leg. With only seconds to spare, you turn your rear Main command dial to the left. The D500 realizes that it is being called upon to leave snapshot mode and give you some control. It displays a small P* (P with an asterisk, as seen in figure 9.2B) on the Control panel to let you know it realizes you are taking over control of the aperture. Since you are turning the dial to the left, it obligingly starts cranking down the aperture. A few clicks to the left and your aperture is now at f/8. As soon as the D500 detected you were turning the Main command dial, it started adjusting the shutter speed to match the new aperture. With only seconds before Aunt Myrtle starts dragging Uncle Ben off the dinner table, you get the camera to your eye, compose the shot, press the Shutter-release button, and the D500 starts grabbing frames. You get several frames off in the few seconds it takes Aunt Myrtle to get Uncle Ben down from the table. A “priceless” family memory, captured!
What you did in this imaginary scenario was invoke the Flexible program mode (P*) in your D500 (figure 9.2B). How? As soon as you turned the rear Main command dial, the D500 left normal P mode and switched to Flexible program.

Figure 9.2B – Flexible program (P*) mode on the Information display
Before you turned the Main command dial, the D500 was happily controlling both shutter speed and aperture for you. When you turned the dial, the D500 immediately switched to Flexible program mode and let you have control of the aperture. It then controlled only the shutter speed. In effect, the D500 allowed you to exercise your knowledge of photography very quickly and only assisted you from that point.
When you enter Flexible program (P*) and turn the rear Main command dial clockwise, the aperture stops down (smaller opening, larger numbers). Turn it counterclockwise and the aperture opens up (larger opening, smaller numbers). Nothing happens if you turn the front Sub-command dial. Nikon gives you control of the aperture, but not the shutter speed, in Flexible program mode. Can you see why I say Flexible program mode acts like Aperture-priority auto (A) mode?
Beware the Extra Clicks
If you turn the rear Main command dial to the right until the aperture reaches its maximum size, the camera starts counting clicks but does nothing else. The same thing happens if you try to go smaller than the minimum aperture. In order to start making the aperture change again, you have to turn back the same number of clicks (up to 15). I have no idea why Nikon does it this way, but it has for many years—maybe to allow for lenses with more aperture range.
It’s confusing to have the camera stop letting you control the aperture just because you turned the Main command dial past wide open by several clicks and then give you control again when you turn it back the same number of clicks. It’s no big deal, really; just be aware that this will happen so you won’t think the camera is not working correctly.
Shutter-Priority Auto Mode (S)
Shutter-priority auto (S) mode is for those who need to control their camera’s shutter speed while allowing the camera to maintain the correct aperture for the available light. You’ll turn the rear Main command dial to adjust the shutter speed, while the camera controls the aperture.
In figure 9.2C, the Information display shows the big S symbol in the upper-left corner, proving that Shutter-priority auto (S) mode is set. The S symbol will also show in the upper-left corner of the Control panel and at the bottom of the Viewfinder (not shown). If you find yourself shooting action, you’ll want to keep the shutter speed high enough to capture an image without excessive blurring.

Figure 9.2C – Shutter-priority auto mode on the Information display
Shooting sports, air shows, auto races, or any quickly moving subject requires careful control of the shutter. If you shoot a bird in flight, you may want to use a fast shutter speed that allows for just a tiny bit of motion blur in its wings, while completely stopping the body of the bird, or a faster shutter speed to eliminate all blur.
Sometimes you’ll want to set your shutter speed to slow settings for special effects or time exposures, such as a small waterfall in a beautiful mountain stream. See figure 9.2D for both stop-motion and blurring effects.

Figure 9.2D – Fast shutter speed to stop bird and slow shutter speed to blur water
To change the shutter speed, simply rotate the rear Main command dial to any value between 30 seconds and 1/8000 of a second. Turn the dial counterclockwise for faster shutter speeds and clockwise for slower. The camera will adjust your aperture to maintain a correct exposure and will warn you when it can’t.
Watch Out for Camera Shake!
Be careful when the shutter speed is set below 1/125 second. Camera shake becomes a problem for many people at 1/60 second and slower. If you are careful to stand still, brace your arms against your chest, and spread your feet apart with one in front of the other, you’ll probably be able to make sharp images at 1/60 to 1/30 second (figure 9.2E, image on the left).
Surprisingly, your heartbeat and breathing is reflected in your hands during slow shutter speed photography. At 1/15 second and slower, most people cannot take sharp pictures without having the camera on a tripod (figure 9.2E, image on the right). If you are going to shoot at slow shutter speeds, buy yourself a solid tripod. You’ll make much nicer pictures. You can also use a monopod for a very portable device to steady the camera, with results in between handholding and tripod use.
The picture of the small waterfall in Great Smoky Mountains National Park in figure 9.2D was taken at a shutter speed of several seconds. It is virtually impossible to hold a camera perfectly still for several seconds, so a shot like that would be unachievable without a tripod.

Figure 9.2E – Woman holding camera for steady shooting, and pro photographer using a tripod
Aperture-Priority Auto Mode (A)
Nature, macro, and portrait shooters, and anyone concerned with carefully controlling depth of field, will often leave their cameras set to Aperture-priority auto (A) mode. This mode allows you to control the aperture while the camera takes care of the shutter speed for optimal exposures. To select an aperture, you’ll use the front Sub-command dial. Turn the dial clockwise for smaller apertures (smaller opening, larger numbers—e.g., f/5.6 or f/11) and counterclockwise for larger apertures (larger opening, smaller numbers—e.g., f/1.4 or f/3.5).
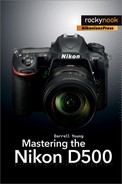
The big A symbol showing on the Information display in figure 9.2F proves that Aperture-priority auto (A) mode is set. The A symbol will also appear in the upper-left corner of the Control panel and the center bottom of the Viewfinder (not shown).
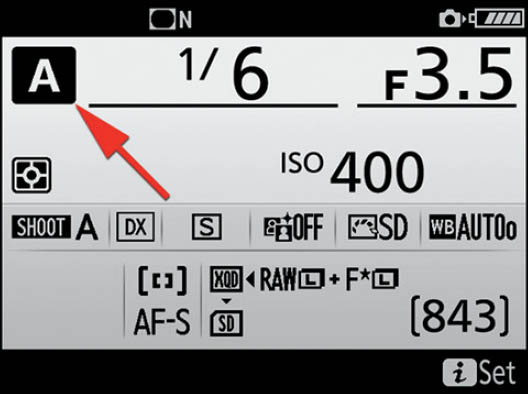
Figure 9.2F – Aperture-priority auto mode on the Information display
The minimum and maximum aperture settings are limited by the minimum and maximum aperture available on the lens you have mounted on the camera. Most consumer lenses run from f/3.5 to f/22. More expensive, pro-style lenses may have apertures as large as f/0.95 or f/1.4, but they generally start at f/2.8 and end at f/22–f/32. For those new to digital photography, the aperture directly controls the depth of field (DOF)—or zone of sharpness—in an image. DOF is an extremely important concept for photographers to understand. Simply put, it allows you to control the range or depth of sharp focus in your images. In the bird image in figure 9.2G, the DOF is very shallow, and in the scenic shot it is very deep.

Figure 9.2G – Large aperture to blur background (left) and small aperture for deep depth of field (right)
Manual Mode (M)
Manual mode takes a big step backward to days of old. It gives you complete control of your camera’s shutter and aperture so that you can make all the exposure decisions, with suggestions from the light meter.
The big M in the upper-left corner of the Information display in figure 9.2H (left arrow) shows that the camera is in Manual (M) mode. The Control panel also displays the M and −/+ Exposure indicator, as does the Viewfinder (not shown).

Figure 9.2H – Manual (M) showing along with the −/+ Exposure indicator on the Information display
In figure 9.2H, notice the analog Exposure indicator display (right red arrow). The Exposure indicator display has a minus sign (–) on the left and a plus sign (+) on the right. Each tiny square on the scale represents 1/3 EV step, and each slightly larger tiny rectangle represents 1 EV step. You can control how sensitive this scale is by changing Custom Setting Menu > b Metering/exposure > b2 EV steps for exposure cntrl to 1/3, 1/2, or 1 EV step. The camera defaults to 1/3 step from the factory.
When you are metering your subject, a bar will appear underneath the −/+ Exposure indicator and extend from the zero in the center toward the plus side to indicate overexposure or toward the minus side to indicate underexposure.
You can gauge the amount of over- or underexposure by the number of dots and lines the bar passes as it heads toward one side or the other. The goal in Manual mode is to make the bar disappear. In figure 9.2H, the Exposure indicator shows that the scene is underexposed by 1 EV step (1 stop). The Control panel and Viewfinder will show the same indicator. Check your camera’s Control panel and Viewfinder in Manual mode to see how it looks. You should zero the Exposure indicator for a good exposure.
You can adjust the aperture with the front Sub-command dial, and you can adjust the shutter speed with the rear Main command dial. When you put the camera in Manual mode (M), you have control over the aperture for depth of field and the shutter speed for motion control. If your subject needs a little more depth of field, just make the aperture smaller, but be sure to slow down the shutter speed as well (or your image may be underexposed). If you need a faster shutter speed, then set it faster, but be sure to open the aperture to compensate.
The point is, you are in complete control of the camera and must make decisions for both the shutter speed and aperture. The camera makes suggestions with its meter, but you make the final decision about how the exposure will look. Manual mode is for taking your time and enjoying your photography. It gives you the most control over how the image looks but also expects you to have a higher level of knowledge to get correct exposures.
Most people who use the D500 are advanced photographers, reflecting the purpose of this feature-laden camera, and they fully understand things like depth of field, shutter speed, and aperture. If you’re new to the world of DSLRs, you can find in-depth coverage of these important concepts in my book Beyond Point-and-Shoot (Rocky Nook, 2012).
Settings Recommendation: As a nature photographer, I am mostly concerned with getting a nice sharp image with deep depth of field. About 90 percent of the time, my camera is set to Aperture-priority auto (A) and f/8. I control the aperture opening, and the camera controls the shutter speed. I started using this mode in about 1986 when I bought my Nikon FE, and I’ve used it ever since.
However, if I were shooting sports or action, I would set my camera to Shutter-priority auto (S) most often, which would allow me to control the speed of the shutter and capture those fast-moving subjects without a lot of blur. The camera controls the aperture so that I only have to concentrate on which shutter speed best fits my subject’s movement.
I use the other two modes, Programmed auto (P) and Manual (M), only for special occasions. Manual mode is for when I have time to just enjoy my photography. When I want to control the camera completely, I go to Manual.
I probably use Programmed auto (P) mode least of all. I might use it when I am at a party and just want to take nice pictures for my own use. I’ll let the camera make most of the decisions by using P mode and still have the ability to quickly jump into Flexible program (P*) mode when events call for a little more aperture control.
Section 3: Histogram
Back in the good old film days, we didn’t have a histogram, so we had to depend on our experience and light meter to get a good exposure. Because we couldn’t see the exposure until after we had left the scene, we measured our success by the number of correctly exposed images we were able to create.
With the exposure meter/histogram combination found in the D500, and the ability to zoom in to our images with the high-resolution Monitor on the back, our success rate is much higher than ever before.
The histogram can be as important as the exposure meter, or even more so. The meter sets up the camera for the exposure, and the histogram verifies that the exposure is a good one.
If your exposure meter stopped working, you could still get perfect exposures using only the histogram. In fact, I gauge my efforts more by how the histogram looks than anything else. The exposure meter and histogram work together to make sure you get excellent results from your photographic efforts.
- Playback RGB Histogram: The RGB histogram screen shows an individual histogram for each color channel (figure 9.3A). On the top is a luminance histogram followed by the red, green, and blue (RGB) channels. If your camera does not display the RGB histogram screen shown in figure 9.3A, you’ll need to select the check box found at Playback Menu > Playback display options > RGB histogram. This setting enables or disables the RGB histogram screen, which you can then find by displaying an image on the Monitor and then scrolling up or down with the Multi selector pad. One important reason to examine the RGB histogram is to see if any one color channel has lost all detail in the dark or light areas. Later in this chapter, we will examine how you can determine when detail has been lost.

Figure 9.3A – Playback RGB histogram
- Playback Luminance Histogram: Figure 9.3B shows a slightly larger luminance histogram along with image information. If your camera does not display the Luminance histogram screen shown in figure 9.3B, you’ll need to put a check in the check box found at Playback Menu > Playback display options > Overview. This setting enables or disables the Overview screen, which you can then find by displaying an image on the Monitor and then scrolling up or down with the Multi selector pad. This is a basic luminance histogram, which is a weighted view of the brightness and color in a scene based on how the human eye perceives light. How does the luminance histogram differ from the RGB histograms? The luminance histogram is a representation of the perceived brightness (luminosity) from a combination of the red, green, and blue channels. In other words, the luminance histogram tries to accurately reflect the light you see by weighting its color values in a particular way. Since the human eye sees green most easily, the luminance histogram is heavily weighted toward green. Notice in figure 9.3A, how the luminance histogram at the top (the white one) looks very similar to the green channel histogram below it. Red and blue are also represented in the luminance histogram but in lesser quantities (59 percent green + 30 percent red + 11 percent blue = luminance). The luminance histogram measures the perceived brightness in 256 levels (0–255). The luminance histogram is an accurate way of looking at the combined color levels in real images. Because it more accurately reflects the way our eyes actually see color brightness, it may be the best histogram for you to use, most of the time.

Figure 9.3B – Playback Luminance histogram
- Assigned Button Luminance Histogram: The white histogram shown in figure 9.3C is exactly the same as the white luminance histogram seen in figure 9.3B and the white histogram at the top of the screen in figure 9.3A. This particular histogram is available only by assigning one of the camera’s buttons to open it. In Custom Setting Menu > f Controls > f2 Multi selector center button > Playback mode, I assigned View histograms to the Multi selector center button. Now whenever I am viewing an image on the camera’s Monitor, I can press the Multi selector center button and the camera will display the histogram seen in figure 9.3C, as long as I hold down the button. This works only when you’re using Playback mode (viewing images). It is a fast and convenient way to get a histogram open without scrolling through a bunch of image data screens. Now that we have discussed how to open the various histogram screens in the D500, let’s discuss how a histogram works.

Figure 9.3C – Assigned button Luminance histogram
Bad Exposure Warning
If the light changes drastically and the camera cannot maintain a correct exposure due to your current settings, the offending setting will blink in the Viewfinder, Control panel, and Information display. The camera will also display the −/+ Exposure indicator (which you use in Manual mode) with an approximate number of EV steps of over- or underexposure.
If you see the aperture or shutter speed setting blinking in any of the displays, along with the −/+ Exposure indicator displaying a −/+ EV value, please validate your exposure before taking a picture.
Understanding the Histogram
Using your D500’s histogram screens will guarantee you a much higher percentage of well-exposed images. It is well worth spending time to understand the histogram. It’s not as complicated as it looks.
I’ll cover this feature with enough detail to give you a working knowledge of how to use the histogram to make better pictures. If you are deeply interested in the histogram, there is a lot of research material available on the Internet. Although this overview is brief, it will present enough knowledge to improve your technique immediately.
Class-Leading Dynamic Range
The D500’s imaging sensor can record a wide range of light values—according to DxO Labs, 14 EV steps, which is an amazing amount of dynamic range. In fact, the D500 has one of the widest dynamic range capabilities of any digital camera tested by DxO Labs. It has greater dynamic range than even the Nikon D5’s 12.3 EV steps.
Unfortunately, even with the massive potential dynamic range the D500 has, many of the higher-contrast subjects we shoot contain more light range than the camera can capture in one exposure.
It is important to understand how your camera records light so you can better control how the image is captured. Even though the dynamic range of the D500 is superior to many other cameras, it still can’t handle the range of light captured by the human eye.
Let’s look into the histogram so you can determine how well you have captured the light in the scene before your lens. The gray rectangular area in figure 9.3D represents an in-camera histogram. Examine it carefully! Think about it for a minute before reading on.

Figure 9.3D – A basic histogram
The histogram is basically a graph of 256 steps that represents the maximum range of light values your camera can capture (0 = pure black and 255 = pure white). In the middle of the histogram are the midrange values that represent middle colors like grays, light browns, and greens. The values from just above zero and just below 255 contain detail.
The actual histogram often looks like a mountain peak, or a series of peaks, and the more there is of a particular color, the taller the peak that represents that color will be. In some instances the graph will be rounder on top, and in other cases it will be flattened or have several peaks.
The left side of the histogram represents the maximum dark values that your camera can record. The right side represents the maximum light values your camera can capture. On either end of the histogram (0 or 255), the light values contain no detail. They are either completely black (0) or completely white (255).
The height of the histogram (top of mountain peaks) represents the amount of individual colors. You cannot easily control this value in-camera, other than changing to a Picture Control with more or less saturated color, so it is for your information only.

Figure 9.3E – Three histograms: underexposed, well exposed, and overexposed
We are mostly concerned with the left- and right-side values of the histogram because we do have much greater control over those (dark versus light). In figure 9.3E, we see a basic histogram tutorial with three separate histograms that have different exposures. Refer to figure 9.3E as we discuss the histogram further.
Simply put, the histogram’s horizontal scale is related to the darkness and lightness of the image, and the vertical scale of the histogram (valleys and peaks of the mountains) have to do with the amount of color information.
The left (dark) and right (light) directions of the horizontal scale are very important for your picture taking. If the image is too dark, the light values will be clipped off on the left side; if it’s too light, the light values will be clipped off on the right side. This will become easier to understand as we look at well-exposed and poorly exposed images.
When you see the three histograms next to each other (figure 9.3E), does it make more sense? See how the underexposed histogram is all the way to the left of the histogram window and is clipped mid peak? Note how both edges of the well-exposed histogram just touch the horizontal edges of the histogram window. Finally, notice how the overexposed histogram is crammed toward the right and clipped. Now, let’s look at some histogram details.
Histogram Shape
The image in figure 9.3F is well exposed with no serious problems. The entire light range of this particular image fits within the histogram window, which means that it’s not too light or too dark and will need very little or no adjustment to view or print. This image is similar to the well-exposed image in figure 9.3E. It contains no more than 6 or 7 stops (EV steps) of light. To finalize the image, I might increase the brightness in the trees a little, but otherwise it’s a sound image with potential for immediate usage.
Compare the histogram in figure 9.3F to the histogram in figure 9.3G. Notice that the histogram in figure 9.3F is not crammed against the dark value side (left side) like the histogram in figure 9.3G. In other words, the dark values in figure 9.3F are not clipped on the left. This means that the camera recorded all the dark values in this image with no loss of shadow detail.

Figure 9.3F – Good image with normal histogram shape, no clipping
Now look at the right side of the histogram in figure 9.3F and note that it is not completely against the light value side (right side), although it is quite close. The image contains all the available light values. Everything between the right and left sides is exposed quite well, with full detail. A histogram does not have to cover the entire window for the exposure to be correct. When there is a very limited range of light, the histogram may be rather narrow.
The image in figure 9.3F is a relatively bland image with smooth gradations of tone, so it makes a smooth mountain-shaped histogram. This will not occur every time because most images contain quite a bit more color information. Each prominent color will be represented with its own peak on the histogram. The most prominent colors will have higher peaks, and the less prominent colors will have lower or no peaks.
As we progress into images with more color or light information, we’ll see that the corresponding histograms look quite different.
Look at the image in figure 9.3G. This image nearly exceeds the range of the camera’s digital sensor.
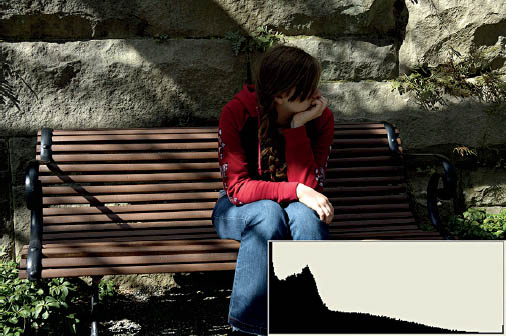
Figure 9.3G – Histogram showing underexposure (dark side)
Notice that, overall, this image is dark and looks underexposed. The histogram is crammed to the left and is clipped. There are no gradual climbs as on a mountain range, from valley to peak and back to valley. Instead, the image shows up on the left side in mid peak.
The most important thing to understand when you see a histogram like the one in figure 9.3G, with part of the peak clipped off on the left, is that some or all of the image is significantly underexposed.
In figure 9.3H a larger aperture was used and more light was allowed in. We can now see much more detail. But once again, the range of light is too great for the sensor to fully capture, and both sides of the histogram display (dark and light) are clipped.

Figure 9.3H – Histogram showing overexposure (right side)
The image in figure 9.3H shows more detail but is not professional-looking and will win no awards. The range of light is simply too great to be recorded fully. Many of the details are overly light, and that can be seen by the clipping of the histogram on the right side. The most important thing to remember is that when you see a histogram that is crammed all the way to the right and clipped, some or all of the image is significantly too light. A portion of the image in figure 9.3H is recorded as pure white and is permanently gone, or blown out.
From the clipping on the left in figure 9.3H, you can see that some dark detail has been lost in the image, too. Looking at the base of the closest trees in the picture, you can clearly see dark shadows with little or no detail. This image simply has too much light range for the camera to record it all. We will discuss what to do about this later in the chapter.
It is important that you try to center the histogram without clipping either edge. This is not always possible, as shown in figure 9.3H, because the light range is often too great and the sensor or histogram window can’t contain it. If you center the histogram, your images will be better exposed. If you take a picture and the histogram is shifted toward the left or right, you can retake the photograph and adjust the exposure.
If there is too much light to allow the histogram to be centered, you must decide which part of the image is more important—the light or dark values—and expose for those values.
How Does the Eye React to Light?
With its imaging sensor and glass lenses, the D500 is only a weak imitation of our marvelously designed eye and brain combination. There are very few situations in which our eyes cannot adjust to the available light range. So, as photographers, we are always seeking ways to record a portion of what our eyes and mind can see.
Since our eyes tend to know that shadows are black, and we expect that, it is usually better to expose for the highlights. If you see dark shadows, that seems normal. We’re simply not used to seeing light so bright that all detail is lost. An image exposed for the dark values will look weird because most highlight detail will be burned out.
Your eyes can see a huge range of light in comparison to your digital sensor. The only time you will ever see light values that are so bright that detail is lost is when you are looking directly at an overwhelmingly bright light, like the sun. In a worst-case scenario, if you expose the image so the right side of the histogram just touches the right side of the histogram window, the image will look more normal.
Since photography’s beginnings, we have always fought with being able to record only a limited range of light. But with the digital camera and its histogram, we can now see a visual representation of the light values. We can immediately review the image, reshoot it emphasizing lighter or darker values, or use a graduated neutral-density filter to hold back part of the light in the scene.
Many of today’s digital photographers prefer to use high dynamic range (HDR) imaging, where multiple images are exposed with different values to capture a much broader range of light. The images are then combined into one image with a much greater range of light displayed.
Computer Adjustment of Images
Looking at the image in figure 9.3I, taken in midday with overhead sunshine, we see an example of a range of light too great to be captured by a digital sensor but exposed in such a way that we can get a usable photo later.
Notice how the dark values are clipped and the dark detail is lost. But look to the right side of the histogram and notice how the light values are not clipped. The camera recorded all of the light values but lost some dark values.
Since our eyes see this as normal, this image looks okay. If we were standing there looking at the cabin ourselves, our eyes would be able to see much more detail in the front porch area. But the camera just can’t record that much light range. If we want to get a bit more detail in the shadows than this image seems to contain, we can do it. Normally, a camera does not give us enough control to add light values on the fly, so we use the histogram to get the best possible exposure and then adjust the image later in the computer. Some cameras can be profiled to capture light ranges more effectively in one direction or the other, but when you push one area, the opposite area must give. So we need a way to take all this light and compress it into a more usable range.
Figure 9.3I – Cabin picture and histogram with correct exposure but dark shadows
We are now entering the realm of post-processing, or in-computer image manipulation. Look at the image in figure 9.3J. This is the same image as figure 9.3I, but it has been adjusted in Photoshop to cram more image detail into the histogram by compressing the midrange values. Notice that the mountain peak of the histogram is farther right, toward the light side, than the histogram for figure 9.3I, and that the whole histogram fits within the histogram window without any clipping. We removed a good bit of the midrange, but since there was already a lot of midrange there, our image did not suffer greatly.

Figure 9.3J – Post-processed cabin picture and its histogram
How this computer post-processing was done is outside the scope of this book, but it is not very difficult. You can use a program or app like Nikon Capture NX-D, Photoshop, Photoshop Elements, Lightroom, Aurora HDR Pro, Photomatix Pro, or other fine graphics/HDR software designed for photographers.
Your digital camera and your computer are a powerful imaging combination—a digital darkroom, where you are in control from start to finish, from releasing the shutter to printing the image. Retreating from philosophy, let’s continue with our histogram exploration.
Notice in figure 9.3J that the histogram edge is just touching the highlight side of the histogram window. If it had been pushed a tiny bit past the right edge and clipped a small amount to get even more detail out of the dark side, the image would not have been damaged too badly or at all, for a reason we will discuss in a moment. Sometimes a very small amount of clipping does not seriously harm the image, especially when you are shooting in RAW mode.
The photographer must be the judge. The greater apparent detail in the image in figure 9.3J is the result of compressing the midrange of the light values a bit in the computer. If you compress or make the midrange light values smaller, that will tend to pull the dark values toward the light side and the light values toward the dark side. It’s like cutting a section out of the middle of a garden hose. If you pull both of the cut ends together, the other two ends of the hose will move toward the middle, and the hose will be shorter overall. If you compress or remove the midrange of the histogram, both ends of the graph will move toward the middle. If one end of the graph is beyond the edge of the histogram window (clipped), it will be less so when the midrange is compressed.
We are simply trying to make the histogram fit into the frame of its window. We can cut out some of the middle to bring both ends into the window because there is usually plenty in the middle to cut out, so the image rarely suffers. Remember, this is done outside of the camera in a computer. You can’t really control the in-camera histogram to compress values, but you need to be aware that it can be done in a computer so that you can expose accordingly with your camera’s histogram. Then you will be prepared for later post-processing of the image. Now that we have compressed the midrange values, figure 9.3J more closely resembles what our eye normally sees, so it looks more normal to us.
Shooting in RAW Can Benefit Your Images
In many cases, your progression from the shooting site to your digital darkroom can benefit if you shoot NEF (RAW) images. A RAW digital image contains an adjustable range of light, in a sense. With a RAW image, you can use controls in Capture NX-D, Lightroom, Photoshop, or even the basic Nikon View NX 2 software included with the D500 to select from the range of light within the big RAW image file. It’s like moving the histogram window to the left or right over all that wide range of RAW image data. You select a final resting place for the histogram window, capture the underlying RAW data, and your image is ready for use.
This is a serious oversimplification of the process, but I hope it is more understandable. In reality, the digital sensor records a wider range of light than you can use in one image. You always have that extra information available to you in a RAW image, but it is thrown away when you shoot or convert to JPEG.
Although you can’t get all of that range into the final image without special processing, it is there in the RAW file as a selectable range. I prefer to think of it as a built-in bracket because it works in a similar way.
In reality—and this is a very important point—the histogram we use in our D500 cameras (and other Nikons) is based on a camera-processed JPEG file.
Therefore, when you are shooting in RAW mode, there is a little more headroom for clipping on the dark and light sides of the histogram than what the histogram window shows. You can over- and underexpose by a slight amount when shooting in RAW mode and still pull out good detail, whereas the detail would be gone had you been shooting in JPEG mode.
In my experience with the D500, the dark detail contains a lot of information that can be recovered, with a little added noise as a penalty. The bright values do not have quite the same amount of headroom, so be careful not to seriously overexpose your images or nothing will recover the light detail.
Using Active D-Lighting for Expanded Dynamic Range
Interestingly, the Active D-Lighting function on the D500 is a good example of what I mean by there being extra detail available in a RAW file. Where do you suppose Active D-Lighting gets its detail? From the extra headroom in the RAW sensor data, of course. A JPEG file especially benefits from Active D-Lighting in many cases.
When you have Active D-Lighting turned on, the JPEG is created from RAW sensor data, with expanded dynamic range from Active D-Lighting applied as the JPEG file is created and saved to the memory card. The D500 is especially powerful when it comes to using Active D-Lighting. It is the first digital camera I have ever used where I will leave this function turned on most of the time. It does a marvelous job at extending the range of light your images can contain.
Highlights Blink Mode
There are also other Monitor viewing modes that you can use along with the histogram, such as the Highlights (blink) mode for blown-out highlights (see Playback Menu > Playback display options and put a check mark next to Highlights [page 31]).

Figure 9.3K – The Highlights blink mode
The blink mode will cause your image to flash from light to dark in the blown-out highlight areas, as seen in the white background of my Big Ben clock picture in figure 9.3K.
This white-to-black blinking is a rough representation of a histogram in which the highlight value is clipped, and it is quite useful for quick shooting. Using your camera’s light meter, histogram, and Highlights (blink) mode together is a powerful way to control your exposures.
Why Master the Histogram?
If you master using the histogram, you will have a fine degree of control over where you place the light range of your images. This is sort of like using the famous Ansel Adams black-and-white Zone System, but it is represented visually on the Monitor of your D500.
The manipulation of histogram levels in-computer is a detailed study in and of itself. It’s part of having a digital darkroom. Learn to use your computer to tweak your RAW images, and you’ll be able to produce superior results most of the time. Even more important, learn to use your histogram to capture a nice image in the first place!
Your histogram is simply a graph that lets you see at a glance how well your image is contained by your camera. If it’s too far left, the image is too dark; if it’s too far right, the image is too light. If clipped on both ends, there is too much light for one image to contain. Learn to use the histogram well and your images are bound to improve!
Settings Recommendation: The camera’s light meter should be used to get the initial exposure only. Then you can look at the histogram to see if the image’s light range is contained within the limited range of the sensor. If the histogram is clipped to the right or the left, you may want to add or subtract light with the +/− Exposure compensation button or use Manual mode. Let your light meter get you close, then fine-tune with the histogram.
Author’s Conclusions
This camera certainly gives you a lot of choices for light meters and exposure modes. You can start using this camera at whatever level of photographic knowledge you have. If you are a beginner, use the P mode. If you want to progress into partial automation, use the S or A mode. And if you are a dyed-in-the-wool imaging enthusiast, use the M mode for full manual control of the camera. You have a choice with the D500!
The next chapter is about a subject of great importance to digital photographers— white balance (WB). Understanding WB gives you an edge over other photographers. Learning about the histogram and white balance will place you in a spot occupied by relatively few people. When you have mastered those two subjects and learned about color spaces, you will indeed be an advanced digital photographer. Let’s proceed!