When testing a WinDbg script for the CARE system[75] (the script enumerates all files on a Windows PC and processes memory dumps to generate a log file with the out-put of debugger commands) we found that after successful processing of many files the next launched WinDbg instance suddenly showed this message box:
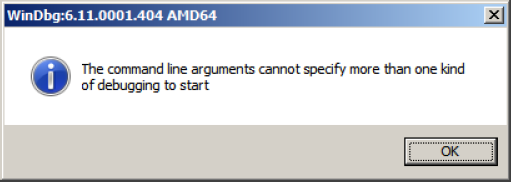
To find out, we attached another WinDbg instance to its process in order to examine the real command line. In this small case study instead of using kb WinDbg command to show a stack trace and its arguments we employ kn, .frame and kb <lines> commands for visual clarity and to illustrate stack trace frame navigation. In the failed WinDbg instance that had just started we see only one thread showing Message Box pattern (Volume 2, page 177):
0:000> ~*kn

.  0  Id: dc8.fb4 Suspend: 1 Teb: 000007ff`fffdc000 Unfrozen
 # Child-SP          RetAddr           Call Site
00 00000000`0025d4b8 00000000`76fc5118 USER32!NtUserWaitMessage+0xa
01 00000000`0025d4c0 00000000`76fc5770 USER32!DialogBox2+0x261
02 00000000`0025d540 00000000`7701000d USER32!InternalDialogBox+0x134
03 00000000`0025d5a0 00000000`7700f2b8 USER32!SoftModalMessageBox+0x9fb
04 00000000`0025d6d0 00000000`7700eb17 USER32!MessageBoxWorker+0x314
05 00000000`0025d890 00000000`7700ea10 USER32!MessageBoxTimeoutW+0xb3
06 00000000`0025d950 00000001`3f9016a6 USER32!MessageBoxW+0x4c
07 00000000`0025d990 00000001`3f90175c WinDbg!TextMsgBox+0x96
08 00000000`0025d9d0 00000001`3f9017d7 WinDbg!FormatMsgBoxV+0x9c
09 00000000`0025dbe0 00000001`3f9075c7 WinDbg!InfoBox+0x37
0a 00000000`0025dc20 00000001`3f9084f7 WinDbg!ParseCommandLine+0x1a57
0b 00000000`0025dcc0 00000001`3f913739 WinDbg!wmain+0×287
0c 00000000`0025fd80 00000000`7708be3d WinDbg!_CxxFrameHandler3+0×291
0d 00000000`0025fdc0 00000000`771c6a51 kernel32!BaseThreadInitThunk+0xd
0e 00000000`0025fdf0 00000000`00000000 ntdll!RtlUserThreadStart+0×1d
We see the frame # 0b contains the return address of wmain function (starting point of execution of UNICODE C/C++ programs) that has this prototype:
int wmain(,int argcwchar_t *argv[], wchar_t *envp[]);
We switch to that frame for examination of its first 3 parameters and use kb command that shows stack traces starting from the current frame (we are interested in the top stack trace line only):
0:000> .frame0b 00000000`0025dcc0 00000001`3f913739 WinDbg!wmain+0×287 0:000> kb 1 RetAddr : Args to Child : Call Site 00000001`3f913739b:00000000`00279e10 000007de`a4ecc920 : WinDbg!wmain+0×28700000000`0000000c00000000`00278b60
Because the function prototype shows the second function parameter as an array of wide character null-terminated strings we use dpu command to dump them. We also note that we have only 0xc array members and use this as the length argument for dpu:
0:000> dpu00000000`00278b60Lc00000000`00278b60 00000000`00278bc8 Program FilesDebugging Tools for C: Windows (x64)WinD" 00000000`00278b68 00000000`00278c44 "-y" 00000000`00278b70 00000000`00278c4a "srv*c:ms*http://msdl.microsoft.com/download/symbols;sr" 00000000`00278b78 00000000`00278d0c "-z"00000000`00278b80 00000000`00278d12 "C:MemoryDumpsCSTColorimetricTracing" 00000000`00278b88 00000000`00278d60 "(4).DMP"00000000`00278b90 00000000`00278d70 "-c" 00000000`00278b98 00000000`00278d76 "$$>a<DebuggerLogs.txt;q" 00000000`00278ba0 00000000`00278da6 "-Q" 00000000`00278ba8 00000000`00278dac "-QS" 00000000`00278bb0 00000000`00278db4 "-QY" 00000000`00278bb8 00000000`00278dbc "-QSY"
We see in the output above that "C:MemoryDumpsCSTColorimetricTracing" and "(4).DMP" strings were probably split from one file name "C:MemoryDumpsCSTColorimetricTracing(4).DMP" and this means that we forgot to enclose the file name parameter in double quotation marks when passing it from VB script to WinDbg.
A reader of this anthology sent us a minidump file and a debugger log of an application that had about 300 modules loaded in a process address space. What was interesting is the huge amount of ModLoad / Unload module debugger events in the log prior to an access violation exception. Some modules were loaded / unloaded many times, for example (here we only included lines for just one module but there were many others):
[...]
ModLoad: 16640000 16649000    X:ClientBinModuleA.dll
[...]
Unload module X:ClientBinModuleA.dll at 16640000
[...]
ModLoad: 192b0000 192b9000    X:ClientBinModuleA.dll
[...]
Unload module X:ClientBinModuleA.dll at 192b0000
[...]
ModLoad: 192b0000 192b9000    X:ClientBinModuleA.dll
[...]
Unload module X:ClientBinModuleA.dll at 192b0000
[...]
ModLoad: 161b0000 161b9000    X:ClientBinModuleA.dll
[...]
Unload module X:ClientBinModuleA.dll at 161b0000
[...]
ModLoad: 161e0000 161e9000    X:ClientBinModuleA.dll
[...]
Unload module X:ClientBinModuleA.dll at 161e0000
[...]
ModLoad: 161f0000 161f9000    X:ClientBinModuleA.dll
[...]
Unload module X:ClientBinModuleA.dll at 161f0000
[...]
ModLoad: 161f0000 161f9000    X:ClientBinModuleA.dll
[...]
Unload module X:ClientBinModuleA.dll at 161f0000
[...]
ModLoad: 161f0000 161f9000    X:ClientBinModuleA.dll
[...]
Unload module X:ClientBinModuleA.dll at 161f0000
[...]
ModLoad: 161f0000 161f9000    X:ClientBinModuleA.dll
[...]
Unload module X:ClientBinModuleA.dll at 161f0000
[...]
ModLoad: 161f0000 161f9000    X:ClientBinModuleA.dll
[...]
Unload module X:ClientBinModuleA.dll at 161f0000
[...]
ModLoad: 161f0000 161f9000    X:ClientBinModuleA.dll
[...]
Unload module X:ClientBinModuleA.dll at 161f0000
[...]
ModLoad: 161f0000 161f9000    X:ClientBinModuleA.dll
[...]
Unload module X:ClientBinModuleA.dll at 161f0000
[...]
ModLoad: 171b0000 171b9000    X:ClientBinModuleA.dll
[...]
Unload module X:ClientBinModuleA.dll at 171b0000
[...]
ModLoad: 25180000 25189000    X:ClientBinModuleA.dll
[...]
Unload module X:ClientBinModuleA.dll at 25180000
[...]
ModLoad: 171b0000 171b9000    X:ClientBinModuleA.dll
[...]
Unload module X:ClientBinModuleA.dll at 171b0000
[...]
ModLoad: 171b0000 171b9000    X:ClientBinModuleA.dll
[...]
Unload module X:ClientBinModuleA.dll at 171b0000
[...]
[...]
[...]
ModLoad: 0df60000 0df69000    X:ClientBinModuleA.dll
[...]
Unload module X:ClientBinModuleA.dll at 0df60000
[...]
(f38.560): Access violation - code c0000005 (first chance)
---
--- 1st chance AccessViolation exception ----
[...]
We see the component ModuleA was loaded at different addresses and this looks similar to a singleton object factory with Create / Destroy operations that resembles heap operations Alloc and Free where every allocation can place the same object at a different address. This is why I call all this a component or module heap. The application was COM-based and every domain-specific object was implemented in a separate in-proc COM DLL. There were thousands of such objects.
Most of the time we see an empty field Attached Process in !thread command output:
1: kd> !thread fffffa802c2cfbb0 ff
THREAD fffffa802c2cfbb0  Cid 43b8.470c  Teb: 000007fffffda000 Win32Thread:
0000000000000000 WAIT: (WrQueue) UserMode Non-Alertable
    fffffa802acfc970  QueueObject
    fffffa802c2cfc68  NotificationTimer
Not impersonating
DeviceMap                 fffff88000008e00
Owning Process            fffffa802af8ac10       Image:         winlogon.exe
Attached Process          N/A            Image:         N/A
Wait Start TickCount      428658         Ticks: 3 (0:00:00:00.046)
Context Switch Count      4
UserTime                  00:00:00.000
KernelTime                00:00:00.000
Win32 Start Address RPCRT4!ThreadStartRoutine (0×000007fefea07780)
Stack Init fffffa6029203db0 Current fffffa60292037e0
Base fffffa6029204000 Limit fffffa60291fe000 Call 0
Priority 13 BasePriority 13 PriorityDecrement 0 IoPriority 2 PagePriority 5
Child-SP          RetAddr           Call Site
fffffa60`29203820 fffff800`01a6b9fa nt!KiSwapContext+0×7f
fffffa60`29203960 fffff800`01a6ee94 nt!KiSwapThread+0×13a
fffffa60`292039d0 fffff800`01cd1cd7 nt!KeRemoveQueueEx+0×4b4
fffffa60`29203a80 fffff800`01ca8b2d nt!IoRemoveIoCompletion+0×47
fffffa60`29203b00 fffff800`01a69233 nt!NtRemoveIoCompletion+0×13d
fffffa60`29203bb0 00000000`778c6daa nt!KiSystemServiceCopyEnd+0×13 (TrapFrame @
fffffa60`29203c20)
00000000`017ff9f8 00000000`7769f65c ntdll!NtRemoveIoCompletion+0xa
00000000`017ffa00 000007fe`fea25d0d kernel32!GetQueuedCompletionStatus+0×48
00000000`017ffa60 000007fe`fea25b93 RPCRT4!COMMON_ProcessCalls+0×7d
00000000`017ffaf0 000007fe`fea07769 RPCRT4!LOADABLE_TRANSPORT::ProcessIOEvents+0×133
00000000`017ffba0 000007fe`fea07714 RPCRT4!ProcessIOEventsWrapper+0×9
00000000`017ffbd0 000007fe`fea077a4 RPCRT4!BaseCachedThreadRoutine+0×94
00000000`017ffc10 00000000`7769be3d RPCRT4!ThreadStartRoutine+0×24
00000000`017ffc40 00000000`778a6a51 kernel32!BaseThreadInitThunk+0xd
00000000`017ffc70 00000000`00000000 ntdll!RtlUserThreadStart+0×1d
Below is a stack trace from winlogon.exe deep in win32k.sys. Because csrss.exe is a session-specific user-space counterpart to win32k it makes sense to see it attached:
1: kd> !thread fffffa802b2e6bb0 ff
THREAD fffffa802b2e6bb0 Cid 43b8.74d0 Teb: 000007fffffdc000 Win32Thread:
fffff900c0016690 RUNNING on processor 1
Not impersonating
DeviceMap fffff88000008e00
Owning Process fffffa802af8ac10 Image: winlogon.exe
Attached Process fffffa80174d7040 Image: csrss.exe1: kd> !thread fffffa802bd9f060 ff
THREAD fffffa802bd9f060 Cid 7624.28b8 Teb: 000007fffffdd000 Win32Thread:
fffff900c0016690 RUNNING on processor 0
Not impersonating
DeviceMap fffff88000008e00
Owning Process fffffa802b18d040 Image: winlogon.exe
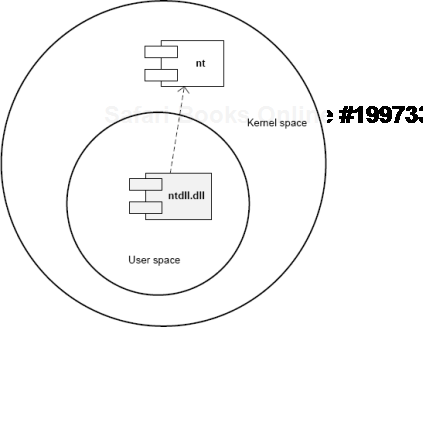
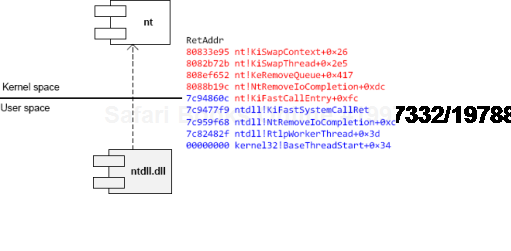
Attached Process fffffa802ad2fc10 Image: csrss.exeSimilar to different C/C++ styles like where to put the right brace we have User/Kernel Space/Mode architecture diagramming styles. Some prefer to put User part on top and some prefer to put Kernel on top. One reader explains the former style as "calling down into the kernel"[76]. Originally we thought about a psychological explanation where we put on top what we value the most or use the most. However, the reason we put Kernel on top is because we value Space over Mode (Volume 4, page 35) in depicting memory and dependencies. In stack traces from complete memory dumps we have kernel portions on top as well. Also, Google and Bing favour "stack grows down" slightly over "stack grows up" (at the time of this writing) and we prefer "down" as well. Additionally, Here are two diagrams where we prefer the first (Kernel on top) with any stack growing down (in address decrement sense) and any stack trace from WinDbg having Kernel on top too:
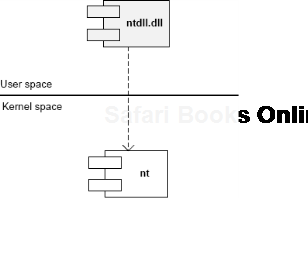
The second diagram has any stack growing up:
We also the following variant (if you write and read from right to left you may prefer its reflection):
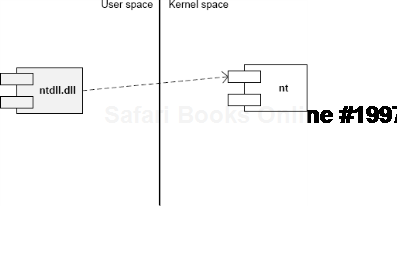
There is another diagram style that is consistent with the traditional depiction of Privilege Mode rings (here Kernel is also on top but can be put in any direction):
