
Azure Diagnostics
Azure offers a free basic monitoring and diagnostics framework that collects data from all kinds of components and services on a virtual machine called Azure Diagnostics. Azure Diagnostics is really more like a log data collector than a complete solution, as it does not offer any user interface to view the data. Some monitoring solutions and tools use the data collected from Azure Diagnostics to provide log analysis and alerting and other features.
To get started with Azure Diagnostics, we only need to install the Azure Diagnostics extension on a VM. This can be dynamically applied to a VM at any given time. We can enable the diagnostics extensions through
• CLI tools
• PowerShell
• Azure Resource Manager
• Visual Studio 2013 with Azure SDK 2.5 and higher
• Azure Portal. The diagnostics extension is turned on by default if a VM is created through the portal.
![]() Note
Note
The diagnostics extension for Windows contains the Windows diagnostics agent and the diagnostics extension for Linux contains the Linux diagnostics agent. The Linux diagnostics agent is open source and available on GitHub. https://github.com/Azure/WALinuxAgent.
When we enable the extension through any of the methods mentioned previously, the Linux diagnostics agent is installed on the host VM. As part of the installation, the extension also installs rsyslog, which is important for data logging. Figure 7.3 illustrates the basic components and data flow.

To enable the Linux diagnostics agent, we need to pass in a configuration that contains a collection plan. The collection plan defines what metrics need to be collected and where to store the data. The data is usually stored in an Azure storage account from which it can be consumed by any client.
As we focus on Docker and Linux in this book, we will not discuss monitoring on Windows. Please see https://msdn.microsoft.com/en-us/library/azure/dn782207.aspx for Windows configuration details.
The following example shows how to collect a core set of basic system data (CPU, Disk, and Memory) and all rsyslog information on a Linux virtual machine.
• Create a file named PrivateConfig.json with the following content:
{
"storageAccountName":"the name of the Azure storage account
where the data is being persisted",
"storageAccountKey":"the key of the account"
}
• Run the following command from the CLI:
azure vm extension set vm_name LinuxDiagnostic Microsoft.
OSTCExtensions 2.* --private-config-path PrivateConfig.json
After we have applied the extension, it takes about 5 minutes for the Linux diagnostics agent to be operational. This is very different from a monitoring container, as a container would spin up in almost a matter of seconds and start transferring data.
The Linux diagnostics agent creates the following tables in the storage account specified in the PrivateConfig.json:

Figure 7.4 shows the LinuxCPU table with data.


Figure 7.5 shows the LinuxDisk table with data.


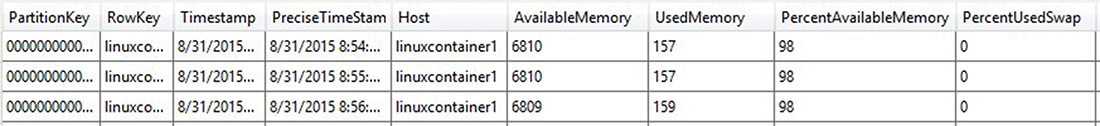
Figure 7.6 shows the LinuxMemory table with data.
What about containers? As mentioned before, we can start containers with different log drivers. If we start our container using the syslog-log driver, and the application writes its logs to STDOUT and STDERR, the data is transferred to the LinuxsyslogVer2v0. (The suffix Ver2v0 is the data schema version.)
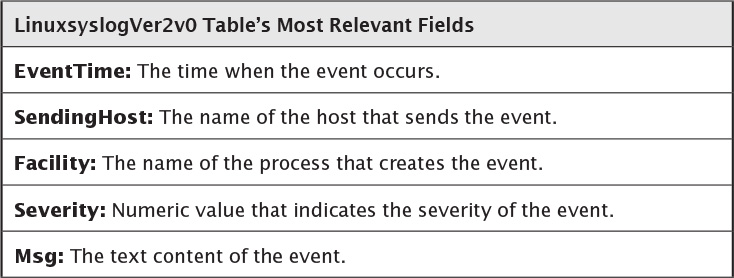
Figure 7.7 shows log entries from a microservice inside a container, as well as from the containers itself. The value of the facility field is “daemon” as it refers to the Docker daemon that is logging the message. The Msg field contains the log entry itself, starting with the container ID that looks like “docker/e15bca350018.”

![]() Using the Syslog Driver
Using the Syslog Driver
Start a container using the syslog driver: $ docker run -d --log-driver=syslog [myimage]
At the time of writing, the Azure Linux diagnostics agent is certainly a very basic way to collect microservices and container log data. One of the reasons for this is that it stores all log data in one table and does not offer a column to filter based on container ID or name. Another drawback is that Azure table storage might not be the best solution for high-throughput logging requirements due to its indexing limitations. That said, Azure Diagnostics is certainly a good starting point for testing logging strategies and potentially small microservices-based applications. The following Azure website offers more details on the Linux Diagnostics extension and its configuration options: https://azure.microsoft.com/en-us/documentation/articles/virtual-machines-linux-diagnostic-extension/.