
Syntax. AVERAGE(number1,number2,...)
Definition. This function returns the average (arithmetic mean) of the arguments. To calculate the average, the interval-scaled variables are added and then divided by their number.
Arguments
number1 (required) and number2 (optional). At least one and up to 255 arguments (30 in Excel 2003 and earlier versions) for which you want to calculate the average
Note
Arguments can be numbers, names, arrays, or references containing numbers. If an array or a reference argument contains text, logical values, or empty cells, those values are ignored. However, cells with the value 0 are included.
Background. The arithmetic mean is the best known mean value and is widely accepted among nonstatisticians. Because the mean value can easily be calculated based on all values, it plays an important role in inferential statistics.
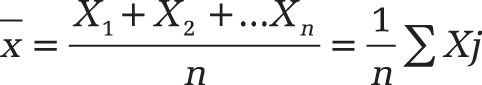
To calculate the mean value, the values in a range are added and the sum is divided by the number of values. The calculation of the arithmetic mean requires the interval scale. The formula to calculate the arithmetic mean is:
The common mean can be calculated from the arithmetic mean of two data sets.
The biggest disadvantage of the arithmetic mean is that extreme values are important because all values are included. Also, the central tendency might be at a location with only a few or no observed values.
For grouped values, the arithmetic mean is only an estimate and cannot be calculated for continuous variables when no additional information regarding the estimate of the central tendency exists.
Although the calculation of the arithmetic mean requires a metric scale, the mean values for ordinal scaled data can also be calculated. This includes sets of data such as those that consist of the answers to questions regarding customer satisfaction with certain services. This is allowed because a normal distribution of the data can be assumed if the samples are sufficient and a confidence interval is indicated by the actual mean value of a distribution. The mean value and variance of a sufficient sample (n > 30) are required.
For data that allows the calculation of the arithmetic mean, the mode and median can also be calculated. The best of the three measures of central tendency to use depends on the question. Mean value, mode, and median use different information and usually also have different number values. Although the arithmetic mean is the most common measure of central tendency, it might be necessary to use the mode or median because of the low scale or outliers.
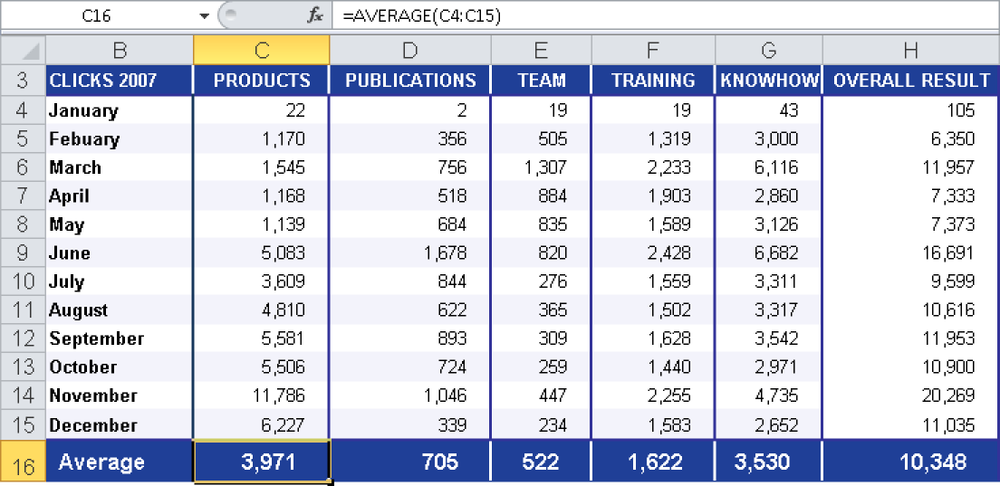
Example. You are the marketing manager of the software company and have to calculate the average visits per webpage in 2007. Based on this evaluation, the company is able to see which areas are visited the most and to improve the areas that have fewer visitors.
Assume that you have imported the data from your system into an Excel file. With a PivotTable, you can easily calculate and analyze the visits of the individual areas. You are interested in the Products, Publications, Team, Training, and Knowledge areas as well as in the overall result. You calculate the average visits for each area by using the AVERAGE() function to see the popularity of the single areas. As you can see in Figure 12-2, the Products area has far more visits than the Publications area.
Note
If you used the TRIMMEAN() function instead of AVERAGE(), the result for the average visits of the Products area would be higher because a certain percentage of the values might not be used in the calculation of the mean value of the data set. This percentage is subtracted from the beginning and the end of the data set.
You can also calculate the average website visits for all areas within a year to get an overview of the entire website’s activity. If you have the comparative values from the previous year, you can further analyze the data.
Note
To calculate the mean value from discontiguous ranges, separate the ranges with a comma, as in AVERAGE(range1,range2,...range n).
Remember that a function can have a maximum of 255 arguments (30 in Excel 2003). To select multiple discontiguous ranges, hold down the Ctrl key while clicking the cells.