
Syntax AVERAGEIF(range,criteria,average_range)
Definition. This function calculates the average of all cells in a range that meet a specified criterion.
Arguments
range (required). One or more cells to average, including numbers, names, arrays, or references that contain numbers.
criteria (required). The criteria—in the form of a number, an expression, a cell reference, or text—that define which cells are averaged.
average_range (optional). The actual set of cells to average. If average_range is not specified, range is used.
Note
Cells in range that contain TRUE or FALSE are ignored.
If a cell in average_range is an empty cell, AVERAGEIF() ignores it. If range is empty or is a text value, AVERAGEIF() returns the #DIV0! error.
If a cell in criteria is empty, AVERAGEIF() treats it as a 0 value. If no cells in the range meet the criteria, AVERAGEIF() returns the #DIV0! error.
You can use the wildcard characters ? (question mark) and * (asterisk) as criteria. The question mark stands for a character and the asterisk for a string. If you want to search for an actual question mark or asterisk, enter a tilde (~) before the character.
Average_range does not have to be the same size and shape as range. The actual cells that are averaged are determined by using the upper-left cell in average_range as the beginning cell and then including cells that correspond in size and shape to range.
Background. You will find more information about the average in the description of AVERAGE().
The AVERAGEIF() function measures the central tendency that is the location of the center of a group of numbers in a statistical distribution. For the AVERAGEIF() function, you can specify a criterion that is determinative for the calculation of the mean value.
The three most common measures of a central tendency are:
Average: the arithmetic mean of the distribution
Median: the middle value in a group of numbers
Mode: the most frequently occurring number in a group of numbers
For a symmetrical distribution of a group of numbers, these three measures of a central tendency are identical. For a skewed distribution of a group of numbers, the measures can be different.
Example. As a software company, your company has to market its software. Among other things, you send regular email messages with information about your products. Usually you promote your software by sending a newsletter for each product, to reduce the content and to evaluate the click rate on your website after a mailing is sent.
Assume that you have collected the data for the past 30 months and have a list with the number of clicks and the mailing types for each month (see Figure 12-5).
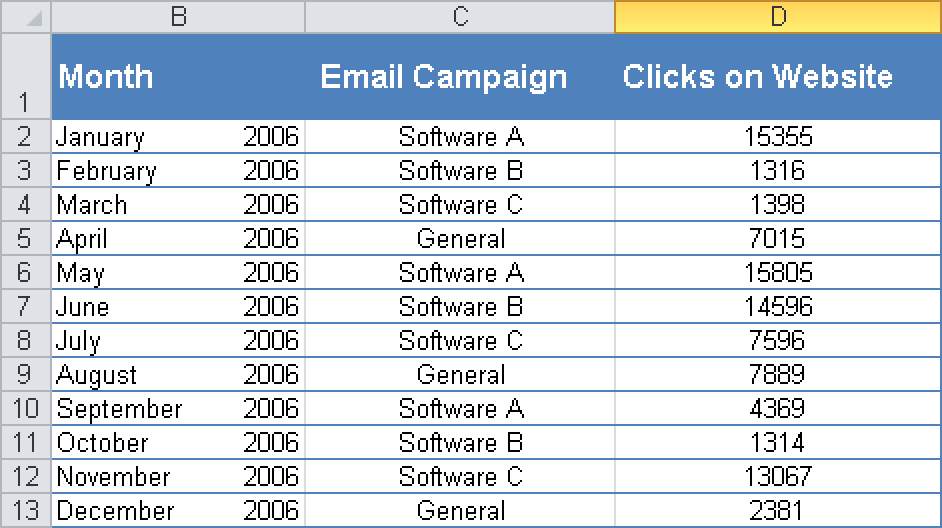
You want to know the average click rate on your website after the different mailings. The question is: What is the mean value of the click rate for the Software B mailing? For this you use the AVERAGEIF() function.
As you can see in Figure 12-6, the formula uses the following arguments:
criteria: This is cell range C2:C30 because this column contains the criteria on which the evaluation is based.
range: Software B is specified as range, because you only want to know the mean value of the click rate after this mailing was sent.
average_range: This is cell range D2:D30 because for these cells the mean value is calculated based on the specified criterion.

You can make the following statements from the results: For the past 30 months, the average click rate after the Software B mailing is 7157.57. If you calculate the average click rate for the Software A, Software C, and General mailings, as well as the normal mean value, the result shows that the average click rate after the Software A mailing is the highest (see Figure 12-7). This means that your customers are most interested in this software.
