
Syntax. CHISQ.TEST(actual_range,expected_range)
Definition. This function returns the test statistic of a χ2-test for independence. CHISQ.TEST() returns the value from the chi-squared (χ2) distribution for the statistic and the appropriate degrees of freedom. You can use c2-tests to determine whether hypothesized results are verified.
Arguments
actual_range (required). The range of data that contains observations to test against expected values
expected_range (required). The range of expected observations
Note
If actual_range and expected_range have a different number of data points, the function CHISQ.TEST() returns the #N/A error.
The c2-test first calculates a c2-statistic by using the following formula:
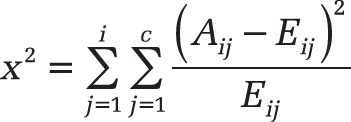
where
Aij = actual frequency in the i-th row, j-th column
Eij = expected frequency in the i-th row, j-th column
Σ = number of rows
Σ = number of columns
A low value of i c2 is an indicator of independence. As you can see in the formula, c2 is always positive or 0 and is 0 only if Aij = Eij for every i,j.
CHISQ.TEST() returns the probability that a value of the c2-distribution that is at least as high as the value calculated by the preceding formula could have happened by chance, assuming independence.
To calculate this probability, the CHISQ.TEST() function uses the c2-distribution with the appropriate number of degrees of freedom (df):
If r is greater than 1 and c is greater than 1, then df = (r – 1)(c – 1).
If r is equal to 1 and c is greater than 1, then df = c – 1.
If r is greater than 1 and c is equal to 1, then df = r – 1.
r = c = 1 is not allowed and
#N/Ais returned.
The CHISQ.TEST() function is most useful when expected values are not too small. Some statisticians suggest that each Eij should be greater than or equal to 5.
Background. The chi-square test provides a method for testing the association of variables in a two-way table. The null hypothesis assumes that there is no association, whereas the alternative hypothesis assumes that some association exists, although that alternative hypothesis is not any more specific than this. The chi-square test measures the divergence of the observed values in the two-way table from those that would be expected using the null hypothesis (no association). The two-way table of expected values can be calculated from the row and column totals.
The CHISQ.TEST() function returns the test for independence, comparing the existing values with the expected values.
The significance level, with a number value from 0 through 100 percent, indicates the level of confidence in the hypothesis test. A significance of 90 percent doesn’t mean that:
The probability for the existing data to be random is only 10 percent.
A certain fact has a probability of 90 percent to be true.
The significance level indicates the percentage of allowed errors for a sample to still be considered random.
Example. You are a manufacturer of vitamins and want to test whether the regular use of Vitamin C reduces the risk of catching colds. You took two samples from the same population, where 22 of the 936 participants had a cold. The first sample contains the expected values, and the second sample contains the observed values.
In the first step, you want to determine the significance level of the values to check whether the samples are random and the values are similar. You use the CHISQ.TEST() function, as shown in Figure 12-22.
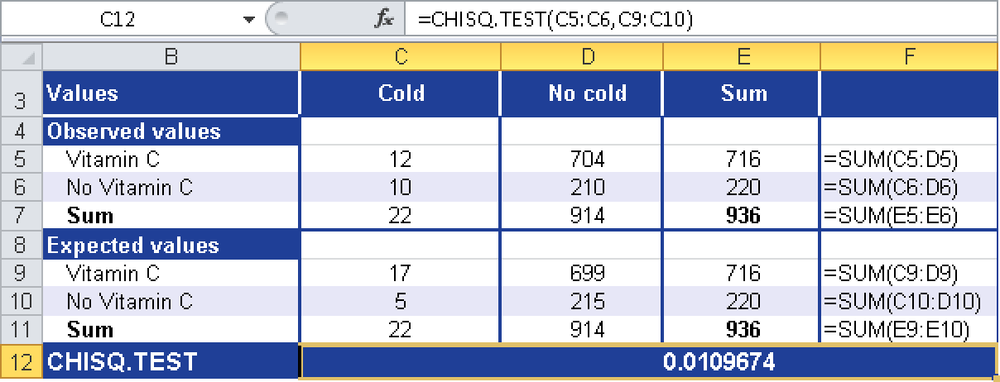
The calculated significance level of 1 percent indicates that the observed and existing incidence numbers in 99 percent (100 minus 1) of the cases show comparable characteristics. This suggests that the samples are random; that is, that the sample taken does not differ significantly from what you would expect with the level of colds and the incidence of Vitamin C use in the population.
The value calculated by CHISQ.TEST() can also indicate the probability for a calculated v. The variable v is a statistical indicator that characterizes a measure of the total deviation.
To calculate the variable, use the following formula:
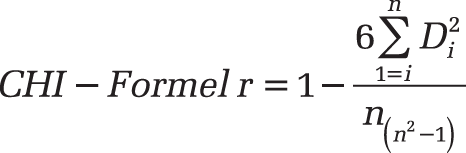
If the value for the statistic n is very high, the null hypothesis is rejected. If the probability for v is lower than the corresponding significance level, the difference is significant. This means that the alternative hypothesis is assumed. If the probability for v is higher, the difference is not significant and the null hypothesis is assumed.