Note
In Excel 2010, the COVAR() function was replaced with the COVARIANCE.P() and COVARIANCE.S() functions to increase the accuracy of the results. To ensure the backward compatibility of COVARIANCE.P() and COVARIANCE.S(), the COVAR() function is still available.
Syntax. COVAR(array1,array2)
Definition. This function returns the covariance of two value pairs. Use the covariance to determine the relationship between two data sets. For example, you can examine whether the increase in online orders is related to the number of website visits. To calculate the covariance, the deviations of all value pairs between the actual value and the mean is multiplied and the mean is formed.
Arguments
array1 (required). The first cell range of integers
array2 (required). The second cell range of integers
Note
The arguments must be numbers, names, arrays, or references that contain numbers. If an array or reference argument contains text, logical values, or empty cells, those values are ignored. However, cells with the value 0 are included.
If array1 and array2 have a different number of data points, COVAR() returns the #N/A error. If array1 or array2 is empty, the function returns the #DIV/0! error.
Background. The covariance describes the correlation between the two characteristics x and y with the terms positive and negative. This means that the direction of the dependency between the two characteristics is indicated. The covariance can have any real value.
What conclusions can you draw after the covariance is calculated?
If the covariance is positive, the correlation between x and y is concordant linear. This means that if x has a high value, the value of y is also high. The same applies to low values.
If the covariance is negative, the correlation between x and y is reverse linear. This means that the high values of one random variable are associated with low values of the other random variable.
If the result is 0, there is no correlation between the two variables x and y.
Although the covariance indicates the direction of a correlation between two variables, there is no indication of the strength of the correlation. The reason for this is the dependency of the calculated covariance on the values of variables x and y. If the covariance of two variables is 5.2 meters, the covariance for the same values is 520 centimeters.
Note
The covariance as a measure for the stochastic correlation is not very descriptive and is difficult to compare. To make a correlation comparable, the covariance can be standardized. This way you get a correlation between two or more quantitative statistical variables with a value of +1 (perfect linear correlation), 0 (no linear correlation), and –1 (perfect reverse linear correlation).
You can derive the following important general correlations from the covariance and the two standard deviations:
If n value pairs (x1, y1), (x2, y2),..., (xn, yn) with the standard deviations sx and sy and the covariance sxy are given, then the maximum size of the covariance is the product of the standard deviations.
The upper limit is reached when the dependency between xi and yi is linear with the fixed numbers a and b.
The covariance is calculated as follows:
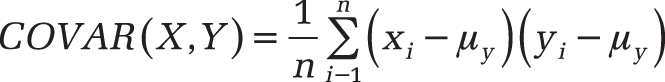
Values x and y are the sample means AVERAGE(array1) and AVERAGE(array2), and n is the sample size.
Example. Let’s use the example of the software company that sells its products through its website and sends out newsletters to boost the sales. Last year, the orders through the website significantly increased. To understand the reason for the increased sales, you calculate the correlation coefficient. Now you want to know the direction of the correlation between website visits and online orders and calculate the covariance. Figure 12-35 shows the result.
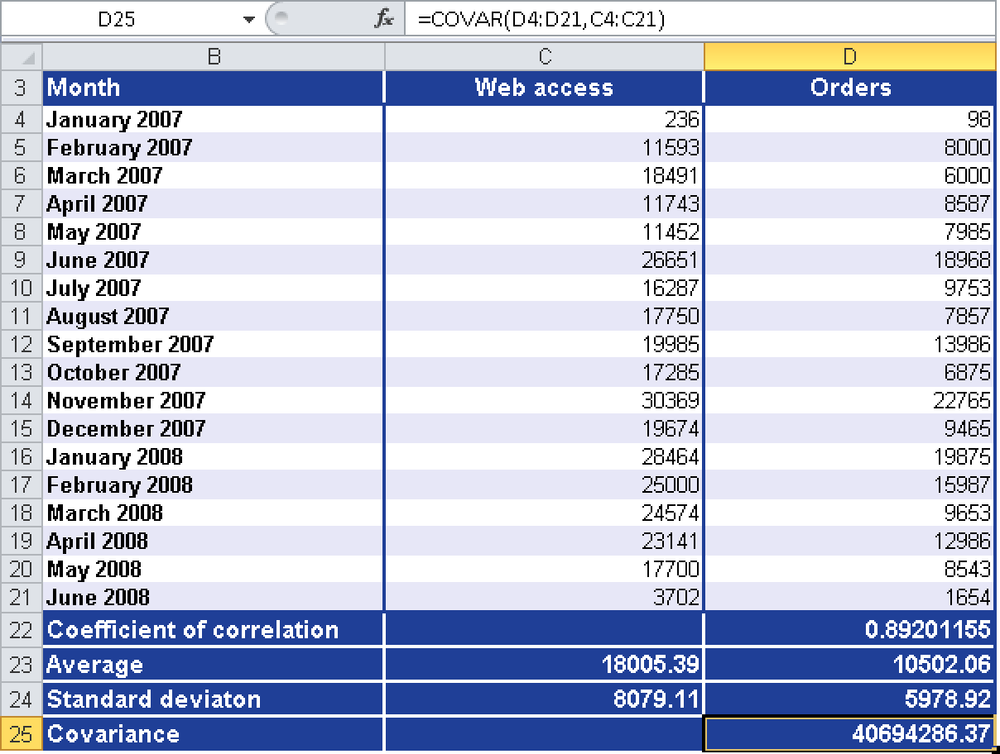
Figure 12-35. The COVAR() function calculates the direction of the dependency between two variables.
The positive result for the covariance indicates that the correlation between the x and y values (website visits and orders) is concordant linear. If x has high values, y also has high values. If x has low values, y has also low values. The positive covariance is confirmed by the correlation coefficient, 0.89, because this indicates a close linear correlation.
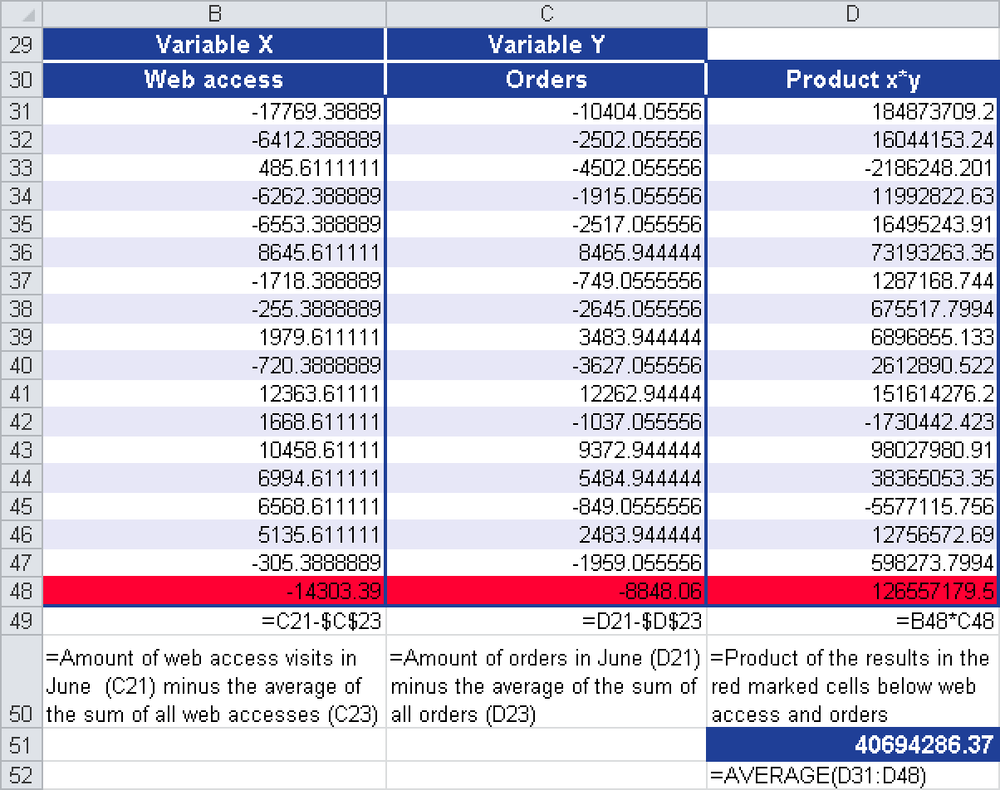
Figure 12-36 shows how you can get the same result by using the formula presented in the “Background” section of this function without the COVAR() function.