
Syntax. INTERCEPT(known_y’s,known_x’s)
Definition. This function returns the intersection of the regression line (see Figure 12-124, in the discussion of the SLOPE() function).
The function calculates the point at which a line will intersect the y-axis by using existing x-values and y-values. The intercept point is based on the best-fit regression line drawn through the known x-values and known y-values.
Arguments
known_y’s (required). The dependent set of observations or data
known_x’s (required). The independent set of observations or data
Note
Arguments can be numbers, names, arrays, or references containing numbers. If an array or a reference argument contains text, logical values, or empty cells, those values are ignored. Note that cells with the value zero are included.
If known_y’s and known_x’s contain a different number of data points or no data points, the INTERCEPT() function returns the #N/A error value.
Background. Regression analysis is one of the most commonly used multivariate analysis methods. When single-regression is used, the relationship between dependent and independent variables is analyzed. Correlations must be determined in a linear function. The function finds a straight line between the two sets of values such that the sum of the squared deviations of values from this line is minimized.
This straight line is referred to as a regression line or level and provides information about statistical relations between variables and the proportionality factor. So the regression line determines the direction of the relation between the dependent and the independent variables. Furthermore, it shows the degree of the proportional changes in the dependent variable if the independent variable is increased or reduced by one unit.
The INTERCEPT() function calculates the y-axis intercept of the regression line—where the x-value is 0. This is the value b in the equation of the line:
y = mx + b
The equation can be rearranged to express the intercept b as:
b = y – mx
where the slope m is calculated as:
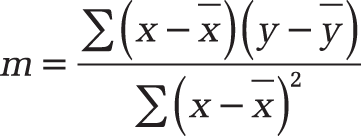
In this equation, x and y are the average values of a sample AVERAGE(X_values) and AVERAGE(Y_values).
See Also
You will find more information about regression analysis in the discussion of the LINEST() function.
Example. The INTERCEPT() function is easy to use. Assume that a software company wants to analyze its website traffic. The marketing department has imported the website visit and order data for January 2007 through June 2008 into an Excel table.
The company wants to investigate whether the number of orders placed is dependent upon the number of visits to the website. A graph of the data can be drawn and the intercept of the line of best fit calculated. The intercept defines the intersection of the regression line with the y-axis (orders) (see Figure 12-79).
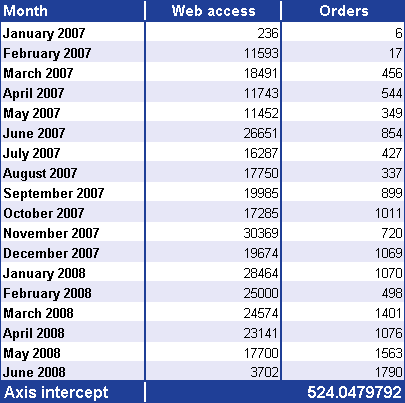
The orders (dependent y-values), website visits (independent x-values), and intercept (b) are illustrated in Figure 12-80.
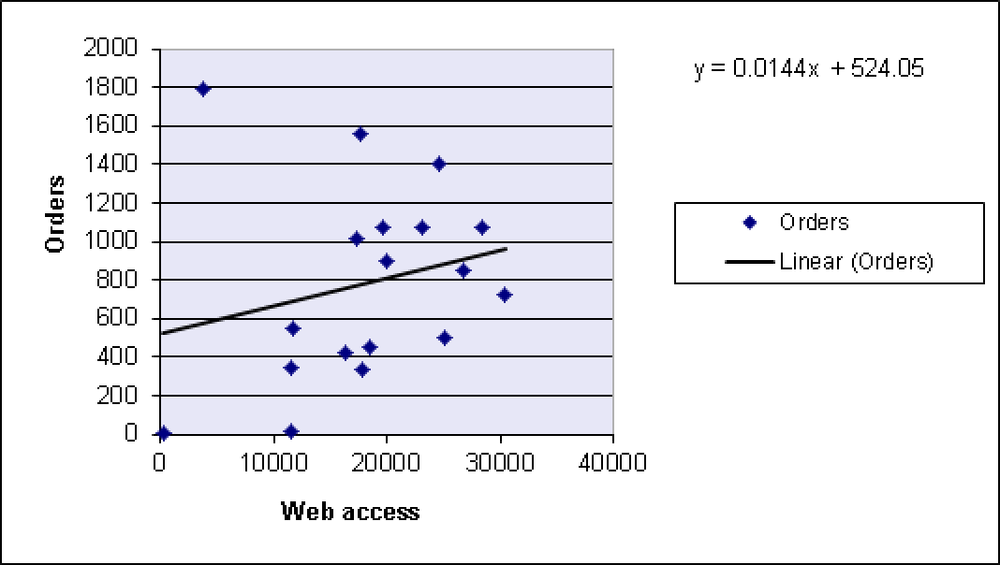
If you plot the orders against the web visits in a scatter plot and then insert a linear trend line for the data points, the equation of the line of best fit will automatically provide the intercept with the value 524.05, the value that was calculated by the INTERCEPT() function.