
Syntax. MEDIAN(number1,number2,...)
Definition. The median is the number in the middle of a set of numbers. This means that half of the numbers have values that are greater than the median, and half of the numbers have values that are smaller than the median. Therefore, the number of the median within a sorted data set equals half of the elements.
Arguments
number1 (required) and number2 (optional). At least one and up to 255 arguments (30 in Excel 2003 and earlier versions) for which you want to calculate the median.
Note
Arguments can be numbers, names, arrays, or references containing numbers. All numbers associated with a reference or array argument are evaluated. If an array or reference argument contains text, logical values, or empty cells, those values are ignored. However, cells with the value 0 are included.
If there is an even number of values in the data set, MEDIAN() calculates the mean of the two numbers in the middle.
Background. The median is the mean value in a data set.
If there is an odd number of values in the data set, the median is an observed value. If there is an even number of values in the data set, the MEDIAN() function calculates the average of the two numbers in the middle.
If the data set contains classified values, the median is in the class in which the sum function exceeds 0.5. In this case, the median has to be estimated or calculated with a linear interpolation. To calculate the median, the ordinal scale is required and the observed values have to be sorted by size.
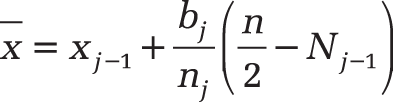
Although the median is easy to understand, it is not as common as the arithmetic mean or the mode. The formula for the median is:
Contrary to the mean, the median doesn’t depend on outliers. For example, you can use the median to calculate the average duration of study without taking career students and other outliers into account.
The median is especially useful when marginal values are of little importance or might lead to false interpretations when using the arithmetic mean. The median also returns a better result than the average if there is a low number of characteristics to be evaluated.
Another feature of the median is its low sensitivity. You can replace values in the given data set with other values without affecting the median.
You can calculate the common median of two statistical distributions by combining the medians of both data sets. You have to merge the data sets, sort the data sets, and recalculate the median.
A generalization of the median is the quantile. The median divides the distribution in half, and the quantile divides the distribution in several equal parts. Most common is the quartile (four parts). As for the median, the ordinal scale is required, and the observed values have to be sorted by size.
Example. Suppose you are the manager of the software company’s marketing department and you want to evaluate the website for the past year. The evaluation includes all clicks in all website areas. Now you want to calculate the median to get the mean value in this data set for the website visits in the past twelve months.
This example calculates the median from the two mean values in the data sets, because the number of elements is even (see Figure 12-96).
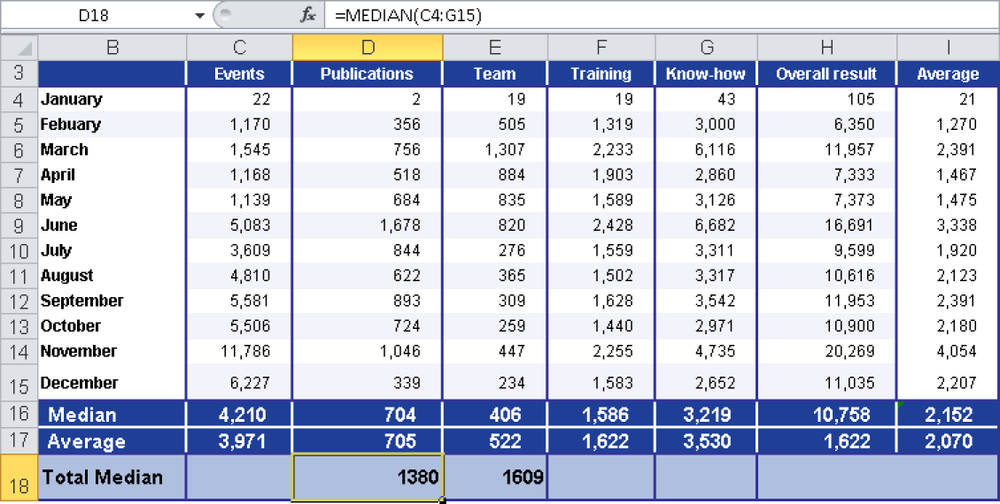
If you sort the events, you can see that the means are July (3,609) and August (4,810). These two values are added by the MEDIAN() function and divided by 2. The result is a median of 4,210. If the example included a 13th month, the median would be the seventh value in the sorted data set.