
Syntax. MODE.SNGL(number1,number2,...)
Definition. This function returns the most frequent value of a data group. The result of the function is the characteristic that most often occurs in a data set.
Arguments
number1 (required) and number2 (optional). At least one and up to 255 arguments (30 in Excel 2003 and earlier) for which you want to calculate the mode. You can also use an array or a reference to an array instead of arguments separated by commas.
Background. The MODE.SNGL() function returns the most frequently occurring or repetitive value in an array.
Assume that two ranges contain certain data where half of the data has a low value and the other half has a high value. In this case, the AVERAGE() and MEDIAN() functions return the mean value, whereas MODE.SNGL() returns the most frequently occurring value.
Example. You are the sales manager of the software company and want to evaluate the number of visits your sales representatives made in different regions numbered 1 through 5: Texas, Virginia, California, Oregon, and Washington. You have already created a table (see Figure 12-99).
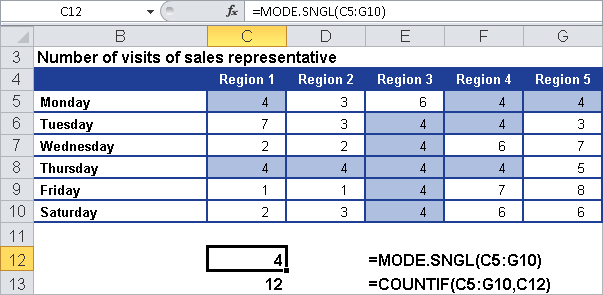
You want to know how many visits were usually necessary before a contract was signed. For this you use the MODE.SNGL() function.
Most of the time, it took four visits to get to the point where the customer signed the contract. If you nest the COUNTIF() and MODE.SNGL() functions, you can also count the number of modes in the range.
You can format the cells that contain a mode by using conditional formats. In Excel 2003, select range C5:G10 and then select Format/Conditional Formatting; in Excel 2007 or Excel 2010, click the Conditional Formatting button in the Styles group on the Home tab (see Figure 12-100).
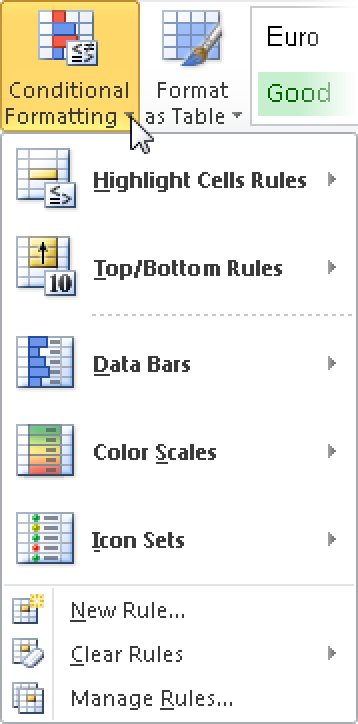
Select Formula Is For Condition 1, and enter the formula =MODE.SNGL($C$5:$G$10)=C5. Note that absolute and relative references are mixed. Click the Format button, select a color, and click OK. The modes in the range are displayed in the selected color.