
Syntax. STDEV.P(number1,number2,...)
Definition. This function calculates the standard deviation based on the population. All values have to be specified as arguments. The standard deviation is a measure of how widely values are dispersed from the average value (the mean).
Arguments
number1 (required) and number2 (optional). At least one and up to 255 arguments (30 in Excel 2003 and earlier versions) corresponding to a population. You can also use a single array or a reference to an array instead of arguments separated by commas. Logical values (TRUE and FALSE) and text are ignored. If you want to include logical values and text in the calculation, use the STDEVA.P() function.
Note
The STDEV.P() function assumes that its arguments are the entire population. If your data represents a sample of the population, calculate the standard deviation with STDEV.S(). For large sample sizes, the STDEV.S() and STDEV.P() functions return approximately equal values.
The calculated standard deviation for a sample isn’t an estimate of the standard deviation of the population. This means that it is divided by n instead of by n–1.
Background. Because the only difference between STDEV.P() and STDEV.S() is that STDEV.P() doesn’t calculate the standard deviation based on a sample but based on the entire population, this example focuses on STDEV.P().
STDEV.P() uses the following formula:
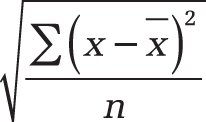
The value x is the sample mean AVERAGE(number1,number2,...), and n is the sample data set.
Example. Let’s get back to the website evaluation of the software manufacturer (see Figure 12-133).
Note
The data to be evaluated includes the entire population. This means that the website has been available for only 18 months and that all of the visits of the past 18 months are recorded. The calculation with STDEV.P() and STDEV.S() is based on the population of the data from January 2007 to June 2008.
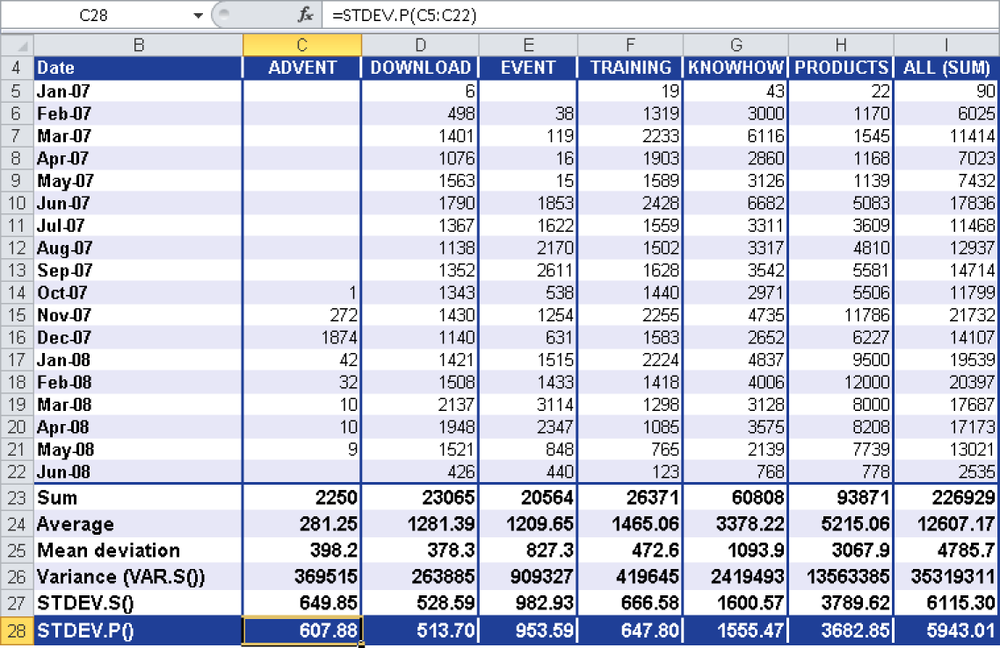
Figure 12-133. Based on a population, the STDEV.P function returns a different result than the STDEV.S function that assumes a sample of the population.
Therefore, the STDEV.P() and STDEV.S() functions, which use different formulas, also return different results.
If you take a closer look at the PRODUCTS area, you can make the following statement: The result of 3,682.85 indicates the variance around the mean. This means that the clicks are higher or lower by 3,682.85 than the mean.
If you square the value calculated by STDEV.P(), you get the result from VAR.P().