
Syntax. STDEVPA(value1,value2,...)
Definition. This function calculates the standard deviation based on a population indicated as arguments, including text and logical values. The standard deviation is a measure of how widely values are dispersed from the average value (the mean).
Arguments
value1 (required) and value2 (optional). At least one and up to 255 values (30 in Excel 2003 and earlier versions) corresponding to a population. You can also use a single array or a reference to an array instead of arguments separated by commas.
Note
The STDEVPA() function assumes that its arguments are the entire population. If your data represents a sample of the population, calculate the standard deviation with STDEVA().
Arguments that contain TRUE evaluate to, 1 and arguments that contain text or FALSE evaluate to 0. If you do not want to include logical values and text in the calculation, use the STDEV.P() function.
For large sample sizes, STDEVA() and STDEVPA() return equal values.
The calculated standard deviation for a sample isn’t an estimate of the standard deviation of the population. This means that it is divided by n instead of by n–1.
Background. Because the standard deviation was already explained in detail in the description of STDEV(), this section focuses on the example.
STDEVPA() uses the same formula as STDEV.P():
X is the sample mean AVERAGE(value1,value2,...) and n is the sample data set.
Example. For STDEVPA() we use the same example as for the STDEVA() function. In this example, the software company had the following problems with its website:
In March 2007 and September 2007, a problem with website hosting occurred and in both months the website was not available. These months are marked with the string “hostingproblems”.
In February 2008, the content pages of the training area were changed to include the entire area. Because external access to the training area wasn’t possible, this month is marked with the logical value FALSE.
For May 2008, the website visits were not counted. Because the website was accessed, this month has the logical value TRUE.
Note
As for STDEV.P(), the data to be evaluated includes the entire population. This means that the website is only available for 18 months and all of the visits of the last 18 months are recorded.
As you can see in Figure 12-136, the STDEVPA() function returns a different result than STDEV.P(). This happens because STDEVPA() includes text and logical values. In this example, the text values and the logical value FALSE are set to 0, and the logical value TRUE is set to 1.
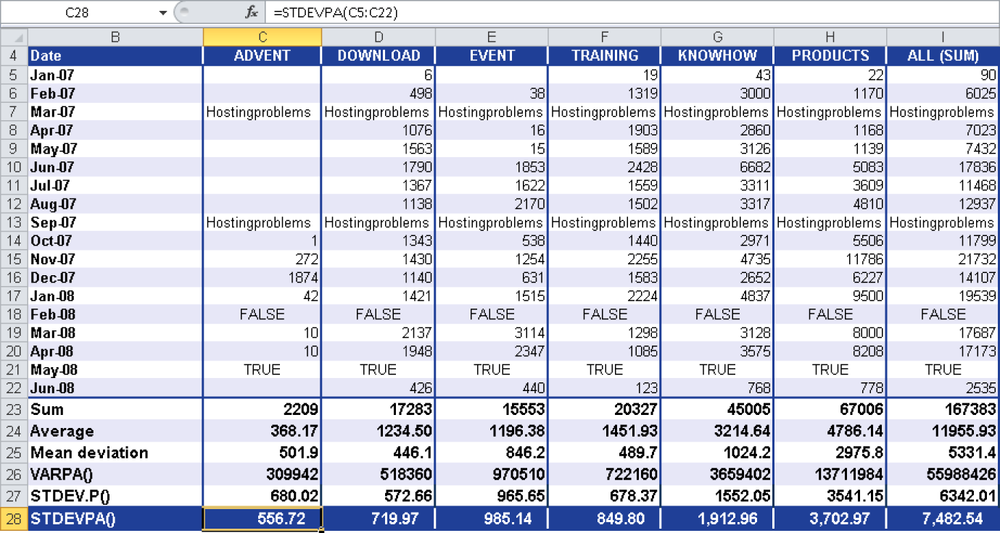
Figure 12-136. Because text and logical values are included, the STDEVPA()function returns a different result than the STDEV.P() function.
If you take a closer look at the PRODUCTS area, you can make the following statement: The result of 3,702.97 indicates the variance around the mean based on a population and including text and logical values. This means that the clicks are higher or lower by 3,702.97 than the mean.