
Note
In Excel 2010, the TDIST() function was replaced with the T.DIST.2T() function and the T.DIST() and T.DIST.RT() functions were added to increase the accuracy of the results. To ensure the backward compatibility of T.DIST.2T(), the TDIST() function is still available.
Syntax. T.DIST.2T(x,degrees_freedom)
Definition. This function returns the values of a distribution function (1 alpha) of a Student’s t-distributed random variable. The t-distribution is used to test hypotheses for small sample data sets. Use this function instead of a table of critical values for the t-distribution.
Arguments
x (required). The distribution value (quantile) for which you want to calculate the probability
degrees_freedom (required). An integer indicating the number of degrees of freedom
Note
If one of the arguments isn’t a numeric expression, the T.DIST.2T() function returns the #VALUE! error.
If degrees_freedom < 1, the function returns the #NUM! error. If x < 0, the function returns the #NUM! error.
Background. The T.DIST.2T() function calculates the significance level (alpha risk) of a t-distributed random variable. The probability of a hypothesis is evaluated based on the significance level.
See Also
You will find more information about t-distributed random variables in the description of T.TEST().
The calculation of the significance level gets interesting if you calculate the critical value for the sample and then calculate the significance level for this critical value by using the T.DIST.2T() function. Using the result returned by the T.DIST.2T() function, you can determine if the null hypothesis is valid.
Example. The compatibility of a drug is examined in a clinical study. One test group takes the normal daily dosage and the other test group takes an increased dosage at the beginning of the study. One person has to cancel the test early for private reasons. The goal is to determine whether the increased dosage accelerates the healing process. The duration of treatment is calculated in days.
The null hypothesis indicates that there is no difference in the two test groups regarding the success of treatment. The alternative hypothesis indicates that the second group recovered faster because the method of treatment is more efficient than the usual treatment.
You run a two-tailed, type 2 t-test; that is, you compare the mean of two independent samples. You want to calculate the significance level for the critical value of the samples to evaluate the hypotheses based on the result. Therefore you use the T.DIST.2T() function. Figure 12-139 shows the calculation of T.DIST.2T().
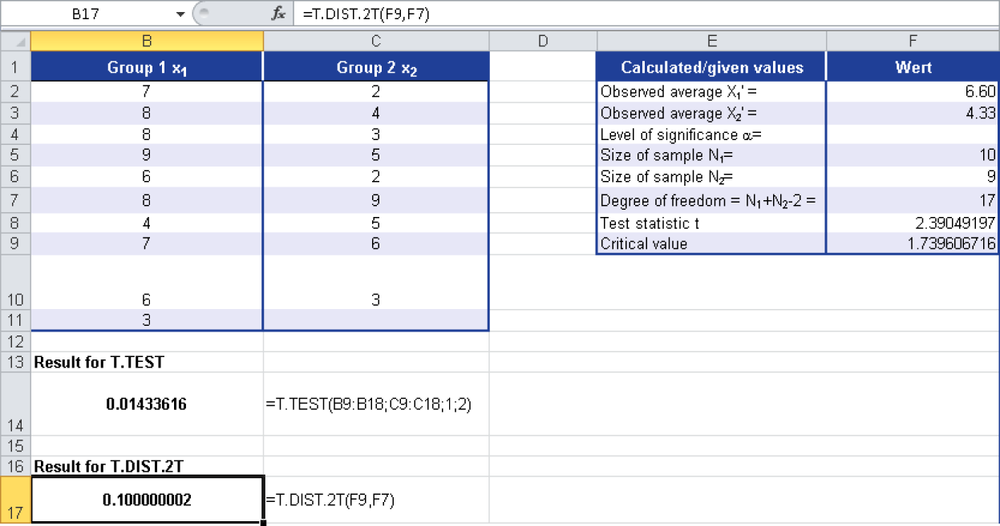
Because T.DIST.2T() returns a probability value, the result is 10 percent. Now you can assume with a 10 percent probability that the null hypothesis is valid. Because the probability is minor, the null hypothesis has to be rejected.