Syntax. TREND(known_y’s;known_x’s;new_x’s;const)
Definition. This function returns values along a linear trend. TREND() fits a straight line (using the method of least squares) to the known_y’s and known_x’s arrays. The function returns the y-values along that line for the specified array of new_x’s.
Arguments
known_y’s (required). The y-values you already know from the relationship y = mx + b:
If the known_y’s array consists of a single column, then each column in the known_x’s array is interpreted as a separate variable.
If the known_y’s array consists of a single row, then each row in the known_x’s array is interpreted as a separate variable.
known_x’s (optional). The x-values you already know from the relationship y = mx + b:
The known_x’s array can include one or more sets of variables. If only one variable is used, known_y’s and known_x’s can be ranges of any shape as long as they have equal dimensions. If more than one variable is used, known_y’s must be a vector (a range consisting of a single row or column).
If known_x’s is not specified, it is assumed to be the array {1,2,3,...} containing the same number of elements as known_y’s.
The known_y’s and known_x’s arguments must have the same number of rows or columns. If the number of rows (columns) is different, you get the
#REF!error. If one of the y-values is 0 or negative, you get the#NUM!error.
new_x’s (optional). The new x-values for which you want to return the corresponding y-values:
Like known_x’s, the new_x’s argument must include a column (or row) for each independent variable. The known_x’s and new_x’s arguments must have the same number of columns if known_y’s is in a single column. If known_y’s is in a single row, known_x’s and new_x’s must have the same number of rows.
If new_x’s is not specified, it is assumed to be the same as known_x’s.
If both known_x’s and new_x’s are omitted, they are assumed to be the array {1,2,3,...} that contains the same number of elements as known_y’s.
const (optional). A logical value specifying whether to force the constant b to equal 1:
If const is TRUE or omitted, b is calculated normally.
If const is FALSE, b is set equal to 1 and the m-values are adjusted so that y = m^x.
Note
You can use TREND() for polynomial curve fitting by regressing against the same variable raised to different powers. For example, suppose column A contains y-values and column B contains x-values. You can enter x2 in column C, x3 in column D, and so on, and then regress columns B through D against column A.
Formulas that return an array as a result have to be entered as array formulas.
When entering an array constant instead of an argument (such as known_x’s), use commas to separate values in the same row and colons to separate rows.
Background. If you know that different values are interdependent, you can make a prediction based on the known values.
Excel provides numerous statistical functions you can use to calculate trends. Statistical functions calculate a line or curve based on known values. If you extend the time axis, you can view the future values. The known values are analyzed and described with a formula that allows extrapolation of the values. However, the data set has to be sufficient to compensate for seasonal variation. Other unforeseeable factors that impact the trend can also cause problems.
For example, consider the case in which a competitor realizes huge sales with a new product in your region. Because the regression analysis assumes that the data can be approximated with a mathematical function, Excel provides many of these functions, including TREND().
Use the TREND() function to calculate a linear trend or to analyze known values. The values are entered into a formula and allow you to predict future trends.
The y-values and x-values are the values from y = mx + b where the intercept b indicates the intercept of the line with the y-axis and slope m indicates by how much the y-value changes if an x-value changes.
If values always change by a certain value, a linear trend exists.
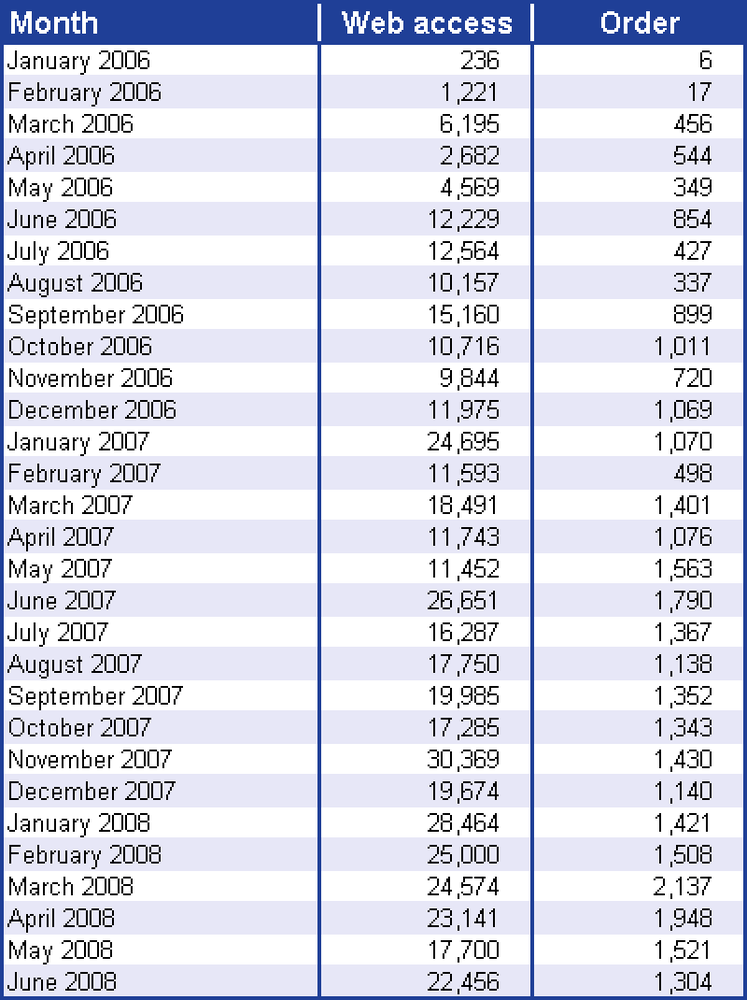
Example. You are the marketing manager of a software company and analyze the company’s website. Recently the website visits as well as the online orders have increased significantly. Because you want to know the future trend of the two components, you use the TREND() function to calculate the future values to predict the estimated number of website visits and online orders.
The website visits and orders until June 2008 are shown in Figure 12-145.
You create a chart from the values generated so far to view the linear trend of the website visits and the online orders, including the equations and the value calculated for r2 (see Figure 12-146).
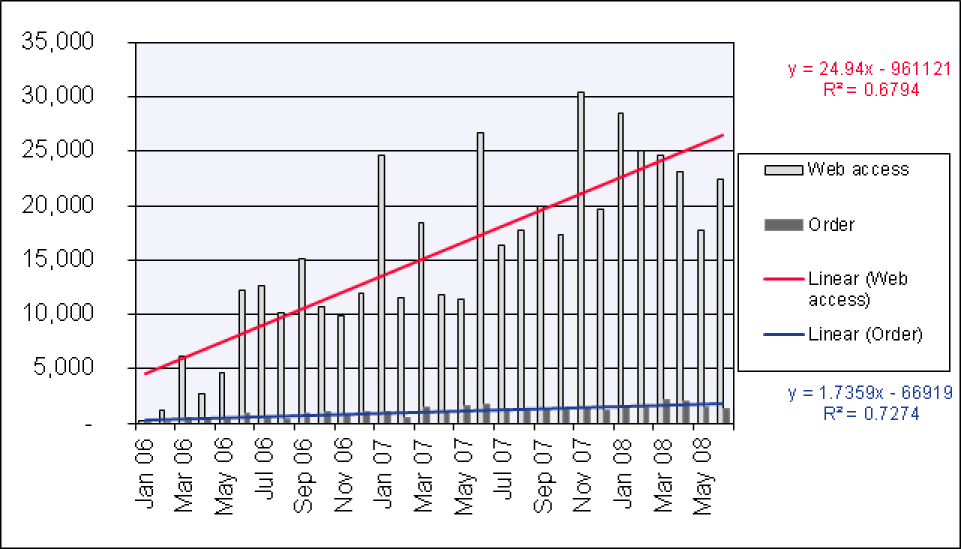
The linear trend line and the associated function indicate that the orders increase by 52.872 per month. This means about 53 new orders per month. Now you want to know the trend of the website visits and online orders from July 2008 through March 2009.
The TREND() function provides the following arguments to calculate the website visits in the next nine months:
known_y’s = website visits between January 2008 and June 2008
known_x’s = months (January 2006 through June 2008)
new_x’s = months from July 2008 through March 2009
const = TRUE (the constant b of the equation y = mx + b is calculated normally)
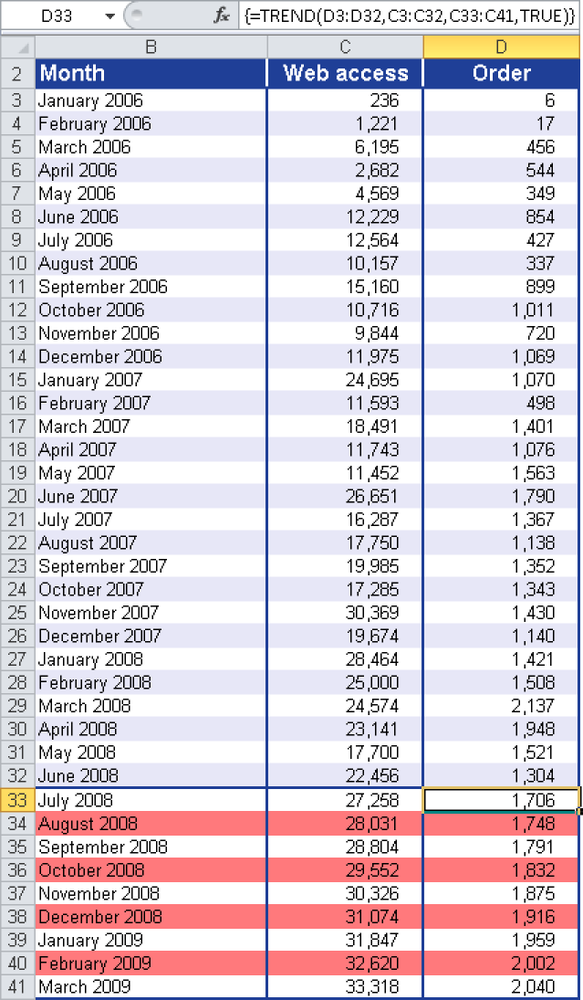
Figure 12-147 shows the result.
Note
Remember, the TREND() function is an array function when it is calculating the values for cell range C33:C41. This means that the function immediately returns the result for all months. Therefore, you have the select cell range C33:C41, enter the formula, and press Ctrl+Shift+Enter.
You can recognize array functions by the braces in the formula bar (see Figure 12-147).
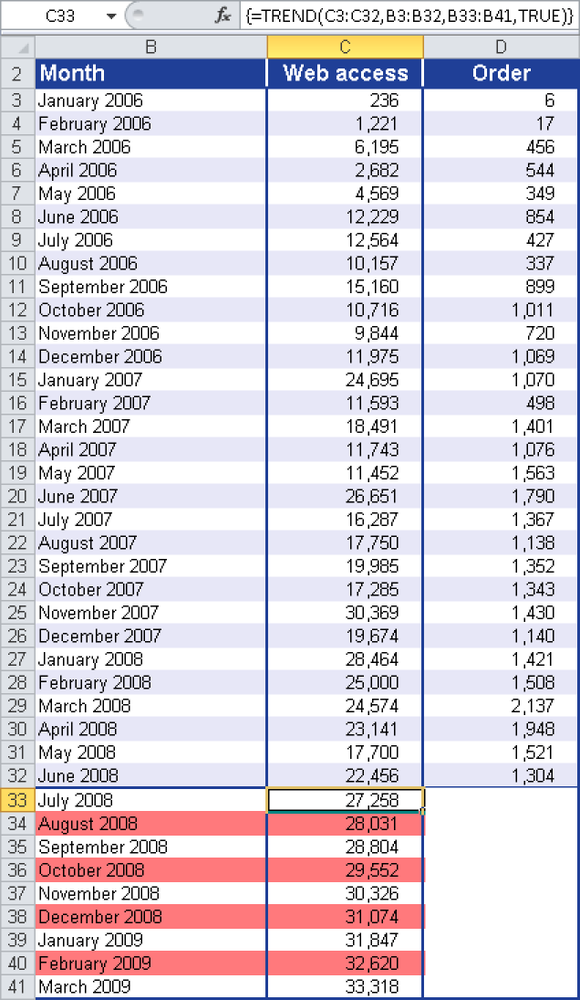
By using the same procedure, you can calculate the values for the online orders based on the calculated trend values for website visits. Figure 12-148 shows the result and the arguments of the TREND() function. With the TREND() function, Excel allows for a good prognosis of the website visits and online orders, assuming that the previous exponential trend continues.