
Syntax. VAR.S(number1,number2,...)
Definition. This function estimates the variance based on a sample. VAR.S() indicates how the data are distributed around the mean.
Arguments
number1 (required) and number2 (optional). At least one and up to 255 arguments (30 in Excel 2003 and earlier versions) corresponding to a sample of the population
Note
The VAR.S() function assumes that its arguments are a sample of the entire population. If the data passed as arguments is a population, calculate the associated variance with the VAR.P() function.
Logical values (TRUE and FALSE) and text are ignored. If you want to include logical values and text in the calculation, use the VARA() function.
Background. The most commonly used spreads in statistics are the variance and the standard deviation. The variance indicates the deviation of a random variable x from the expected value E(x). In other words, the variance is the average of the squared deviation of a single value divided by the number of values. The result is also called empirical variance.
The following variances exist:
Variance of a random variable. The average squared deviation of characteristics in the population. The function to use is VAR.P().
Sample variance. Variance of observed values from a sample of a population. This variance is used in descriptive statistics to measure the spread of data. In inferential statistics, this variance estimates the unknown variance in a population. The function to use is VAR.S().
If the evaluated data is a sample, the sum of the squared deviations is not divided by the number of values (n) but by the number minus one (n – 1). VAR.S() uses the following formula:
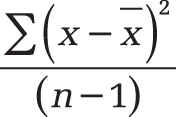
The value x is the sample mean AVERAGE(number1,number2,...), and n is the sample data set. Note that because of the squaring, the extreme value might have a higher weight.
The disadvantage of the variance is that it uses a unit other than the data (squared units). Therefore, the standard deviation defined as the square root of the variance is often used.
Example. Because the sample variance measures the spread of data, it is often used in descriptive statistics. The marketing department of the software company uses the VAR.S() function to create a detailed evaluation of the website visits. The goal is to get more accurate information and to improve the individual areas.
Note that the data to be evaluated is a sample. This means that although the website has existed for a long time, the calculation with VAR.S() and VARA() is based on the data from 18 months (January 2007 through June 2008).
As you can see in Figure 12-151, the marketing department calculated the variance as well as the mean and the average deviation.
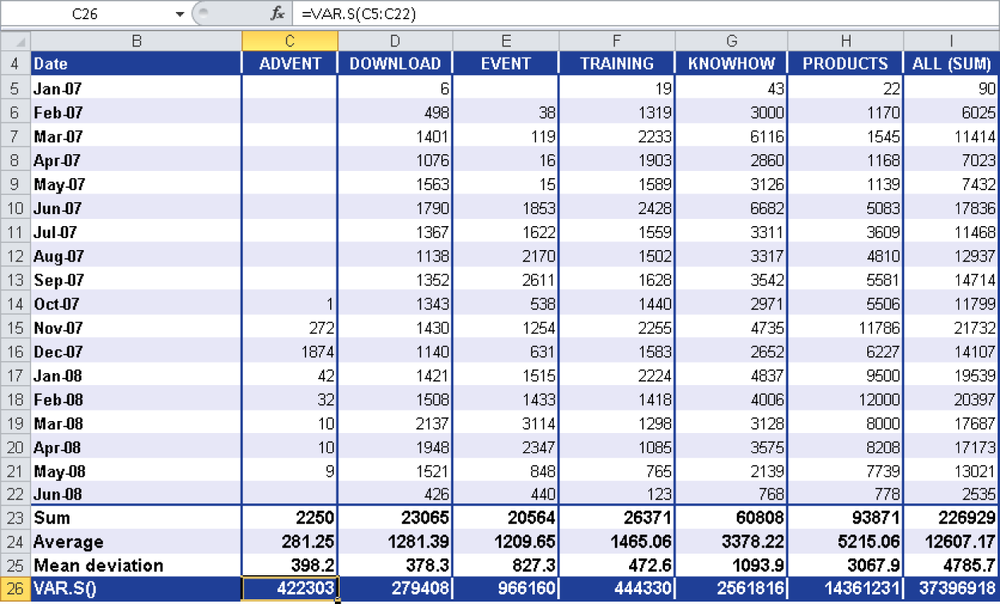
If you take a closer look at the DOWNLOAD area, you can make the following statement: The average squared deviation of the values from the arithmetic mean is 279,408 for the DOWNLOAD area.