
Syntax. VARPA(value1,value2,...)
Definition. This function calculates the variance based on the population. Not only numbers but also text and logical values (TRUE and FALSE) are included in the calculation.
Arguments
value1 (required) and value2 (optional). At least one and up to 255 value arguments (30 in Excel 2003 and earlier versions) corresponding to a population
Note
The VARPA() function assumes that its arguments are the entire population. If your data represents a sample of the population, you have to calculate the variance with VARA().
Arguments that contain TRUE evaluate to 1, and arguments that contain text or FALSE evaluate to 0. If you do not want to include logical values and text in the calculation, use the VARP() function.
Background. Because the variance was already explained in detail in the description of VAR.S(), this section focuses on the example.
VARPA uses the same formula as VAR.P():
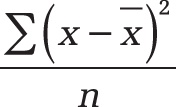
The value x is the sample mean AVERAGE(value1,value2,...), and n is the sample data set.
Example. For VARPA() we use the same example as for the VARA() function. In this example, the software company had the following problems with its website:
In May 2007 and August 2007, a problem with website hosting occurred, and in both months the website was not available. These months are marked with the string “hostingproblems”.
In March 2008, the content pages of the product area were changed to include the entire area. Because external access to the product area wasn’t possible, this month is marked with the logical value FALSE.
As you can see in Figure 12-153, the VARPA() function returns a different result than VAR.P(). This happens because VARPA() includes text and logical values. Because this example uses text and the logical value FALSE, both values are set to 0.
Note
As for VAR.P(), the data to be evaluated includes the entire population. This means that the website has been available for only 18 months and that all the visits of the last 18 months are recorded.
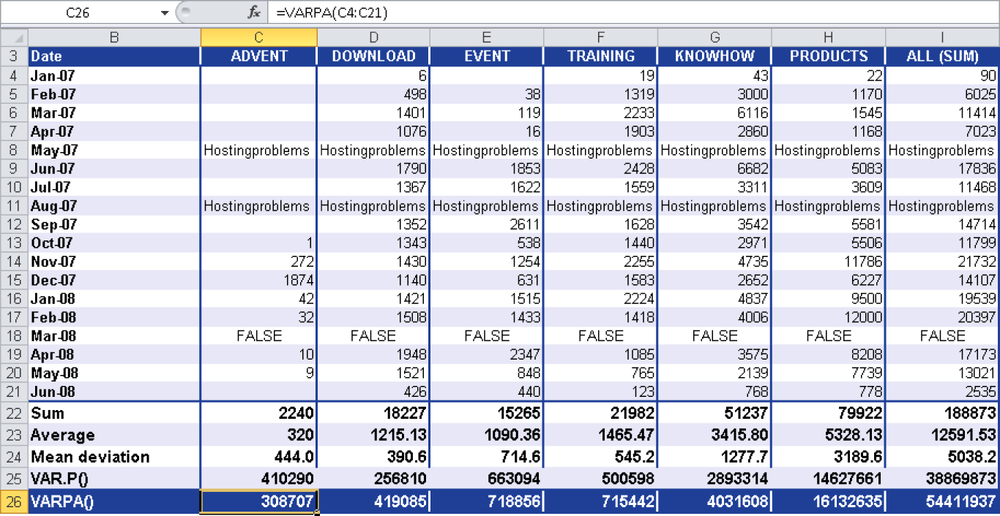
Figure 12-153. Calculating the variance based on the entire population, including text and logical values.
If you take a closer look at the DOWNLOAD area, you can make the following statement: The average squared deviation of the values from the arithmetic mean based on the population and including text and logical values is 419,085 for the DOWNLOAD area.