
Syntax. DSUM(database,field,criteria)
Definition. This function adds the numbers in a column in a list or database that match the specified conditions.
Arguments
database (required) The cell range that makes up the list or database
field (optional) Indicates which column is used in the function
criteria (required) The cell range containing the field names and the filter criteria
Background. Use the DSUM() function to sum a list of values matching a specific criteria. DSUM() can calculate the sum of data with criteria matching a lot of conditions.
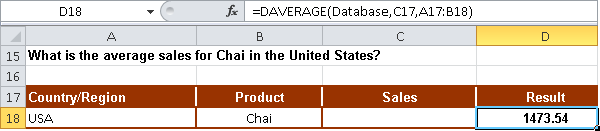
Example. The sales order database contains many orders for your wholesale company. Suppose you want to know the total sales of orders for a particular product in a particular country that are larger than the average. You start by calculating the average sales for Chai in the United States by using the DAVARAGE() function, as shown in Figure 13-25.
See Also
You will find more information about the mean in the description of AVERAGE() in Chapter 12.
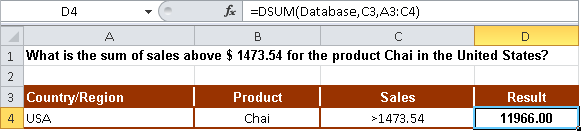
You can use the DSUM() function to calculate the sum of the sales orders with values greater than the mean. This means that you calculate the sum of the sales based on the following criteria:
Country/Region = USA
Item name = Chai
Sales = >$1473.54
Figure 13-26 shows the solution.
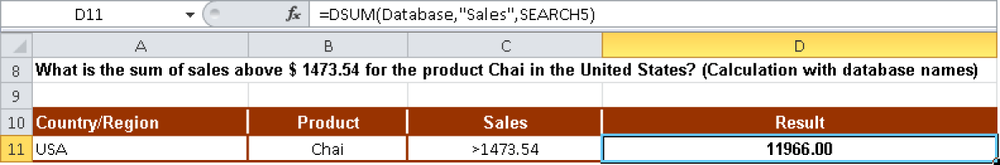
The database argument uses the dynamic range A1:F7008, which has the name Database.
See Also
Dynamic names are explained in detail in the section titled Dynamic Database Names in Chapter 2.
You get the same result if you enter the name SEARCH5 for the criteria range (A10:C11 in Figure 13-27) and specify “Sales” instead of cell C10 for the field argument. Remember to enclose the field name, Sales, in quotation marks.
Until now you have used only the AND condition for the criteria, but you can also specify the OR condition. Assume that you want to calculate the standard deviation for the total sales of Chai in the United States based on a sample (see Figure 13-28).
See Also
You will find more information about standard deviations in the description of STDEVP() in Chapter 12.
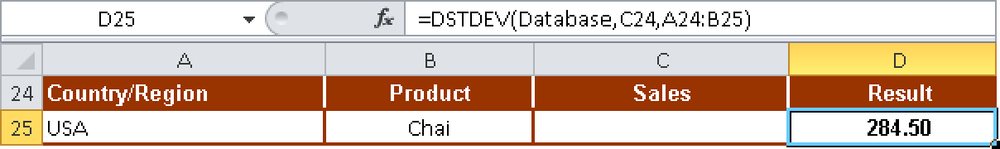
The sales of Chai in the United States has a standard deviation of $284.50 around the mean ($1,473.54).
Now you want to calculate the sum of the sales outside the mean plus or minus one standard deviation. You are calculating the sum of the sales orders at the extremes of the distribution, both at the top end and the bottom end.
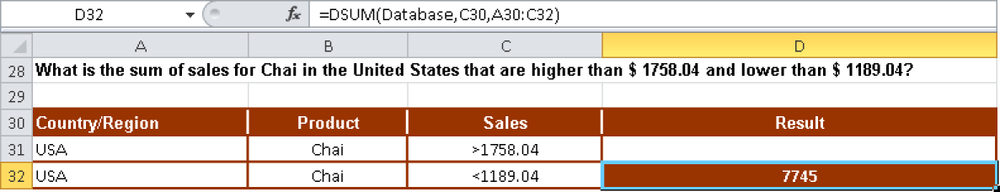
So you want to add the sales that are either above the mean plus one standard deviation or below the mean minus one standard deviation. The following conditions have to be met:
Country/Region = USA AND
Item name = Chai AND
Sales = >1758.04 $ (mean plus standard deviation)
OR
Country/Region = USA AND
Item name = Chai AND
Sales = <1189.04 $ (mean minus standard deviation)
Figure 13-29 shows the result.
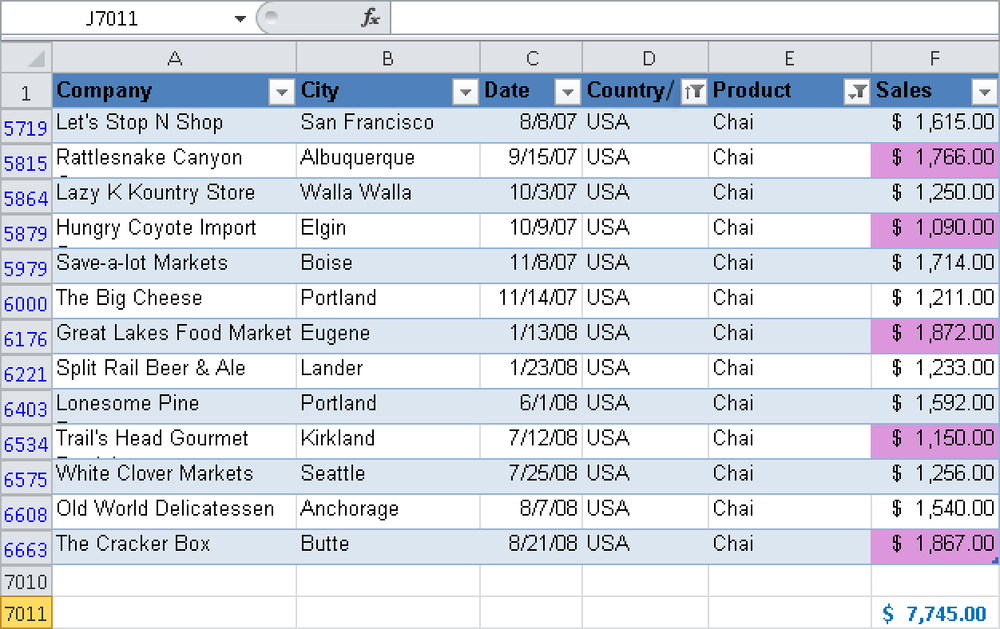
If you investigate this further, you can see that there are only five sales of Chai in the United States that match the specified criteria, which summed to the value of $7,745.00 (see Figure 13-30).
Database functions allow you to analyze the sales based on criteria linked with an AND or OR condition.