
Statistics is the science of using methods to handle quantitative information (data). However, most people associate the word statistics with extensive tables and graphics illustrating (or sometimes concealing) diverse facts, for example, about demographic groups, economic activities, diseases, or environmental impacts.
But that is only part of the field of statistics, sometimes called descriptive statistics. Statistics are used to illustrate extensive data as well as to summarize large quantities of information with a few simple measures, such as average and variance.
Data is collected for many purposes. Often the data consists of random samples from a larger (real or hypothetical) population, and this is used to form generalized statements for the entire population, taking into account random variations in the sample values.
Analytical statistics is based on probability models and principles derived from probability theory. Assume that you manage a company and want to find out if it would be more beneficial to invest in extensive advertising or to reduce costs. You want to investigate the revenue based on a chosen strategy. You also want to know the months with the lowest and highest revenues, and you are interested in the correlation between costs and sales.
Here’s another example that almost everyone has come across at some point: How high is the probability of winning the lottery and retiring to the Caribbean?
All of these questions are statistical questions, and Excel can help you find the answers.
For better understanding, this book divides the statistical functions into six areas. The areas and their corresponding functions are introduced in the following sections.
Excel provides several functions for calculating different mean values. Mean values provide a quick review of the available data and are a first step in the analysis. These values help you find the middle value in a list of values.
The mean average or arithmetic mean is one of the most common measures of comparison. Because of its simple calculation and its popularity, the mean average appeals even to nonstatisticians. There are, however, several other average measures that can be utilized, as shown in Table 2-3.
Correlation allows you to consider the relationship between two variables. For example, a manufacturing company may want to evaluate whether further quality tests are justified. Or a company may look at the relationship between sales and advertising. Several correlation and regression measures and tests are available in Excel (see Table 2-4).
Two symmetry statistics are available (see Table 2-5):
The SKEW() function characterizes the degree of asymmetry around the mean. If the data is symmetrically distributed, the mean value, modal value, and median coincide.
The kurtosis of a data group measures the shape and spread of the distribution compared to a normal distribution.
The more the individual data values deviate from the mean, the less representative the mean is of the distribution. The mean value alone is not sufficient to characterize a frequency distribution; you also need to consider to what extent the values deviate from the mean value. For this, you calculate the spread. The functions in Table 2-6 show all types of variance.
Probability calculations are an essential part of statistics. Because you often don’t work with complete populations but only with smaller samples, you have to understand the probability of the derived conclusions. Probability calculations are used to predict study results based on certain assumptions.
Analytical statistics often compare results to determine whether the statistical values of empirically captured data are different. An example is the assessment of the efficacy of pharmaceuticals. The relative frequency of events observed in random experiments is analyzed and used to determine the probability of events. Table 2-7 shows the probability functions available in Excel.
The analysis of statistical data involves a lot of counting. For example, if you analyze a survey, you need to know how many questionnaires were returned. Next, you may count how often single results appear—that is, individual characteristics with the same value. Usually this is called univariate data analysis. To count combinations of characteristics—for example, the sales in a particular district—you need to consider a bivariate distribution. If more variables are added, it becomes a multidimensional or multivariate distribution.
Several tools are available for grouping, consolidating, and analyzing data. Table 2-8 shows the Excel analysis functions.
The range of statistical functions and analyses is extensive, and Excel provides a comprehensive set of tools for analyzing most types of data. Some tools also generate charts in addition to tables.
See Also
Chapter 12, describes the statistic functions in more detail, and has some general statistical overviews as well as a section with practical examples.
The following practice examples show typical calculations that use the statistic functions in Excel.
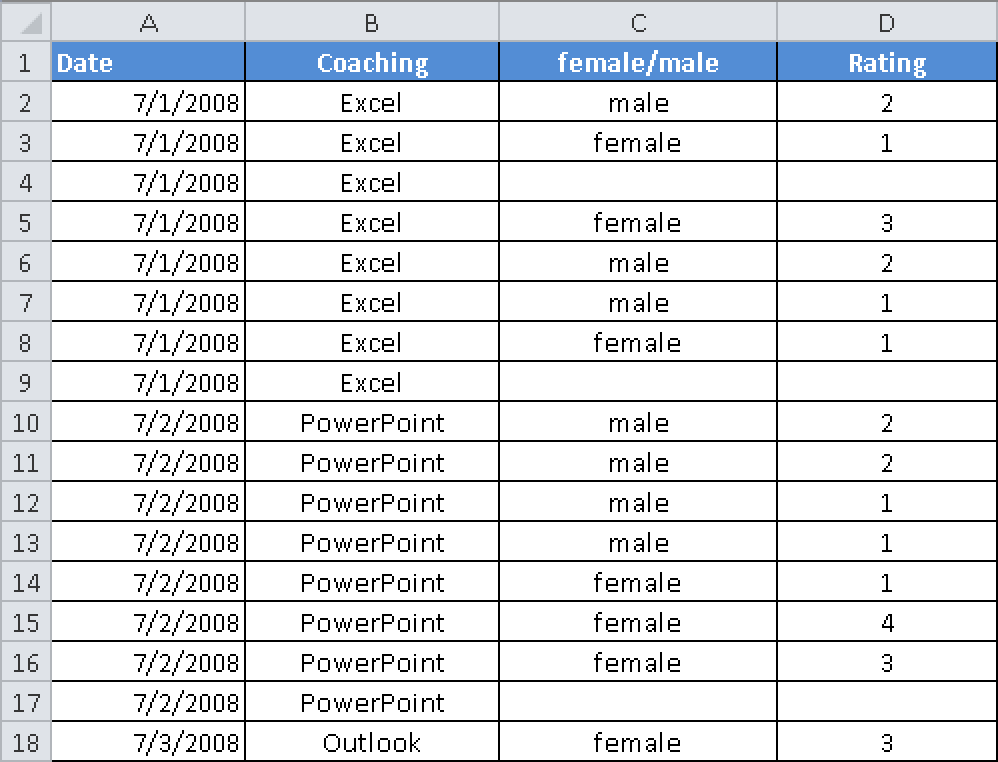
A training center conducted a survey of participants in seminars on Excel, Microsoft PowerPoint, and Microsoft Outlook on each day of July 2008, and the information shown in Figure 2-25 was collected. A total of 184 questionnaires were handed out.
Assume that, although you handed out 184 questionnaires, you want to know the number of answers you received, because not everyone participated in the survey. You do this by using the COUNTA() function to count the number of questionnaires returned, and you use the AVERAGE() function to evaluate the mean rating of responses (see Figure 2-26).

How do the participants rate the training center’s seminars? Good, medium, bad? To get a fast result, you calculate the average value by using the AVERAGE() function. All ratings are added together, and the total is divided by the number of ratings (see Figure 2-27).
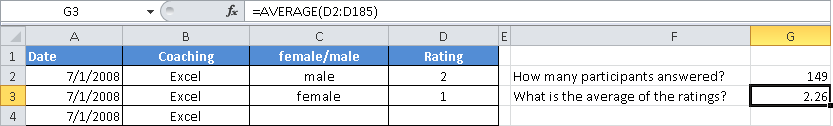
The formula =AVERAGE(D2:D185) returns an average rating of 2.26.
The training center wants to know whether men or women rated the seminars more favorably. The AVERAGEIF() function returns this result.
AVERAGEIF() calculates the average value for all entries that meet specified criteria—in this case, men or women (see Figure 2-28).
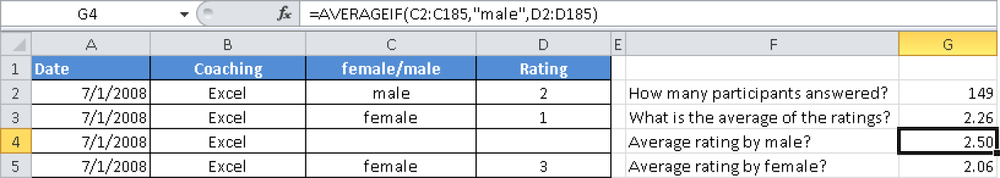
The formula =AVERAGEIF(C2:C185, “male”, D2:D185) returns the average rating of 2.50 for men. With an average rating of 2.50, men rate the seminars significantly better.
In addition, the training center also wants to know how women rate the Excel seminars. The AVERAGEIFS() function returns the result.
AVERAGEIFS() calculates the average value for all cells in a certain range that meet several specified criteria—in this case, women and Excel (see Figure 2-29).
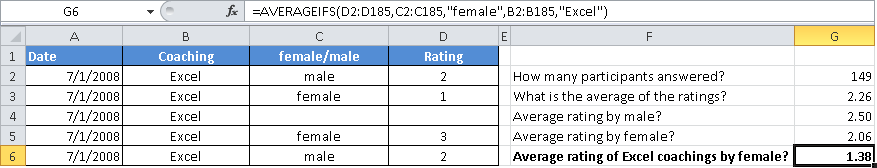
The formula =AVERAGEIFS(D2:D185,C2:C185,”female”,B2:B185,”Excel”) returns the average rating of 1.38 for the Excel seminars by women.