
If you decide to build a project directly in Visio, or if you plan to export Project 2010 information to a Visio diagram, it’s helpful to understand how the four Visio templates for schedules work. The templates that apply to projects or other date-related information include the following:
Timeline. The Timeline template displays tasks and events along a horizontal or vertical bar. A timeline of a project can be useful, for example, to summarize the phases of a multiyear project and key milestones toward its completion. A Visio timeline is helpful when you want to include categories of tasks, such as top-level summary tasks and milestones. On the other hand, in Project 2010 you can display a project in a horizontal timeline using the Timeline and select specific tasks you want to add to the timeline to emphasize key tasks and milestones.
Gantt Chart. Although you can use Visio to build simple Gantt charts, it is more useful as a presentation tool when you’re using data exported from Project 2010.
PERT Chart. The Project 2010 Network Diagram view is a much better option than its Visio PERT Chart counterpart, because Project 2010 calculates start and finish dates for tasks in addition to showing the hierarchy of tasks.
Note
For more information about using the PERT Chart in Project 2010, see Flowcharting with Network Diagrams.
Calendar. Although the Calendar template is a member of the Schedule category in Visio, it doesn’t integrate with Project 2010. You can build calendars for special events within a project, but, to show the work that’s scheduled for a project, the Calendar view in Project 2010 is a better tool.
Note
For more information about the Project 2010 Calendar view, see Visualizing the Project with the Calendar.
The Visio Timeline template summarizes the time span for phases and tasks and highlights milestones along the horizontal or vertical timeline. By expanding portions of a timeline, you can emphasize critical portions of a project.
Configure the time period and time format for a timeline by doing the following:
Right-click a timeline shape, such as Block Timeline or Cylindrical Timeline, and then click Configure Timeline on the shortcut menu.
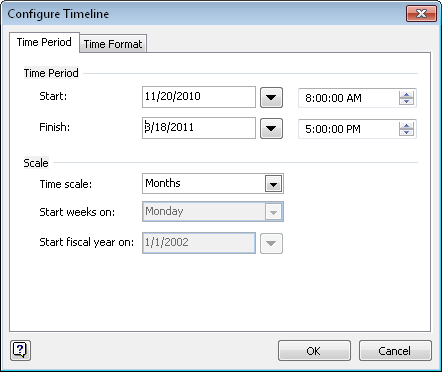
In the Configure Timeline dialog box, shown in Figure 19-11, under Time Period, type the start and finish dates for the time period that the timeline represents. If the timeline spans a short period, you can specify the start and finish times, too.
In the Time Scale drop-down list, choose the time interval to show on the timeline, such as Months. When you select Quarters, you can also specify the Start Fiscal Year On date. For Weeks, you can specify the first day of the week.
Specify the date format by choosing a language in the Timeline Language box on the Time Format tab.
Control whether dates and times appear on a timeline by clicking the Time Format tab and then selecting the check boxes that control whether the start date, finish date, and interim time scales appear. In addition, you can select the date format for dates and specify whether interim marks show the date or only tick marks.
Configure an interval within a timeline—for example, to adjust the phases of a project or the duration of a task—by doing the following:
Right-click an Interval shape, such as Block Interval, and then click Configure Interval on the shortcut menu.
In the Configure Interval dialog box, specify the start date and finish dates and, optionally, the start and finish times.
In the Description box, type the text that you want within the interval.
Configure milestones for events or key dates by doing the following:
Right-click a Milestone shape, such as Diamond Milestone, and then click Configure Milestone on the shortcut menu.
In the Configure Milestone dialog box, specify the date (and, optionally, the time) in the Milestone Date box.
In the Description box, type the text for the milestone.
For a multiyear project, activities that span only a few days or weeks are barely visible in a timeline, but they might nevertheless be essential to success. By adding Expanded Timeline shapes to a timeline diagram, you can display more detail for a small portion of the total project. Furthermore, you can expand a timeline to more than one level.
To expand a timeline, follow these steps:
From the Timeline Shapes stencil, drag the Expanded Timeline shape onto the drawing.
In the Configure Timeline dialog box, specify the start and finish dates for the expanded timeline and, optionally, the start and finish times as well. The dates that you specify for the expanded timeline must be within the date range of the overview timeline.
In the Time Scale box, select the time intervals the expanded timeline covers.
Click OK to add the expanded timeline to the drawing. Visio adds milestones, intervals, and date markers that occur during the expanded time period.
Visio synchronizes milestones and intervals between higher-level and expanded timelines, but you can synchronize milestones and intervals across any number of timelines on a page. To synchronize a milestone or interval with another, follow these steps:
Select the milestone or interval you want to synchronize, or drag the Synchronized Milestone or Synchronized Interval shape onto the timeline.
On the Timeline tab, in the Milestone group, click Synchronize, or, in the Interval group, click Synchronize.
In the Synchronize With drop-down list, select the milestone or interval with which to synchronize.
Select the date format, if necessary, and then click OK. A gray dotted line shows the synchronization between the milestones or intervals.
Just as in Project 2010, in a Visio Gantt chart, task data appears in a table as well as in a chart of task bars, milestones, and other symbols that represent the relationships and schedule of project tasks. The major difference, of course, is that a Visio Gantt chart does not calculate start and finish dates, resource assignments, costs, and other project management information. For this reason, the Visio Gantt Chart template is best for presentations or status reports. If you don’t have easy access to Project 2010, you can add shapes to a Visio drawing to build a Gantt chart.
Whether you import a Gantt chart from Project 2010 into Visio or build one from scratch, you can modify the Gantt chart in Visio in the following ways:
Add task bars and milestones by dragging Row, Task Bar, and Milestone shapes onto a Gantt chart frame or by clicking Gantt Chart, Tasks, New. Type the name of the new task along with the start date, finish date, duration, and any other task information.
Delete tasks by selecting the tasks and then clicking Gantt Chart, Tasks, Delete.
Rename a task by double-clicking the task name, typing the new name, and pressing Esc.
Add project fields, such as Resource Names or % Complete, in the table area of the Gantt chart by right-clicking a Gantt chart frame and then clicking Insert Column on the shortcut menu. In the Insert Column dialog box, click the field you want to add.
Remove a column from the table by clicking anywhere in the column and then clicking Gantt Chart, Columns, Hide.
Indent and outdent tasks to specify summary tasks and their subtasks.
Link tasks by using the Link Lines shape to show dependencies between predecessor and successor tasks.
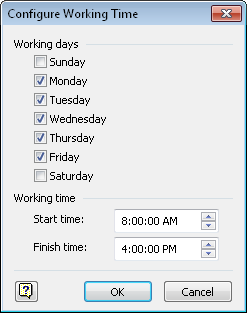
Specify the working days and hours for your project team. On the Gantt Chart tab, in the Manage group, click Configure Working Time. The Configure Working Time dialog box appears, as shown in Figure 19-12. Select the check boxes for work days, and click the times in the Start Time and Finish Time boxes.
Annotate the Gantt chart for presentations by adding Title, Legend, Text Block, and Horizontal Callout shapes.
Configure the Gantt chart time units, duration, and timescale. On the Gantt Chart tab, in the Manage group, click Chart Options. Click the Date tab, and then choose the settings you want, such as the start and finish dates for the Gantt chart.
Format task bars, milestones, and summary task bars. On the Gantt Chart tab, in the Manage group, click Chart Options, and then click the Format tab.
Change start date, finish date, and duration by typing values in the fields in the table within the Gantt Chart shape or by dragging task bars in the chart area. Dragging task bars is quick, but it is typically not as accurate as typing values. You can also show progress by dragging the yellow control handle on the left side of a task bar toward the right.
Navigating Within Visio Gantt Charts
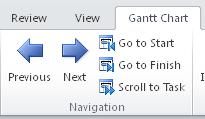
The Navigation group on the Visio Gantt Chart tab, shown in Figure 19-13, includes commands for finding task bars and dates in a Gantt chart. The following tools help you navigate within the chart area of your Visio Gantt chart:
Previous. Displays the time period immediately prior to the current period
Next. Displays the time period immediately after the current period
Go To Start. Jumps to the first task bar in the project
Go To Finish. Jumps to the last task bar in the project
Scroll To Task. Displays the task bar for the selected task
Program Evaluation and Review Technique (PERT) charts display project tasks as a network or hierarchy of boxes, much like a work breakdown structure. However, always keep in mind that the Visio PERT chart is primarily designed for presentation, not actual project management. It does not calculate start dates, finish dates, or durations. If you need to use a PERT chart as a project management tool rather than just a communications tool, use the Network Diagram in Project 2010.
To build a PERT chart in Visio, drag shapes onto the drawing and type values in the boxes. There’s no wizard for transferring information between Project 2010 and Visio PERT charts. However, you can use the data features in Visio Professional to link boxes on a diagram to data in a Microsoft Project database.