
Having accurate information about the status of the company’s key project-related performance indicators is vital for executives. With the new business intelligence suite of tools available in Project Server 2010, you can easily find relevant information in the immense amount of data that is stored on your project server.
With the Project 2010 business intelligence features you can:
Standardize the way reporting is done with the help of the project server administrator. You can base reporting on standard metrics.
Create automated processes for reporting. You can have predefined reports that you and the project managers can easily access.
Easily drill down in data through the use of the reporting services provided in the Business Intelligence Center.
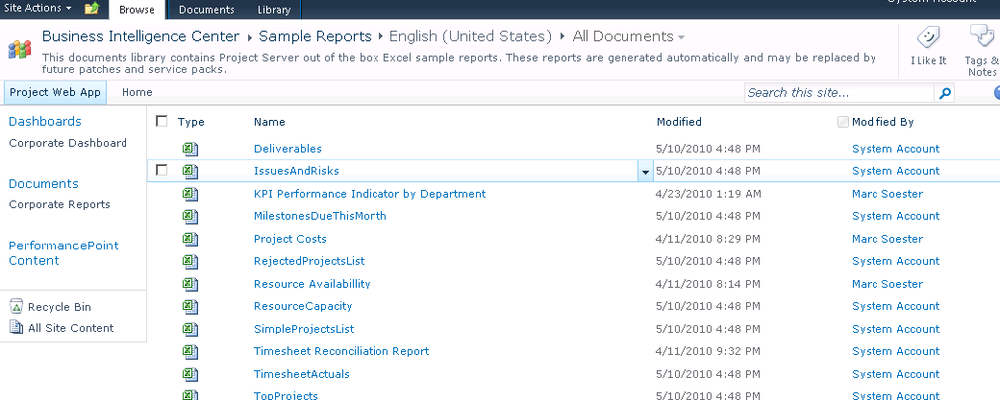
The Business Intelligence library in Project Server includes a standard set of templates. Users can open the template in Excel and create new reports from the template.
Based on these reports, your portfolio manager or your project server administrator can build standard reports that you can use regularly. Figure 26-11 shows a standard list of sample reports and templates.
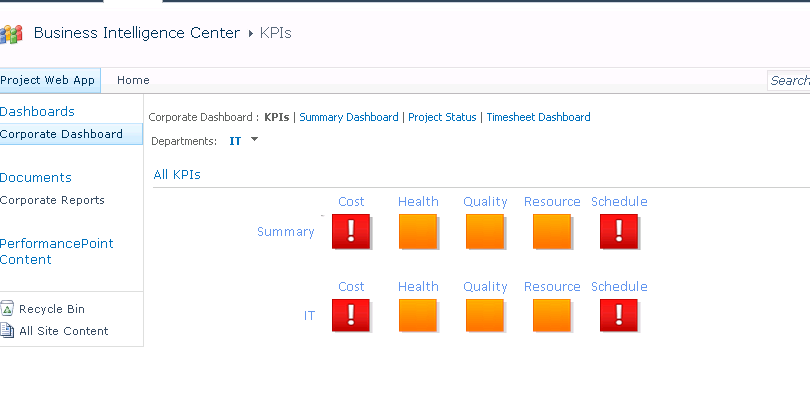
Besides these reports, you can also create dashboards. Dashboards are views that provide instant information about your key performance indicators. Your portfolio manager can set up dashboards for you, showing the most relevant key performance indicators. Details can be shown in dashboards by department, program, and project, and they can help you identify issues that need your attention.
Dashboards visually highlight the status of the key performance indicators. Figure 26-12 shows an example of a configured dashboard.
In the Project Web App Business Intelligence Center, you can leverage a whole set of tools to build your reports. Depending on the report type, you can use one or several of these tools to obtain the information you are interested in. The tools include:
Online Views. These are used for the Quick Online Views, and they can be seen in several pages in Project Web App, such as the Project Center, Resource Center, and others.
Online Views are similar to the View menu available in the Data group on almost every Project Web App page. Click in the View box to see the list of views available for that page.
You can export a view to Excel. On the current tab, in the Share group, click Export To Excel. This quickly generates an Excel report in which you can drill down and analyze your data.
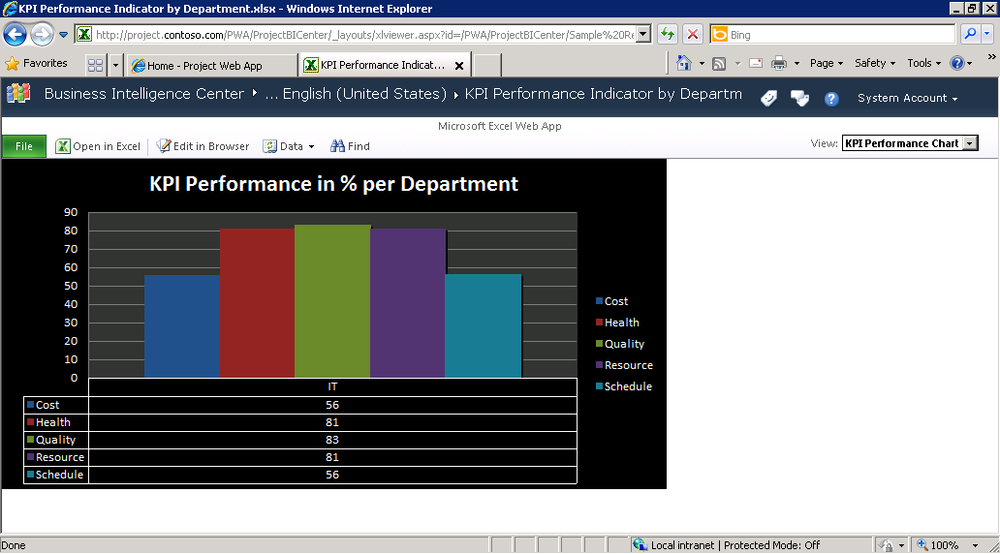
Excel Services. Through Excel Services, you can view sample reports or already-created Excel reports in the web browser. This functionality enables you to drill down in the data through standard Excel filters directly in the browser, as shown in Figure 26-13. You can start building Excel reports based on existing samples or templates.
PerformancePoint Services. This tool is the engine that drives the creation of the dashboard and the key performance indicator (KPI) reports. In dashboards, you can combine different types of data. PerformancePoint Services also provides access to the Dashboard Designer.
Visio Services. This tool facilitates the visualization of project management processes by generating timeline views, dynamic timelines, and so on.
SQL Reporting Services. You can use the SQL Reporting Services to create standard printable reports.
There are various ways in which you can create new reports in Project Web App. You can start with a sample or template already existing in the Business Intelligence Center, or you can create a report from scratch. In this section, you’ll learn how to create reports using the samples that come with your installation of the Business Intelligence Center.
Note
The templates available depend on your administrator’s configuration of the business intelligence functionality.
To create a new report based on a sample report, follow these steps:
On the Quick Launch, click Business Intelligence.
The Business Intelligence Center appears.
In the left pane, click Documents.
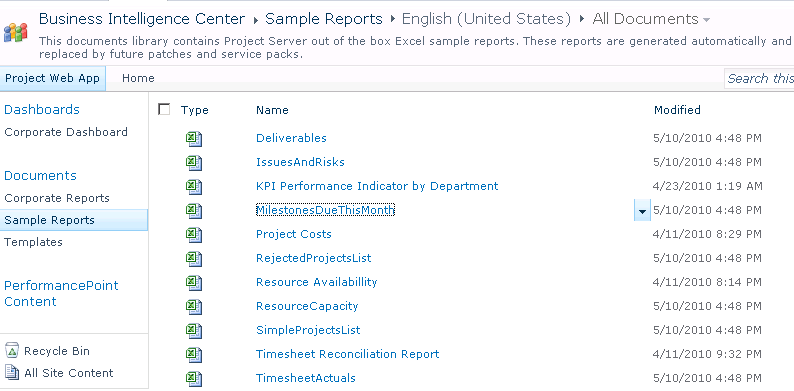
Under Document Libraries in the page that appears, click Sample Reports.
The Business Intelligence Center displays the list of available sample reports, as shown in Figure 26-14.
Click the arrow to the right of the sample report you want to customize, and then in the drop-down menu that appears, click Edit In Microsoft Excel. If a security alert appears, click OK.
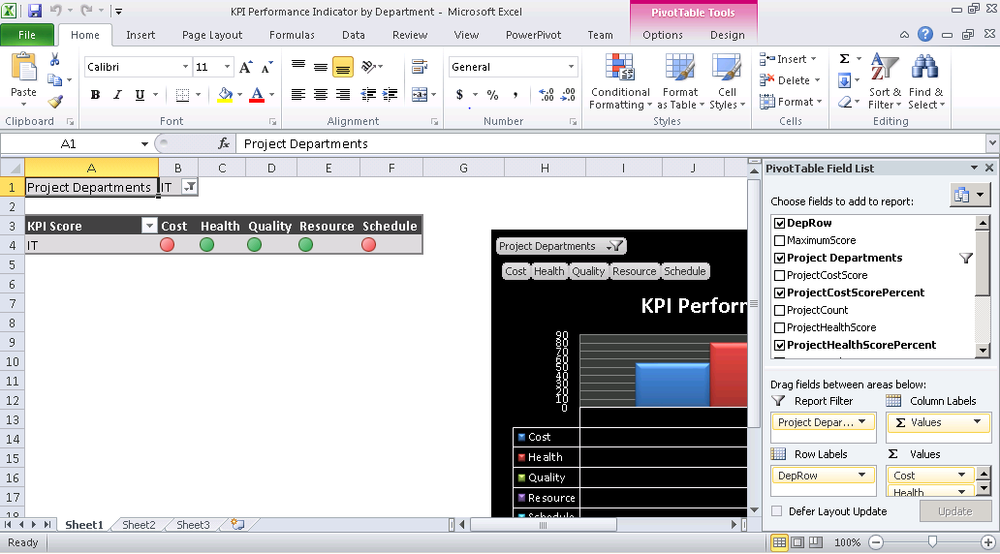
The report opens in Excel, as shown in Figure 26-15.
Modify the report as needed, adding fields or creating filters or whatever you might need to show the information you want for this report.
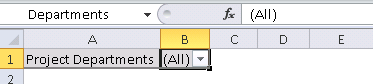
You need to name the filter as well as the PivotTable and the chart for the report to work. You will then be able to select them from the Excel Services drop-down list. To name the filter, select the filter cell and enter a name. (See Figure 26-16.)
When you have finished your modifications, publish the report. On the File tab in Excel, click Save & Send, and then click Save To SharePoint.
In the right pane of the Backstage view, click the Publish Options button.
In the Publish Options dialog box, select or clear the check boxes to specify the items included in the report, as shown in Figure 26-17.
Click OK in the Publish Options dialog box.
Save the report in the location you want.
After the report is saved, you can view it using Excel Services by accessing the location you specified.

Dashboards are generally created and configured by the project server administrator or the portfolio manager.
To view available dashboards, follow these steps:
On the Quick Launch, click Business Intelligence.
In the left pane, click Dashboards.
A list of all dashboard items appears.
Click folders or items to open them.
Note
For more information about dashboards and using the Dashboard Designer, see Creating Dashboards.