Projects contain so much information that data that isn’t pertinent can simply get in the way. Filters restrict the tasks or resources that appear so that you can more easily analyze a situation. Project 2010 provides a number of standard filters that you can use as-is to hide information you don’t need to see in a given situation. For example, the Incomplete Tasks filter displays only those tasks that are either in progress or not yet started so that you can focus on work yet to be done. These filters work equally well as templates for your own customized filters. You can create a filter based on the Incomplete Tasks filter to display incomplete tasks that are behind schedule. This enables you to see what kind of course correction you need.
Note
For more information about working with the built-in Project 2010 filters, see Seeing Only What You Need by Filtering.
You can modify an existing filter, but it’s better to keep the original filter intact by copying the filter and then modifying the copy. To customize a filter, follow these steps:
On the View tab, in the Data group, click the arrow next to the Filter box, and then click More Filters.
In the More Filters dialog box, select the Task or Resource option to display the existing task or resource filters.
Click the filter you want to modify, and then click Edit or Copy.
In the Name box, change the name to indicate what the filter shows.
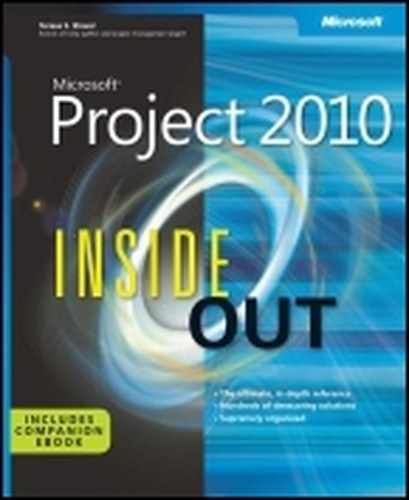
Click the Field Name cell you want to change, click the arrow, and then click the name of the field by which you want to filter. (See Figure 28-27.)
Click the Test cell, click the arrow, and then click the name of the test you want to use for the filter.
Table 28-1 describes the tests you can use within a filter and provides an example of each.
In the Value(s) cell, specify the value you want to use for the filter test.
You can type a value, click a field name from the list, or type a prompt to define an interactive filter.
To display the summary tasks for tasks that pass the filter criteria, select the Show Related Summary Rows check box.
Note
For information about creating an interactive filter, see Creating Interactive Filters.
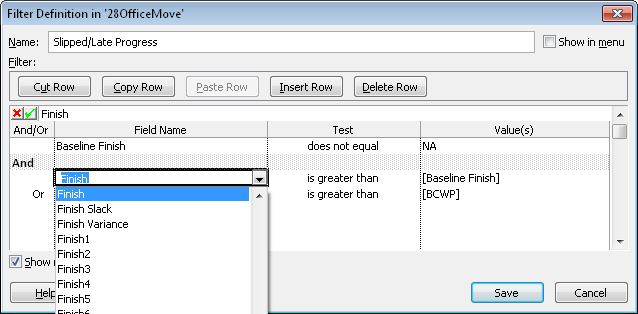
Table 28-1. Filters
Note
When you use the Equals or Does Not Equal test, you can compare a text field value to a string with wildcard characters. Wildcard characters include the following:
* represents one or more characters.
? represents any single character.
For example, DB* matches DB Developer, DB Administrator, and DB Designer. Des??? matches Design but does not match Describe.
If you can’t find a filter similar to what you want, you can create one and filter on any field or combination of fields in Project 2010, including custom fields that you define. To create a new filter, follow these steps:
On the View tab, in the Data group, click the arrow next to the Filter box, and then click More Filters.
In the More Filters dialog box, select the Task or Resource option to create a task or resource filter and then click New.
In the Filter Definition dialog box, type a descriptive name for the filter in the Name box.
If you want the new filter to appear on the Filtered For menu, select the Show In Menu check box.
Enter the field, test, and values that define your filter criteria.
To include the summary rows for the tasks or resources that meet the filter criteria, select the Show Related Summary Rows check box.
Some of the handiest filters use criteria that compare the values in two different fields for the same task or resource. For example, to look for tasks that haven’t started on time, you can filter for tasks in which the Actual Start date is greater than the Baseline Start date.
To define a test that compares two fields, do the following:
In the Filter Definition dialog box, click the Field Name cell, click the arrow, and then click the name of the field by which you want to filter—for example, Actual Start.
Click the Test cell, click the arrow, and then click the name of the test you want to use—“is greater than,” in this example.
Click the Value(s) cell, click the arrow, and then click the name of the field with which you want to compare the first field (see Figure 28-28)—in this example, [Baseline Start].
A field name in the Value(s) cell is enclosed in square brackets [ ].
Sometimes it takes more than one or two criteria to filter the list to your satisfaction. You can create filters in which tasks or resources must meet at least one of the criteria or all of the criteria.
To define multiple filter criteria, follow these steps:
In the Filter Definition dialog box, in the Name box, type a descriptive name for the filter.
In the first row in the table, specify the field, test, and value for the first set of filter criteria.
In the second row, click the And/Or cell in the second row, and then click And or Or.
If you click And, the resulting filter displays elements only if they meet both criteria. If you click Or, the filter displays tasks that meet one or both of the criteria.
In the second row, specify the field, test, and values for the second set of filter criteria.
Repeat steps 2 through 4 for any additional tests you want to define for the filter, defining each test on a separate row in the table and relating them with an And or Or.
With more than one test, filters evaluate tests in the order in which they occur in the filter definition. The filter restricts elements to those that pass the first test and then compares those results to the outcome of the next test. The filter continues until there are no further tests to evaluate.
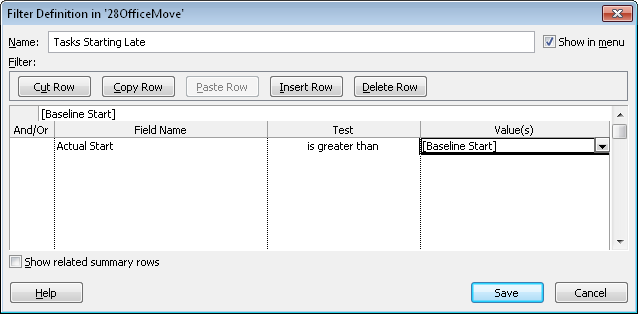
In some cases, you might want to adjust the order in which the tests are evaluated. For example, you might want to filter tasks first for those that use a particular resource and that aren’t yet complete. Then you can filter the list for tasks that start and finish within a particular date range. You can control the order that Project 2010 evaluates tests by inserting an And or Or test in an otherwise empty row. Including a test in an empty row is the equivalent of placing parentheses around the tests that occur before and after the empty row.
Do the following to group criteria within a filter:
Define one or more tests for the first group of filter criteria.
In the next blank row after the first group of criteria, click the And/Or cell, and then click And or Or. Keep the rest of this row blank.
This blank row containing only And or Or creates the grouping between the first set of filter criteria and the second set.
In the next row, define the tests for one or more additional filter criteria. (See Figure 28-29.)
In many cases, you want to supply different values each time you apply a filter. For example, you might want to filter the task list by different resources to produce a list of assignments for each resource assigned to your project. Interactive filters request values and then filter based on the values you provide.
To create an interactive filter, follow these steps:
In the Filter Definition dialog box for a new filter, in the Name box, type a descriptive name for the filter.
Click the field and test for the filter.
In the Value(s) cell, type a text string within quotation marks followed by a question mark.
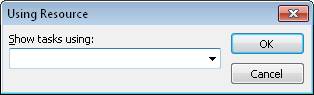
When you apply your new interactive filter, the text string you entered appears as a prompt in a dialog box. (See Figure 28-30.) The question mark instructs Project 2010 to display the prompt and wait until the user enters the value.
AutoFilter is an easy way to filter by values in a single field. For example, to show tasks assigned to a specific resource, click the arrow in the Resource Names column heading, point to Filters, and then select the check boxes for the resources by which you want to filter and clear the check boxes for the resources you don’t want to see. If the filter you want has only one or two conditions, you don’t have to turn to the Filter Definition dialog box. You can create a custom AutoFilter instead. In addition, you can quickly create custom filters by saving an AutoFilter test.
Note
By default, AutoFilter is turned on. However, if you don’t see arrows next to each column heading, you have to turn AutoFilter on. On the View tab, in the Data group, click the arrow next to the Filter box, and then click Display AutoFilter.
Keeping AutoFilter turned on makes it easy to filter your views. However, you can turn off AutoFilter for new projects. On the File tab, click Options. In the Project Options dialog box, click Advanced in the left pane, and then, below the General heading, clear the check box labeled Set AutoFilter On For New Projects.
To use AutoFilter to create a custom filter:
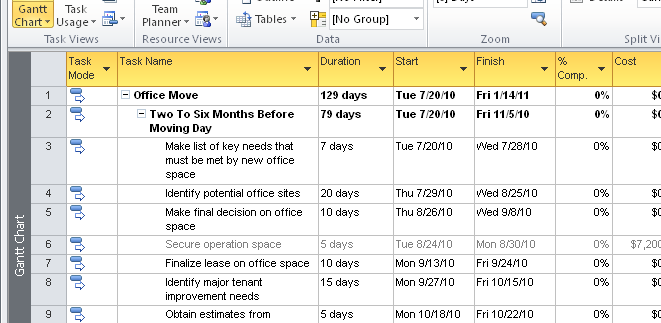
Display the sheet view whose rows you want to filter.
The AutoFilter arrows appear in the column headings for each field in the sheet view, as shown in Figure 28-31.
Click the arrow next to the column heading for the column whose information you want to filter by, point to Filters, and then click Custom.
The Custom AutoFilter dialog box appears with the field set to the current column.
Click the arrow in the first test box, and then click the test you want to use, such as Is Greater Than.
In the first value box, click the arrow and then enter a value or field name.
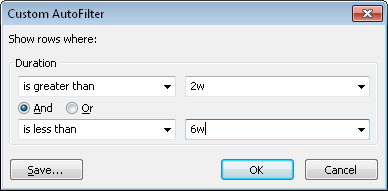
To add a second test, select the And or Or option.
Click the test and value for the second test. (See Figure 28-32.)
To save the AutoFilter test, click Save.
The Filter Definition dialog box appears with the tests that you defined via AutoFilter. You can enter a filter name and make other changes before you click Save to save the filter.
Note
To learn more about applying AutoFilters to a table, see Seeing Only What You Need by Filtering.