
You view and work with information in Project 2010 by selecting a specific view to display in your Project 2010 window. Of the many views built into Project 2010, some have to do with tasks, others with resources, and still others with assignments. Certain views are a spreadsheet of tables and columns. Others are graphs or forms. Other views are a blend—for example, the Gantt Chart includes both a sheet and a graph.
You can switch tables in a view and add and remove fields shown in a table, and so modify these views to present your project information exactly the way you need.
When you first start using Project 2010, typically the first view you use is the Gantt Chart, which is the default view. Here, you enter information such as tasks, durations, and task relationships. Then you might use the Resource Sheet, in which you enter resource information. As you continue to plan your project, your requirements become more sophisticated, and you find you need other views. For example, you might want to see all your tasks with their current percent complete along with the critical path. Or you might need a graph showing a particular resource’s workload throughout April and May.
Note
By default, the view that appears when you first open Project 2010 is the Gantt Chart topped by the Timeline. You can change this default view. On the File tab, click Options, and then click General in the left pane. Under Project View, in the Default View box, click the view you want to appear first whenever you create a new project file.
This setting changes the view only for any new project files. The view that appears when you open an existing project file is the one that was last showing when you saved and closed the file.
Note
For more information about other view options, see the Arranging Your Project 2010 Window.
There are three ways to see and select the most commonly used views:
On the View tab, in the Task Views or Resource Views group, click the button for the view you want. If you don’t see the name of the view you’re looking for, click the arrow next to a related view name to see other options. For example, in the Task Views group, click the arrow next to Gantt Chart, and you’ll see the Detail Gantt and Tracking Gantt. If you still can’t find the view you want, click Other Views, and then click More Views.
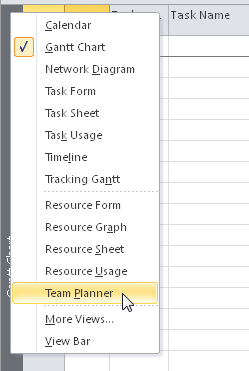
Right-click the Active View bar (showing the name of the current view) at the left edge of the Project window. The shortcut menu that appears shows about half of the available views, so this is often the quickest way to get to another view. If the view you want is not listed on the shortcut menu, click More Views to display the full list.
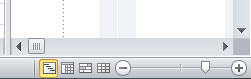
Click one of the four view shortcuts in the lower-right corner of the Project 2010 window, next to the Zoom slider. These are considered the four most commonly used views: the Gantt Chart, Task Usage, Team Planner, and Resource Sheet.

It’s a great idea to experiment and click through all the available views, just to see how they present your project information in various ways. This tour of views can become even more meaningful as you add more task information, add resources, and assign resources to tasks.
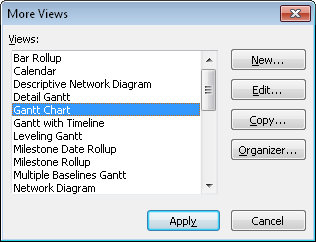
All views are listed in the More Views dialog box. To see the full list of views built in to Project 2010 and switch to a different view, do the following:
On the View tab, in either the Task Views group or the Resource Views group, point to Other Views, and then click More Views.
The full list of available Project 2010 views appears. (See Figure 4-2.)
Click the view you want, and then click Apply.
The selected view replaces the previous view in your Project 2010 window.
Keep in mind that when you switch from one view to another, the data doesn’t change; you just get a different look at the data in your project database.
If you display the View bar, you can use it to quickly switch views. To show the View bar, do the following:
Right-click the Active View bar (showing the name of the current view) at the left edge of the Project window.
At the bottom of the shortcut menu that appears, click View Bar.
The View bar appears on the left edge of the Project 2010 window, as shown in Figure 4-3. The same views that appear on the shortcut menu are listed on the View bar.
Click a view’s name or icon to switch to that view. If you can’t see the view’s name, click the arrow at the bottom of the list to see more views.
If the view isn’t listed on the View bar, click More Views at the bottom of the View bar to see the full list.
Note
To hide the View bar, right-click in the View bar, and then click View Bar to turn it off. When the View bar is hidden, it’s replaced by the gray Active View bar, which shows the name of the current view.
Inside Out: Add your favorite views to the View bar menu and View bar
Although the most commonly used views are listed on the View bar menu and the View bar itself, they might not be your most commonly used views. For example, you might use the Task Entry view and the Detail Gantt every day, and it would be cumbersome to have to click More Views every time you need one of these.
Now Project 2010 dynamically adds views that you apply to the various menus. For example, if you apply the Detail Gantt, its name appears in the Active View bar shortcut menu and in the View Bar. It also appears on the Gantt Chart menu (View, Task Views, Gantt Chart). This ensures that your frequently used views are always quickly available, whether you like to use the View tab or the View bar.
You can also add a frequently used view to the View tab and View bar menu by editing the view definition as follows:
On the View tab, in the Task Views group, click More Views.
Click the view you want to add to the View tab and View bar menu, and then click Edit.
In the View Definition dialog box, select the Show In Menu check box.
You can use this technique to remove views you never use from the View tab and View bar menu as well. Simply select the view, click Edit, and then clear the Show In Menu check box.
Note
You can fully customize your views and create entirely new views. For more information, see Customizing Views.
You can think of Project 2010 views in the following categories:
Gantt charts
Network diagrams
Sheet views
Usage views
Forms
Combination views
There are also several one-of-a-kind views that defy categorization. They tend to be more graphically oriented, but because they’re unique and specialized, we’ll discuss them separately throughout this section. These special views are the following:
Timeline
Calendar
Team Planner
Resource Graph
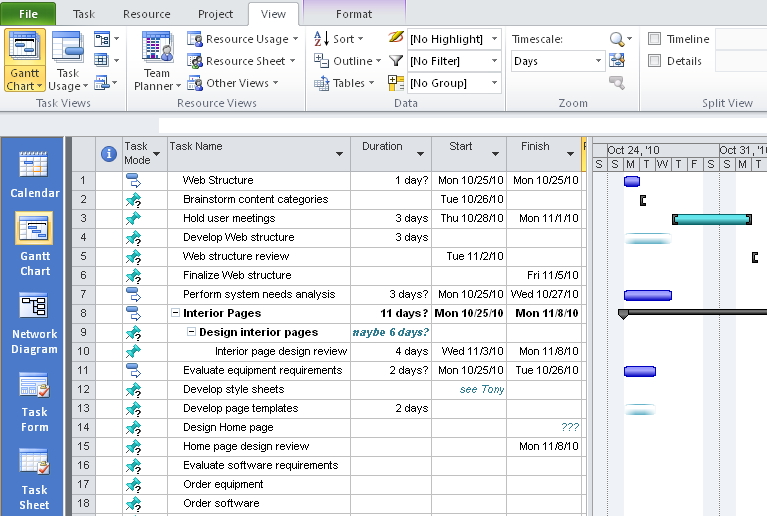
Gantt charts are a special type of view that are used extensively in project management. The left side of a Gantt chart contains a sheet view, and the right side contains a bar graph along a timescale. (See Figure 4-4.)
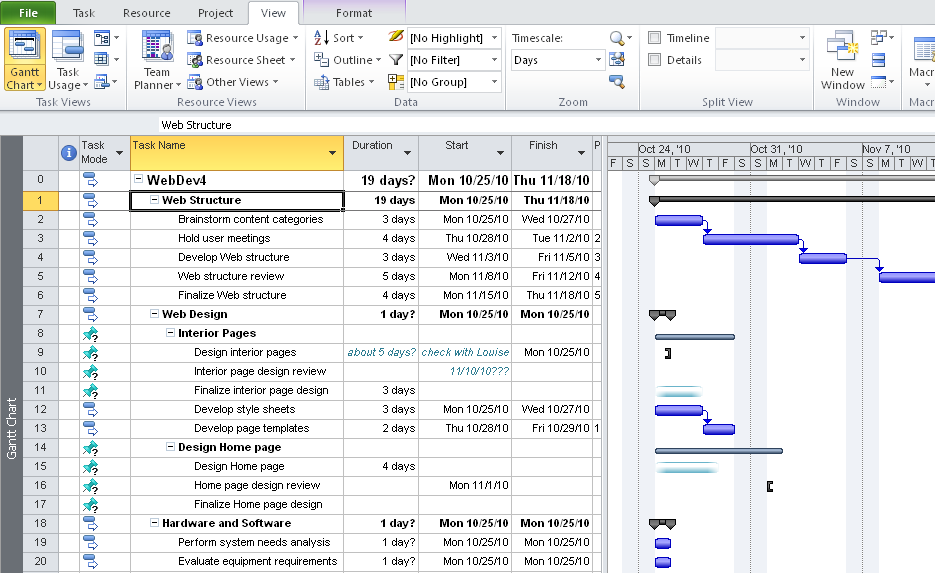
Figure 4-4. A Gantt chart shows task information in the sheet area of the view; the corresponding bar graph shows the task’s duration, start and finish dates, and task relationships along a zoomable timescale.
To display the Gantt Chart, on the View tab, in the Task Views group, click Gantt Chart.
You can also quickly switch to the Gantt Chart by clicking its icon in the view shortcuts area on the status bar next to the Zoom slider.
To display a different Gantt chart view, click the arrow under the Gantt Chart button. The menu lists recent Gantt chart views you’ve accessed. If the Gantt chart you want is not listed, click More Views, and then click it from the list.
Table 4-1 describes the default Gantt charts that are built in to Project 2010.
Table 4-1. Project 2010 Gantt Charts
Gantt chart | How you can use it | For more information |
|---|---|---|
Detail Gantt (task view) | View tasks and associated information in a sheet and see slack and slippage for tasks over time in a bar graph on a timescale. Use the Detail Gantt to check how far a task can slip without affecting other tasks. | |
Gantt Chart (task view) | View tasks and associated information in a sheet and see tasks and durations over time in a bar graph on a timescale. Use the Gantt Chart to enter and schedule a list of tasks. This is the view that appears by default when you first start new projects. | |
Leveling Gantt (task view) | View tasks, task delays, and slack in a sheet, and the before-and-after effects of the Project 2010 leveling feature. Use the Leveling Gantt to check the amount of task delay caused by leveling. | |
Multiple Baselines Gantt (task view) | View different colored Gantt bars for the first three baselines (Baseline, Baseline1, and Baseline2) on summary tasks and subtasks in the chart area of the view. Use the Multiple Baselines Gantt to review and compare the first three baselines you set for your project. | |
Tracking Gantt (task view) | View tasks and task information in a sheet and a chart showing a baseline and scheduled Gantt bars for each task. Use the Tracking Gantt to compare the baseline schedule with the actual schedule. |
You can change the look and content of bars on a Gantt chart. You can:
Change the pattern, color, and shape of the Gantt bar for a selected task.
Change the text accompanying the Gantt bar for a selected task.
Change the format and text for all Gantt bars of a particular type.
Change the text style for all Gantt bars of a particular type.
Change the layout of links and bars on a Gantt chart.
Change the gridlines in the view.
Note
For more information about changing the look and content of Gantt bars, see Formatting a Gantt Chart View. To change the timescale in a Gantt chart, see Adjusting a Timescale. You can also change the content or look of the sheet area of a Gantt chart. For details, see Customizing Views. You can print views with the content and format you set up in the Project 2010 window. For more information, see Setting Up and Printing Views.
The Timeline is a new graphical view available in Project 2010 that you can use to summarize selected project information along a timeline. By default, the Timeline appears above all other views, as shown in Figure 4-5. This is true whether you’re showing a task or resource view. You can select specific tasks to add to the timeline and specify how those tasks appear. This is particularly helpful to highlight project phases and key milestones and deliverables.
The Timeline is great for communicating higher-level project information to others, especially because it’s easy to copy the Timeline graphic to an e-mail message or a PowerPoint presentation, for example.
Although the Timeline appears by default above other views, you can also display it as a view on its own, as shown in Figure 4-6. To do this, on the View tab, in the Task Views group, click Other Views, and then click Timeline.
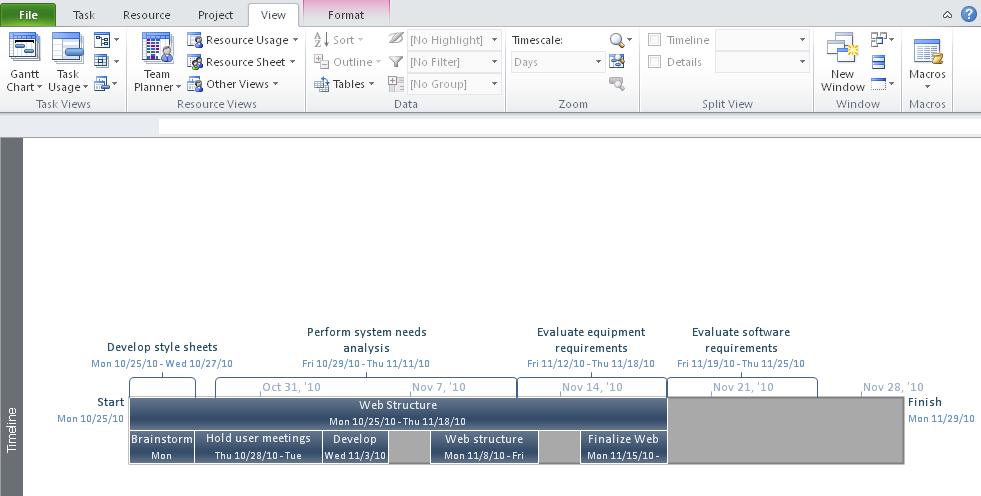
Figure 4-6. You can apply the Timeline as a view on its own instead of having it appear above other views.
When you switch to another view after reviewing the Timeline as its own view, the Timeline doesn’t appear above the other view as it did before. This is also true when you switch from a combination view such as the Task Entry view. To display the Timeline above other views, on the View tab, in the Split View group, select the Timeline check box.
You can add any regular task, summary task, milestone, or deliverable to the Timeline. The task must be automatically scheduled or have at least some estimated schedule information to be added to the Timeline. If a manually scheduled task has a task mode indicating that it needs more information, it cannot be added to the Timeline. To add a task to the Timeline, follow these steps:
Display any task view; for example, the Gantt Chart or Calendar.
Right-click the task name, and then click Add To Timeline on the shortcut menu that appears.
If you’re working in a task sheet view such as the Detail Gantt or Task Usage view, you can select the task row by clicking the row number and then dragging from the row number to the Timeline to add that task to the Timeline.
After you add a task to the Timeline, you can specify whether it should be displayed as a callout instead of as the default bar. If you’re using the Timeline to show major phases and summary tasks, for example, you might want to display the phases as callouts and the summary tasks as bars, as shown in Figure 4-7.
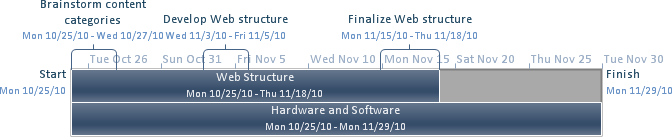
Figure 4-7. Use a combination of callouts and bars to differentiate between different types of tasks on the Timeline.
To change a Timeline bar to a callout, follow these steps:
Click anywhere in the Timeline area of the view.
The ribbon changes to show the Timeline Tools Format tab.
Click the task whose bar you want to change to a callout.
On the Format tab, in the Current Selection group, click Display As Callout.
You can also right-click a task in the Timeline and then click Display As Callout in the shortcut menu that appears.
Note
For details on using the Timeline to help create graphical reports, see Using Views to Report Project Information. For details on changing text and bar styles in the Timeline, see Modifying the Timeline.
Network diagrams are a special type of graph view that presents each task and associated task information in a separate box, or node. The nodes are connected by lines that represent task relationships. The resulting diagram is a flowchart of the project. Network Diagram views (see Figure 4-8) are also referred to as PERT (Program Evaluation and Review Technique) charts.

Figure 4-8. You can enter, edit, and review tasks and their dependencies in the Network Diagram view.
To display a network diagram, on the View tab, in the Task Views group, click the arrow next to Network Diagram. Select the network diagram you want to display. If the one you want is not listed, click More Views, and then select it from the list.
Table 4-2 describes the Project 2010 network diagram views.
Table 4-2. Project 2010 Network Diagram Views
How you can use it | For more information | |
|---|---|---|
Descriptive Network Diagram (task view) | View all tasks and task dependencies. Use the Descriptive Network Diagram to create and fine-tune your schedule in a flowchart format. This view is similar to the regular Network Diagram, but the nodes are larger and provide more detail. | |
Network Diagram (task view) | Enter, edit, and review all tasks and task dependencies. Use the Network Diagram to create and fine-tune your schedule in a flowchart format. | |
Relationship Diagram (task view) | View the predecessors and successors of a single selected task. In a large project or any project with more complex task linking, use this task view to focus on the task dependencies of a specific task. |
Note
To learn about modifying the content or format of a network diagram, see Modifying a Network Diagram.
Use the Calendar to view tasks and durations for a specific week or range of weeks in a monthly calendar format, as shown in Figure 4-9.
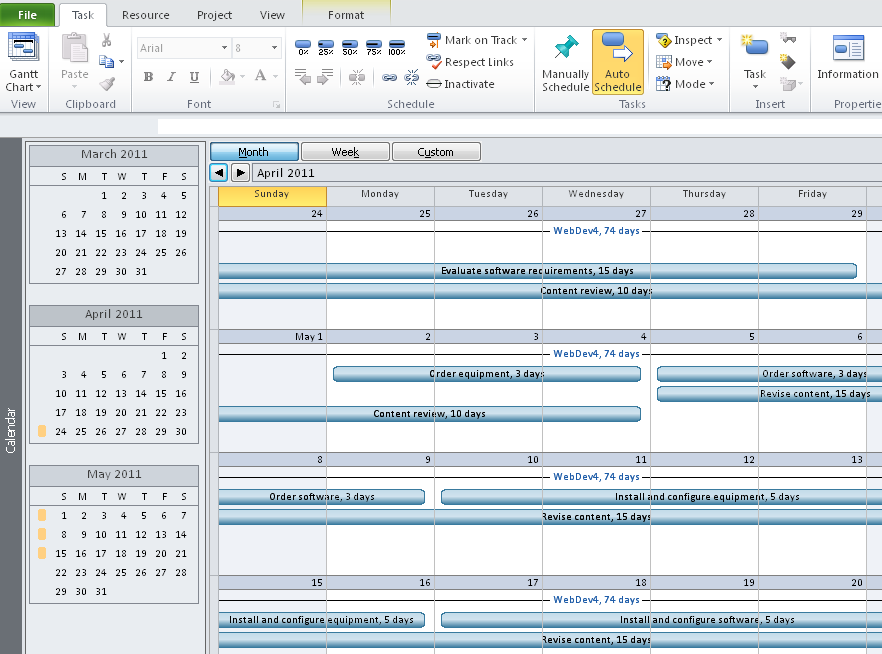
Figure 4-9. In the Calendar view, you can quickly see which tasks are scheduled for particular days, weeks, or months.
To display the Calendar, on the View tab, in the Task Views group, click Calendar.
Note
For more information about setting up schedule information, see Chapter 6. For information about modifying the Calendar view, see Modifying the Calendar.
The Team Planner is a new view in Microsoft Project Professional 2010 that you can use to graphically visualize how your resources are scheduled during a selected time period, as shown in Figure 4-10.
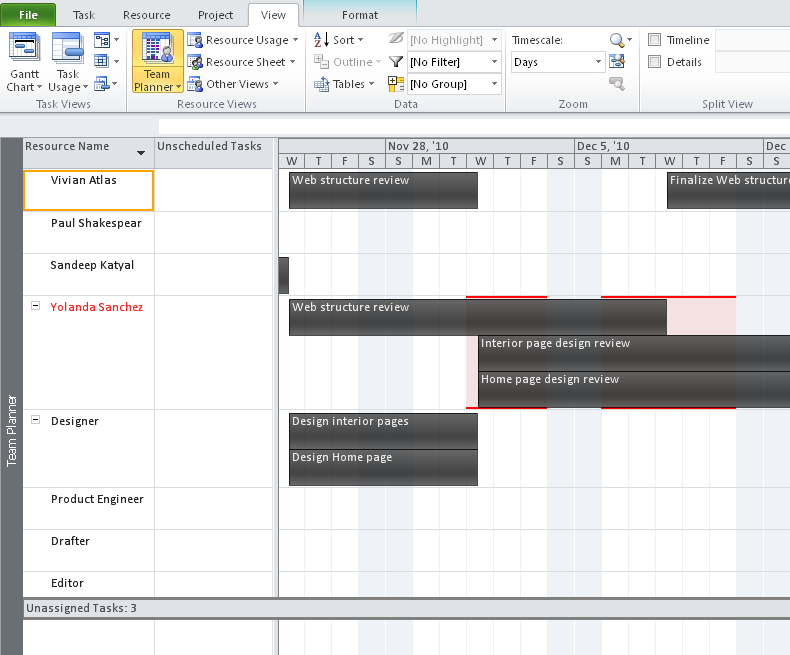
You can see which team members have availability to work during the time period that a task needs to be done and then drag the task to assign it to that person. You can reassign tasks from one resource to another to resolve overallocations or improve the schedule. You can also drag tasks along the timesheet to change the assignment scheduling.
To display the Team Planner, on the View tab in the Resource Views group, click Team Planner.
You can also quickly switch to the Team Planner by clicking its icon in the view shortcuts area on the status bar (next to the Zoom slider).
In the Team Planner, you can manipulate task information through the Task Information dialog box. You can format bars to show actual work or late tasks.
Note
For more information about using the Team Planner to assign resources to tasks, see Assigning Work Resources to Tasks. For information about customizing the Team Planner, see Modifying the Team Planner.
With the Resource Graph, you can view resource allocation, cost, or work over time for a single resource or group of resources. Information is displayed in a column graph format, as shown in Figure 4-11.
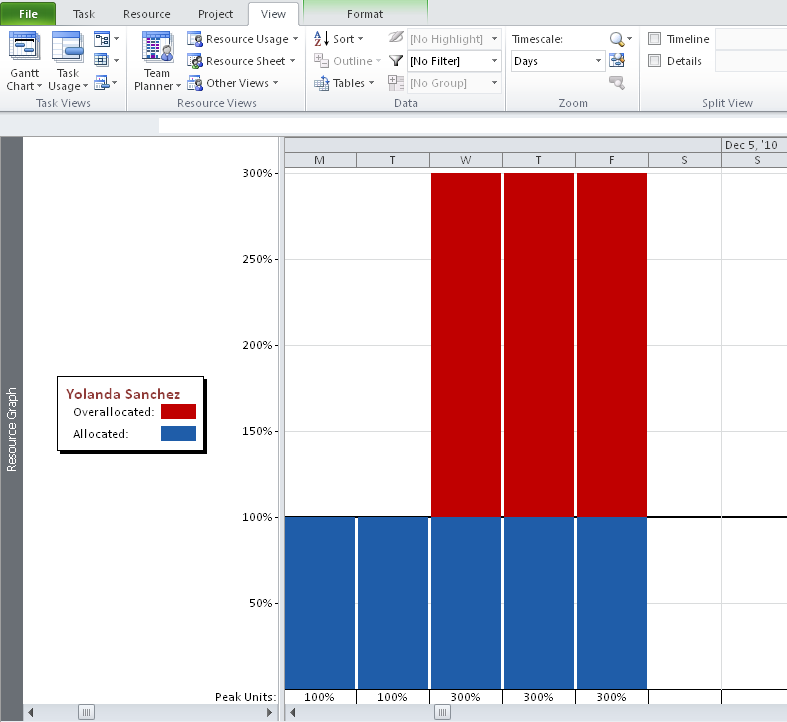
When used in combination with other views, the Resource Graph can be very useful for finding resource overallocations.
To display the Resource Graph, on the View tab, in the Resource Views group, click Other Views, and then click Resource Graph.
The Resource Graph shows peak units by resource, including the percentage of allocation and overallocation. You can change the type of information being shown in the Resource Graph by doing the following:
Display the Resource Graph.
On the Resource Graph Tools Format tab, in the Data group, click the arrow in the Graph box.
The drop-down menu lists the various categories of information that the Resource Graph can chart, such as Cost, Percent Allocation, and Work.
Click the category of information you want to chart on the Resource Graph.
Note
For more information about using the Resource Graph, see Viewing Resource Workloads. For information about customizing the Resource Graph, see Modifying the Resource Graph.
Sheet views are spreadsheet-type views that are divided into columns and rows and in which each individual field is contained in a cell. An example is shown in Figure 4-12.
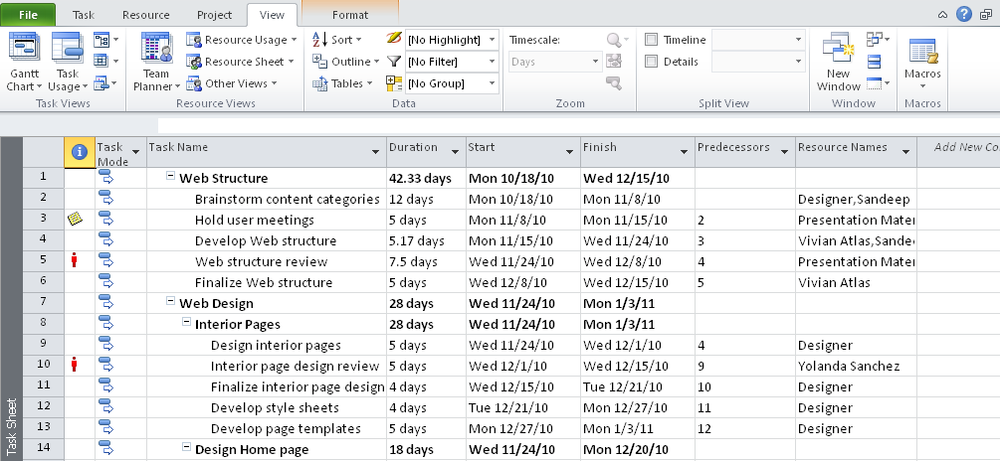
Figure 4-12. Use the Task Sheet to enter tasks and durations and to review calculated start and finish dates.
To display the Task Sheet, on the View tab, in the Task Views group, click Other Views, and then click Task Sheet.
To display the Resource Sheet, on the View tab, in the Resource Views group, click Resource Sheet.
You can also quickly switch to the Resource Sheet by clicking its icon in the view shortcuts area on the status bar, next to the Zoom slider.
The Project 2010 sheet views are described in Table 4-3.
Table 4-3. Project 2010 Sheet Views
Sheet view | How you can use it | For more information |
|---|---|---|
Resource Sheet (resource view) | Enter, edit, and review resource information in a spreadsheet format. | |
Task Sheet (task view) | Enter, edit, and review task information in a spreadsheet format. |
Note
For information about modifying the content or format of a sheet view, see Modifying a Sheet View.
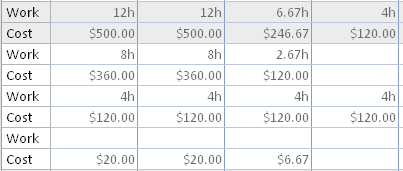
Usage views are made up of a sheet view on the left side and a timesheet on the right. Together with the timescale, the timesheet can show work, cost, availability, and other data broken out by time—that is, timephased. (See Figure 4-13.)
To display the Task Usage view, on the View tab, in the Task Views group, click Task Usage.
You can also quickly switch to the Task Usage view by clicking its icon in the view shortcuts area on the status bar.
To display the Resource Usage view, on the View tab, in the Resource Views group, click Resource Usage.
The Project 2010 usage views are described in Table 4-4.
Table 4-4. Project 2010 Usage Views
Usage view | How you can use it | For more information |
|---|---|---|
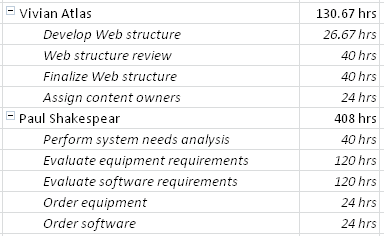
Resource Usage (assignment view) | Review, enter, and edit assignments by resource. In the sheet area of the Resource Usage view, each resource is listed with all associated task assignments indented beneath it. (See Figure 4-14.) In the timesheet area of the view, information such as work or costs for the resource and the assignment is listed according to the timescale—for example, by week or month. | |
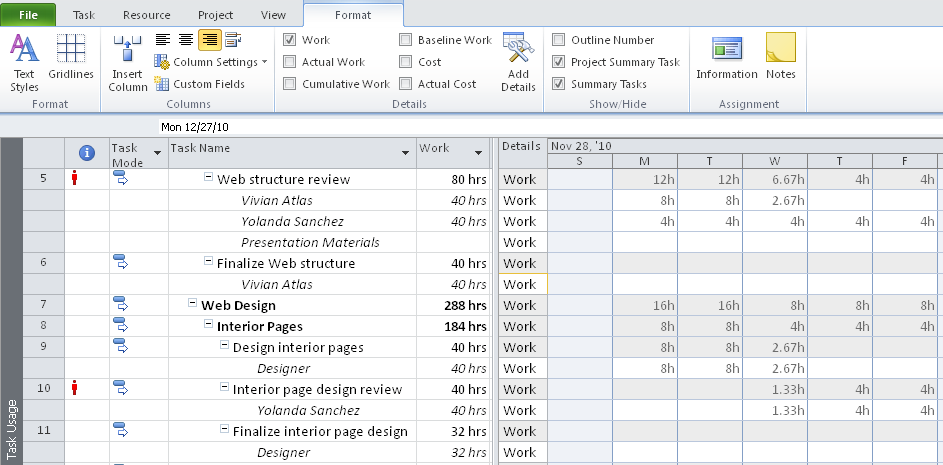
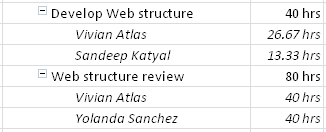
Task Usage (assignment view) | Review, enter, and edit assignments by task. In the sheet area of the Task Usage view, each task is listed with the assigned resources indented beneath it. (See Figure 4-15.) In the timesheet area of the view, information such as work or costs for the task and the assignment is listed according to the timescale—for example, by day or by week. |
Because the timesheet area of the usage views breaks down information from certain fields and from specific time periods, there are three subcategories to the major field categories of tasks, resources, and assignments:
Task-timephased
Resource-timephased
Assignment-timephased
You can review task-timephased and assignment-timephased fields in the timesheet area of the Task Usage view. You can review resource-timephased and assignment-timephased fields in the timesheet area of the Resource Usage view.
Note
Timephased information is used in many earned value analysis calculations. For more information about earned value, see Chapter 14.
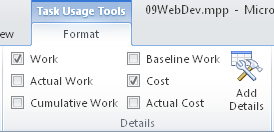
The Work field is shown by default in the timephased fields in the timesheet area of a usage view. Multiple fields of information can be stacked in the view at one time. To change the type of information shown, do the following:
Display one of the usage views.
On the Format tab, in the Details group, select the check box for the timephased details you want to show in the timesheet area of the usage view.
This group shows the various timephased fields that the timesheet area of the current usage view can display—for example, Actual Work, Baseline Work, and Cost. Any fields currently displayed are noted with a check mark.
When you select a check box, another row of timephased information is added to the timesheet for each task.
To remove a row of information from the timesheet, on the Format tab, in the Details group, clear the check box of the field you want to remove.
Note
For information about modifying the format of a usage view, see Modifying a Usage View.
Forms are specialized views that include text boxes and grids in which you can enter and review information as you do in a dialog box. (See Figure 4-16.) Although you can display a form on its own and click the Previous and Next buttons to cycle through the different tasks or resources in your project, a form is most useful when it’s included as part of a combination view. (See Cross-Referencing with Combination Views in the next section.)
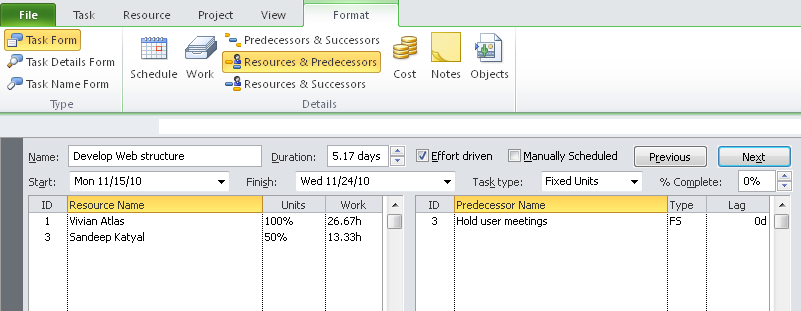
Figure 4-16. This Task Form shows fundamental information about the task, along with information about assigned resources and predecessor tasks.
To display a task form, on the View tab, in the Task Views group, click Other Views, and then click More Views. Click the name of the form in the dialog box, and then click Apply.
To display a resource form, on the View tab, in the Resource Views group, click Other Views, and then click More Views. Click the name of the form in the dialog box, and then click Apply.
Remember, after you apply any form, it appears on the Other Views drop-down menu so you don’t have to drill all the way into the More Views dialog box every time you need it.
The Project 2010 forms are described in Table 4-5.
Table 4-5. Project 2010 Forms
Form | How you can use it | For more information |
|---|---|---|
Resource Form (resource view) | Enter, edit, and review all resource, task, and schedule information about a selected resource, one resource at a time. The grid area can show information about the resource’s schedule, cost, or work on assigned tasks. It is most useful when used as part of a combination view. (See Figure 4-17.) | |
Resource Name Form (resource view) | Enter, edit, and review the selected resource’s schedule, cost, or work on assigned tasks. The Resource Name Form is a simplified version of the Resource Form. | |
Task Details Form (task view) | Enter, edit, and review detailed tracking and scheduling information about a selected task, one task at a time. The grid area can show information about assigned resources, predecessors, and successors. | |
Task Form (task view) | Enter, edit, and review information about a selected task, one task at a time. The grid area can show information about the task’s assigned resources, predecessors, and successors. | |
Task Name Form (task view) | Enter, edit, and review the selected task’s assigned resources, predecessors, and successors. The Task Name Form is a simplified version of the Task Form. |
You can change the categories of information shown in a form view. To do this, follow these steps:
Show the form whose categories of information you want to change.
On the Format tab, in the Details group, review the different types of information that can be shown in the form. The item currently shown in the form is highlighted in yellow.
Click the information you want to display in the form. You can choose only one item from the shortcut menu at a time.
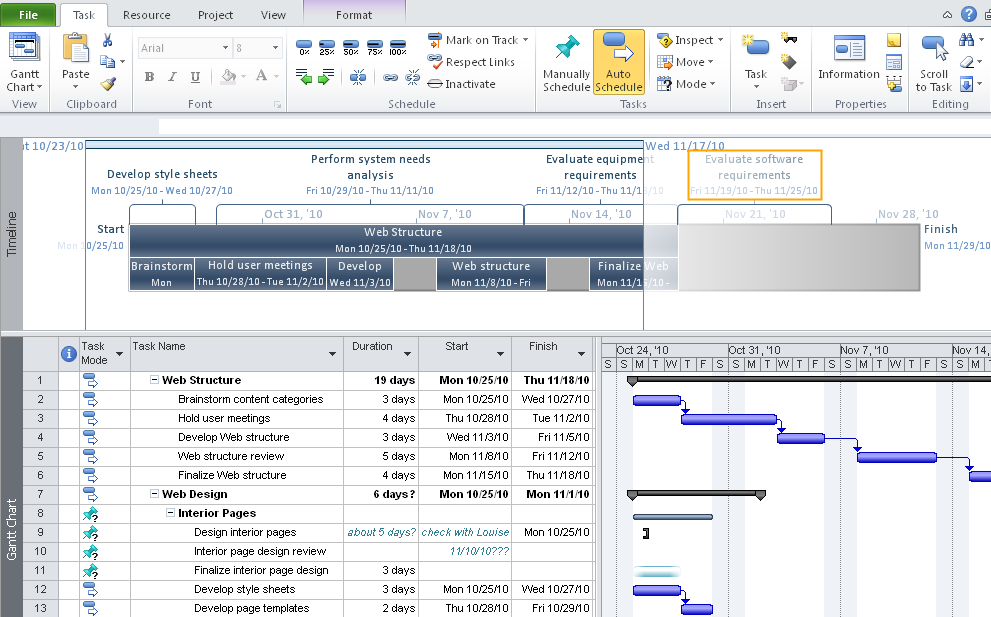
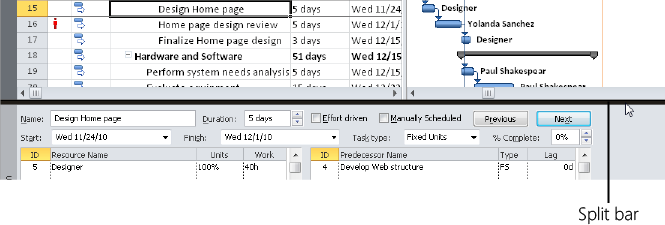
Combination views are groupings of two views in a split screen. The information in one portion of the split screen controls the content in the other portion, as shown in Figure 4-17.
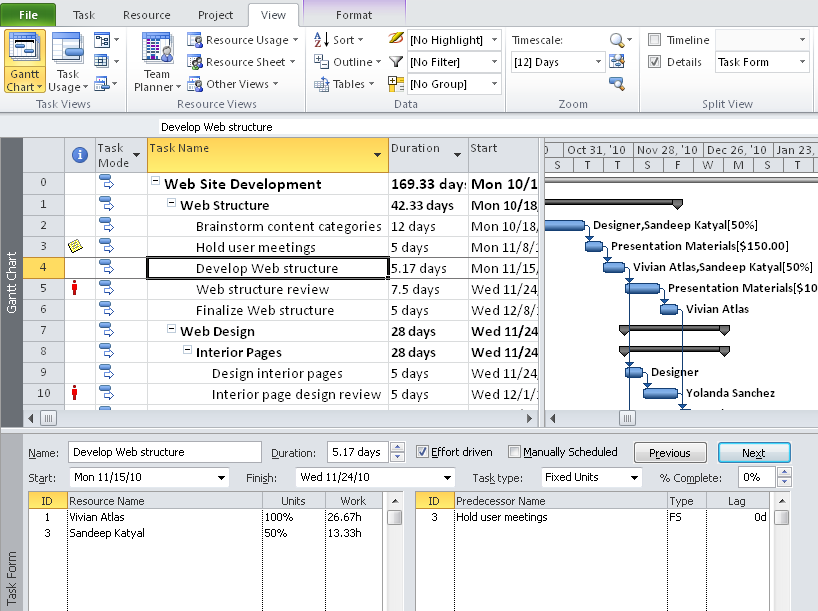
Figure 4-17. When you click a task in the Gantt Chart portion of the Task Entry view (at the top), the task, assignment, and predecessor information for that selected task appear in the Task Form portion of the view (at the bottom).
To apply the Task Entry combination view, on the View menu, in the Task Views group, click Other Views, and then click More Views. Click Task Entry, and then click Apply.
To apply the Resource Allocation combination view, on the View menu, in the Resource Views group, click Other Views, and then click More Views. Click Resource Allocation, and then click Apply.
The predefined Project 2010 combination views are described in Table 4-6.
Table 4-6. Project 2010 Combination Views
How you can use it | For more information | |
|---|---|---|
Resource Allocation (resource view) | Review and resolve resource overallocations. The Resource Usage view appears in the upper portion of the view, and the Leveling Gantt appears in the lower portion. The information shown in the Leveling Gantt corresponds with the resource or assignment selected in the Resource Usage view. | |
Task Entry (task view) | Enter, edit, and review detailed information about the task selected in the Gantt Chart. The Gantt Chart appears in the upper portion of the view, and the Task Form appears in the lower portion. The information shown in the Task Form corresponds with the task selected in the Gantt Chart. |
You can create your own combination view by simply splitting the view. For example, if you split the Gantt Chart view, the Task Form appears in the lower pane, instantly resulting in the Task Entry view. Likewise, if you split the Resource Sheet, the Resource Form appears in the lower pane.
The split bar is located in the lower-right corner of the Project 2010 window, just below the vertical scroll bar. To split a view, drag the split bar up to about the middle of the view or wherever you want the split to occur.
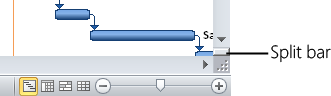
To remove the split and return to a single view, double-click the split bar, which is now the gray dividing bar between the two views. Or, on the View tab, in the Split View group, clear the Details check box.
To modify a combination view, simply modify one component of the combination view as if it were in its own view.
Note
For more information about combination views, see Customizing Views.
Troubleshooting: The current view doesn’t have a split bar
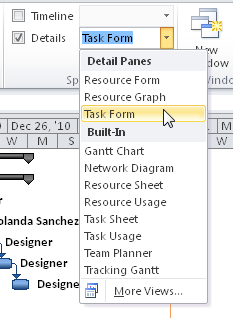
By their nature, graph views and forms do not have a split bar. However, you can still create a combination view with these views in the upper pane. On the View tab, in the Split View group, select the Details check box. If a task view is showing, the Task Form appears at the bottom of the split screen. If a resource view is showing, the Resource Form appears at the bottom.
You can change the form that appears. On the View tab, in the Split View group, click the arrow in the box next to the Details check box, and then select a different view under Detail Panes.
All sheet views, including the sheet area of any Gantt chart or usage view, have a table applied. Although every sheet view is associated with a default table, you can change the table in the sheet view to accommodate the kind of information you need to see.
Each table is made up of columns containing field information relevant to the job of the table and its view. You can rearrange the order of these columns, hide columns you don’t need, and add other columns you do need.
There is a default table defined for each sheet view in Project 2010. Table 4-7 lists all sheet views and their default tables.
Table 4-7. Sheet Views and their Default Tables
Sheet view | Default table | View | Default table |
|---|---|---|---|
Bar Rollup | Rollup Table | Resource Allocation | Usage (Resource Usage view) Delay (Leveling Gantt view) |
Detail Gantt | Delay | Resource Sheet | Entry |
Gantt Chart | Entry | Resource Usage | Usage |
Leveling Gantt | Delay | Task Entry | Entry |
Milestone Date Rollup | Entry | Task Sheet | Entry |
Milestone Rollup | Rollup Table | Task Usage | Usage |
Multiple Baselines Gantt | Entry | Tracking Gantt | Entry |
Although every sheet view has a default table, that table can easily be switched with another. There are 17 built-in tables for task sheets and 10 built-in tables for resource sheets.
Table 4-8 lists a description of the available task tables and the fields that make them up by default.
Table 4-8. Task Tables and Their Default Fields
Table 4-9 lists a description of all resource tables and their default fields.
Table 4-9. Resource Tables and Their Default Fields
Resource table | Default fields included | For more Information |
|---|---|---|
COST | ||
Cost information about resources in a project | ID, Resource Name, Cost, Baseline Cost, Cost Variance, Actual Cost, and Remaining Cost | |
EARNED VALUE | ||
Earned value information that compares the relationship between work and costs for resources based on a status date | ID, Resource Name, Planned Value – PV, Earned Value – EV, AC (ACWP), SV, CV, EAC, BAC, and VAC | |
ENTRY | ||
Essential information regarding resources; this table is most useful for entering and viewing fundamental resource information | ID, Indicators, Resource Name, Type, Material Label, Initials, Group, Maximum Units, Standard Rate, Overtime Rate, Cost/Use, Accrue At, Base Calendar, and Code | |
ENTRY – MATERIAL RESOURCES | ||
Essential information about consumable material resources | ID, Resource Name, Type, Material Label, Initials, Group, Standard Rate, Cost/Use, Accrue At, and Code | |
ENTRY – WORK RESOURCES | ||
Essential information about work (people and equipment) resources | ID, Resource Name, Type, Initials, Group, Maximum Units, Standard Rate, Overtime Rate, Cost/Use, Accrue At, Base Calendar, and Code | |
EXPORT | ||
A large set of fields from which to export resource fields to other applications, such as Excel or Access | ID, Unique ID, Resource Name, Initials, Maximum Units, Standard Rate, Overtime Rate, Cost Per Use, Accrue At, Cost, Baseline Cost, Actual Cost, Work, Baseline Work, Actual Work, Overtime Work, Group, Code, Text1–5, and Email Address | |
HYPERLINK | ||
Hyperlink information to associate linked web pages or file shortcuts with your resources | ID, Indicators, Resource Name, Hyperlink, Address, and SubAddress | |
SUMMARY | ||
Overview of resource information | ID, Resource Name, Group, Maximum Units, Peak, Standard Rate, Overtime Rate, Cost, and Work | |
USAGE | ||
The most essential resource scheduling information | ID, Indicators, Resource Name, and Work | |
WORK | ||
A variety of measurements for analyzing work (level of effort) for resources and their assigned tasks | ID, Resource Name, % Complete, Work, Overtime, Baseline, Variance, Actual, and Remaining |
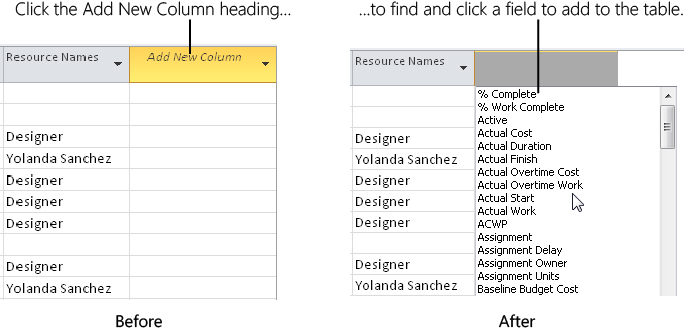
In addition to the default fields, every table has a last column called Add New Column. You can click the Add New Column heading and see all available task or resource fields. Click a field to add it to the table. The selected field is added to the table, and a new Add New Column column appears.
To switch to a different table, follow these steps:
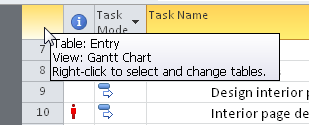
Display the view containing the table you want to change. This view could be the Task Sheet, Resource Sheet, Gantt Chart, Task Usage view, and so on.
On the View tab, in the Data group, click Tables.
If the current view is a task sheet, only task tables are listed. Likewise, if the current view is a resource sheet, only resource tables are listed. You cannot apply a resource table to a task view, and vice versa.
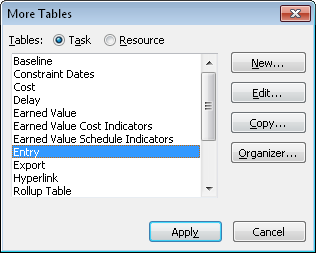
Because there are only 10 resource tables, all of them are listed in the drop-down menu. However, only nine of the most commonly used task tables are listed. The others are available in the More Tables dialog box.
If the table is listed on the submenu, click it. If the table is not listed on the submenu, click More Tables (see Figure 4-18), and then double-click the table you want.
The table is replaced by the table you select.
Suppose that the Entry task table provides all the information you need except baseline values. You can easily add another column to any table, and you can just as easily remove superfluous columns. You can also make certain changes to the columns themselves.
Note
When working with columns in a table, you’re working with fields in your project database. Fields are discussed in more detail in Using Fields.
To add a column to the right edge of a table, follow these steps:
Apply the table to which you want to add a new column.
If necessary, scroll to the far right edge of the table until you see the column labeled Add New Column.
Click the Add New Column heading.
All relevant task or resource fields are listed in the drop-down menu in alphabetical order, as shown in Figure 4-19.
Scroll down as necessary to find the field you want.
To move quickly to a field, type the first one or two characters of its name.
Click a field to add it to the table.
The selected field is added to the table, and a new Add New Column column appears to the right.
To add a column to a specific place in a table, follow these steps:
Display the view and table to which you want to add a column.
Click the column heading that will be to the right of the new column.
On the Format tab, in the Columns group, click Insert Column.
A new column is created to the left of the selected column and the fields drop-down menu appears.
Find the field you want, either by scrolling or by typing the first one or two characters of its name.
Click a field to add it to the table.
The selected field is added to the new column.
To replace an existing column with a different field, follow these steps:
Display the view and table to which you want to add a new field.
Double-click the column heading you want to replace.
The fields drop-down menu appears.
Click the field you want to use as a replacement.
To remove a column from a table, follow these steps:
Display the view and table from which you want to remove a column.
Right-click the heading of the column you want to remove, and then click Hide Column.
The column is removed. The field and its contents still exist in the database, however, and can be displayed again in this or other tables.
Note
Here’s another way to remove a column. Select the column heading, and then click Format, Columns, Column Settings, Hide Column. You can also simply select the column heading and press the Delete key.
You can change the title of the column to something other than the actual field name. You can also modify the column text alignment and the column width. To modify a column, follow these steps:
Display the view and table whose column settings you want to change.
Click the heading of the column you want to change.
On the Format tab, in the Columns group, click Column Settings, and then click Field Settings.
You can also right-click anywhere in the column you want to change and then click Field Settings on the shortcut menu.
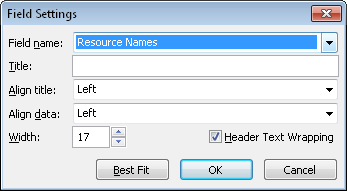
The Field Settings dialog box appears, as shown in Figure 4-20.
To change the field information appearing in the column, in the Field Name list, click the field you want.
To change the title of the column heading, type a new title in the Title box.
This changes the title of this column only in this table. It does not permanently change the field name itself.
Use the Align Title list to change the alignment of the column title.
Use the Align Data list to change the alignment of the field information itself.
Enter a number in the Width box to change the column width.
If you prefer, you can click the Best Fit button to adjust the column width to its widest entry.
By default, the column heading title wraps onto two or more lines as necessary. If you want the title to stay all on one line, clear the Header Text Wrapping check box.
Click OK.
Your changes are made to the field in the selected column.
Note
You can also change the column width directly on the table, exactly as you do in Excel. Click the column’s heading to select the column. Then move the mouse pointer to the right edge of the column until the pointer changes to a black crosshair. Drag to the right to widen the column; drag to the left to make the column narrower. Double-click the edge to widen the column to the same size as the longest entry in the column.
You can move a column to another location in the table simply by dragging. To move a column, follow these steps:
Display the view and table containing the column you want to move.
Click the heading of the column you want to move.
With the black crosshair mouse pointer over the column heading, drag to the new location for the column. As you drag, a gray line moves with the mouse pointer to indicate where the column will be inserted when you release the mouse button.
Note
In addition to adding and removing columns in existing tables, you can also create entirely new tables. For more information, see Customizing Tables.
Tables are made up of columns, and columns contain field information. The previous section describes how to add, remove, and manipulate columns in a table. This section provides more detail about the fields used throughout Project 2010.
Fields are the smallest piece of data in the vast collection of information that makes up your project database. For example, one task comprises a single record in this database. This record consists of a number of task fields, such as the task name, duration, start date, finish date, assigned resource, deadline, and more.
Whether you see them in a view or not, there are numerous fields for your tasks, resources, and assignments, as well as for the project as a whole.
Some fields are entered by you, such as task name and duration. Other fields are calculated for you by Project 2010, such as start date, finish date, and total cost. Still other fields can be entered by you or calculated by Project 2010.
From the discussion of views, tables, and the fields in those tables earlier in this chapter, you should already be familiar with the different field categories:
Task fields
Task-timephased fields
Resource fields
Resource-timephased fields
Assignment fields
Assignment-timephased fields
The timephased fields break down field information—such as work, costs, and availability—by time periods. This breakdown gives you more information to work with in your project. In the Task Usage and Resource Usage views, for example, you can see task cost by day or resource work by week. You can break either of those down further into the component assignments. The timephased fields also give you more tools for analysis through earned-value calculations.
Note
For more information about earned value analysis, see Chapter 14.
Another way that fields are categorized is by data type. The data type indicates how a field can be used—for example, as a currency-type field, or a text-type field. The following are the field data types:
Cost or Currency. Information is expressed as a cost.
Date. Information is expressed as a date.
Duration. Information is expressed as a span of time.
Enumerated. Information is selected from a list of predefined choices.
Indicator. Information is shown as graphical indicators, or icons, about a task, resource, or assignment.
Integer. Information is expressed as a whole number.
Outline code. Information is defined with a custom tag for tasks or resources that enables you to show a hierarchy of tasks in your project.
Percentage/Number. Information is displayed as a value that can be expressed as either a percentage or decimal number, such as 100 percent or 1.00.
Text. Information is expressed as unrestricted characters of text.
Yes/No. Information is set to either Yes or No, that is, a True/False or Boolean value.
Fields make up your project database, the whole of which you might never see, or even have a need to see. You do see various fields throughout your project plan, in the following locations:
Columns in a table
Rows in a timesheet
Bars in the Timeline
Resources and tasks in the Team Planner
Information in a network diagram node
Gantt bars and associated text in a Gantt chart
Fields in a form view
Fields in a dialog box
Some of these locations, such as columns in a table and rows in a timesheet, can be changed to suit your needs. Others, such as the fields in a dialog box, are fixed.
In addition to adding built-in fields wherever you might need them, you can also create your own custom fields and add them to tables in your views. There are custom fields you can define for currency, dates, durations, finish dates, start dates, text, numbers, outline codes, and more. Project Professional 2010 includes an additional set of enterprise custom fields as well, so an organization can design a robust set of fields that standardizes project management data collection and display across the enterprise.
Note
For more information about defining custom fields, see Customizing Fields. For information about working with enterprise custom fields, see Working with Custom Enterprise Fields.
Learn More About Project 2010 Fields
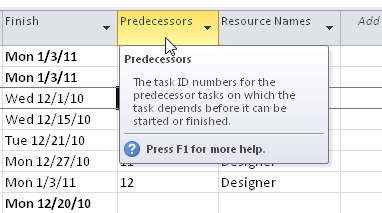
You can immediately get comprehensive information about any field in a table. Position your mouse pointer over the column heading, and a ScreenTip pops up that provides a brief description of the field. Press F1, and the Help topic for the selected field appears in a separate Help window.
You can also get Help about fields by following these steps:
In the upper-right corner of the Project window, click the Help icon.
You can also press F1 or, on the File tab, click Help, and then click Microsoft Office Help.
Under Browse Project 2010 Support, click See All.
In the Categories list, click Reference.
On the Reference page, click Available Fields Reference.
Click one of the field categories—for example, Task Fields or Assignment Fields. A complete list of fields in that category appears, along with a short description of each.
Click a field name, and its Help topic appears. (See Figure 4-21.)
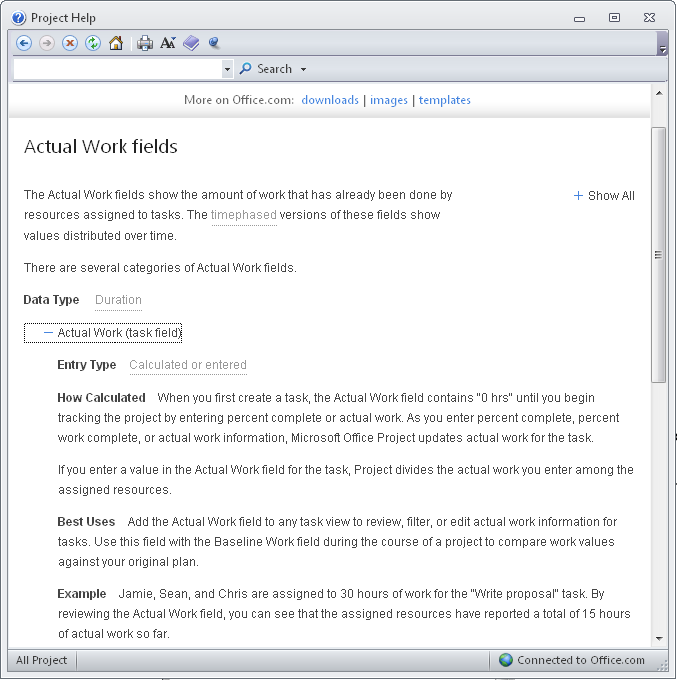
These online Help topics about the fields contain the following information:
Data Type (duration, cost, text, and so on)
Entry Type (entered, calculated, or both)
Description (a general overview of the field’s function)
How Calculated (for calculated fields)
Best Uses (the purpose of the field)
Example (how this field might be used to facilitate a project plan)
Remarks (any additional information)