The planned costs for your project become reliable figures that you can use for a budget request or a project proposal when the following information is entered in your project plan:
All required work and material resources, even if they’re just generic resources
Cost rates and per-use costs for all work and material resources
Cost resources assigned to tasks with their individual amounts
All tasks, complete with reliable duration estimates
Assignments for all tasks
Any fixed costs for tasks
After this information has been entered, you can review planned costs by various categories, from granular details to a high-level summary: costs for individual assignments, individual tasks or phases, individual resources, and, of course, the entire project.
Review assignment costs by applying the Cost table to the Task Usage or Resource Usage view, as follows:
On the View tab, in the Task Views group, click Task Usage. Or, on the View tab, in the Resource Views group, click Resource Usage.
You can also click the Task Usage icon in the view shortcuts at the lower-right corner of the Project status bar, next to the Zoom slider.
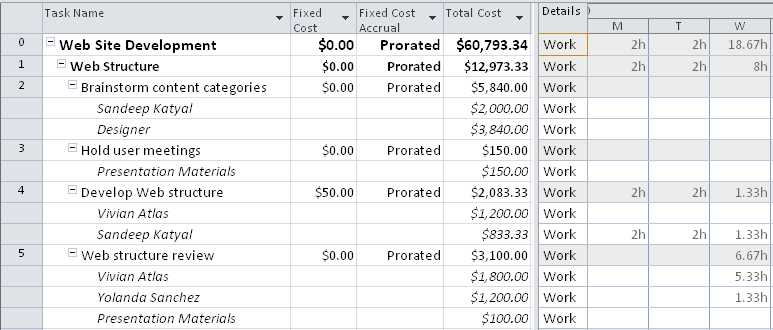
On the View tab, in the Data group, click Tables, and then click Cost. The Cost table is applied to the view, as shown in Figure 9-11.
In the Task Usage view, you can see individual assignment costs, as well as the total cost for each task. In the Resource Usage view, you can see individual assignment costs with the total cost for each resource.
You can review timephased costs by adding the cost details row to the timesheet area of the Task Usage or Resource Usage view, as follows:
Display either the Task Usage or Resource Usage view.
On the Format tab, in the Details group, click Cost.
Note
You can also add a row of details by right-clicking in the timesheet area of a usage view and then clicking the name of the detail category—for example, Cost or Actual Work—you want to see.
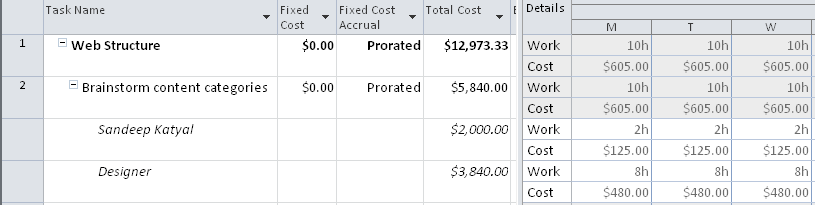
The Cost field is added to the Work field in the timesheet area of the view, as shown in Figure 9-12.
Figure 9-12. Review assignment costs over time by adding the Cost field to the Task Usage or Resource Usage timesheet area of the view.
You can adjust the time period detail shown in the timesheet. On the View tab, in the Zoom group, click Zoom, and then click Zoom In or Zoom Out. You can also use the Zoom slider on the status bar. Click the plus button to zoom in, or click the minus button to zoom out.
You can review resource costs to see how much each resource is costing to carry out assigned tasks. To get total costs for a resource’s assignments, add the Cost field to the Resource Sheet, as follows:
Display the Resource Sheet.
Click the column heading next to where you want to insert the Cost field.
On the Format tab, in the Columns group, click Insert Column.
A new column appears showing a temporary drop-down menu of all available resource fields.
Type cos to quickly go to the Cost fields in the list. Click Cost to apply the field to the column. Clicking the field also dismisses the drop-down menu.
The Cost field shows the total planned costs for all assignments for each individual resource.
Note
Reviewing resource costs is a great way to see how much you’re spending on different cost categories as represented by your cost resources. Suppose you have assigned the “Airfare” cost resource to three different tasks. For one task the airfare costs $300, for the second task it costs $700, and for the third task it costs $500. If you add the Cost field to the Resource Sheet, you see that the total cost for airfare in your project is $1,000.
In the Resource Sheet with the Cost field added, you can sort, filter, or highlight resources by cost information, as follows:
Sort resources by cost. On the View tab, in the Data group, click Sort, and then click By Cost.
To return the Resource Sheet to its original order, on the View tab, in the Data group, click Sort, and then click By ID.
Filter resources by cost. On the View tab, in the Data group, click the arrow in the Filter box, and then click More Filters. Click Cost Greater Than, and then click Apply. Enter an amount, and then click OK.
To see all resources again, on the View tab, in the Data group, click the arrow in the Filter box, and then click No Filter.
Highlight resources by costs. On the View tab, in the Data group, click the arrow in the Highlight box, and then click More Highlight Filters. Click Cost Greater Than, and then click Highlight. Enter an amount, and then click OK.
To remove the highlights, on the View tab, in the Data group, click the arrow in the Highlight box, and then click No Highlight.
Note
For more information about sorting, filtering, and grouping information, see Rearranging Your Project Information.
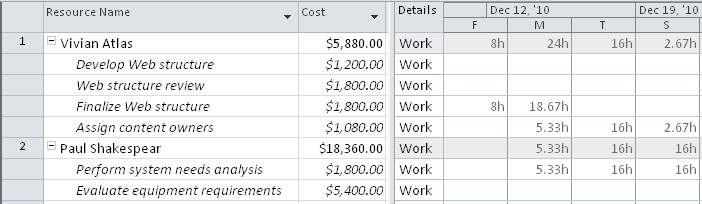
If you want to see the total resource costs along with the assignments that contribute to that total, use the Resource Usage view with the Cost table applied. The Cost field next to the resource name shows the total cost for the resource, while the assignments listed under each resource name show the component cost for that assignment or the amount that the resource costs for that particular task, as you can see in Figure 9-13.
You can review the planned task costs to see how much money is required to execute each task. Planned task costs represent the sum for all resources assigned to a task, in addition to any fixed costs for tasks. To view total costs for tasks, do the following:
Display the Gantt Chart or other task sheet.
On the View tab, in the Data group, click Tables, and then click Cost.
Review the Total Cost field to see the cost for each task.
You can run one of two built-in reports that show planned costs: the Budget report and the Cash Flow report. To generate the Budget report, do the following:
On the Project tab, in the Reports group, click Reports.
Double-click Costs.
Double-click Budget.
A preview of the Budget report appears next to print and page setup options on the Print Backstage view, as shown in Figure 9-14.
To view the report, click the report with the magnifying glass mouse pointer. You can also use the various report viewing controls in the lower-right corner of the screen.
To print the report, click the Print button. To close the report, click any of the tabs on the ribbon.
To generate the Cash Flow report, do the following:
On the Project tab, in the Reports group, click Reports.
Double-click Costs.
Double-click Cash Flow.
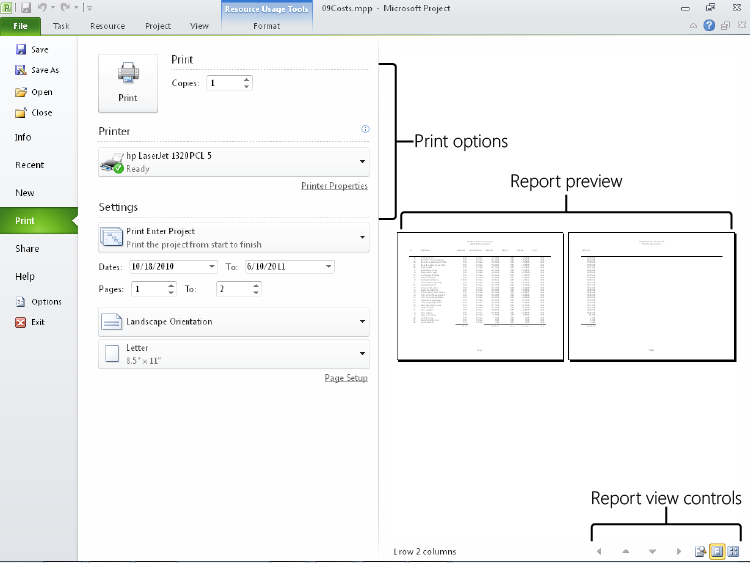
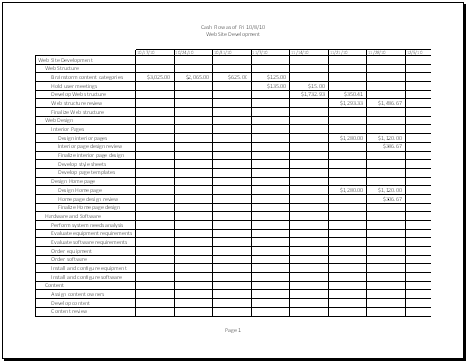
A preview of the Cost Flow report appears next to print and page setup options. (See Figure 9-15.)
To view the report, click the report with the magnifying glass mouse pointer or use the report viewing controls in the lower-right corner of the screen.
To print the report, click the Print button. To close the report, click any of the tabs on the ribbon.
Note
For more information about reports, see Generating Text and Visual Reports.
In the Gantt Chart or other task sheet with cost information showing, you can sort, filter, or highlight tasks by cost, as follows:
Sort tasks by costs. On the View tab, in the Data group, click Sort, and then click By Cost.
To return the task list to its original sort order, on the View tab, in the Data group, click Sort, and then click By ID.
Filter tasks by costs. On the View tab, in the Data group, click the arrow in the Filter box, and then click More Filters. Click Cost Greater Than, and then click Apply. Enter an amount, and then click OK.
To see all tasks again, on the View tab, in the Data group, click the arrow in the Filter box, and then click No Filter.
Highlight tasks by costs. On the View tab, in the Data group, click the arrow in the Highlight box, and then click More Highlight Filters. Click Cost Greater Than, and then click Highlight. Enter an amount, and then click OK.
To remove the highlights, on the View tab, in the Data group, click the arrow in the Highlight box, and then click No Highlight.
Note
For more information about sorting and filtering information, see Rearranging Your Project Information.
You can see the total planned cost for the entire project. This cost is the sum of all task costs, as well as any fixed costs you might have entered for the project. To see the total cost for the project, apply the Cost table to the Gantt Chart or other task sheet and show the Project Summary Task, as follows:
Display the Gantt Chart or other task sheet.
On the View tab, in the Data group, click Tables, and then click Cost.
The Cost table is applied.
On the Format tab, in the Show/Hide group, select the Project Summary Task check box.
The project summary task row appears at the top of the view. The total project cost is displayed in the Total Cost field.
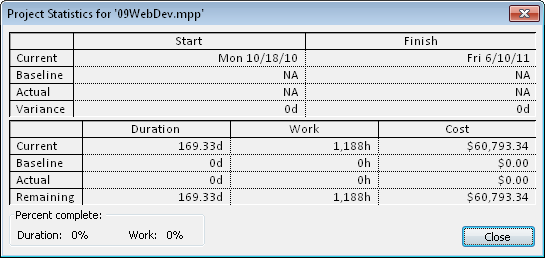
You can also see the total project cost in the Project Statistics dialog box. To display the Project Statistics dialog box, follow these steps:
On the Project tab, in the Properties group, click Project Information.
Click the Statistics button. The Project Statistics dialog box appears, as shown in Figure 9-16.