A budget-constrained project is one in which costs are the most important factor in the project plan. Although you still need to balance schedule requirements and satisfy the project scope, in such a project the costs are at the forefront of your decision-making processes as you plan and execute the project.
If your project plan calculates that your total costs are above the allowed budget, you need cost-cutting strategies. Your best approach will involve cutting resources because in projects, resources and costs are often synonymous. As described in the previous section, when you want to bring in the finish date, you focus on tasks in the critical path. In the same way, when you want to cut costs, it’s best to focus on resources to gain the biggest cost savings.
Review your cost picture first, compare it with your budget, and then make any necessary adjustments.
To review total project costs using project statistics, do the following:
On the Project tab, in the Properties group, click Project Information.
In the Project Information dialog box, click the Statistics button.
The Project Statistics dialog box appears. The current, or scheduled, total project cost appears in the Cost column.
You can review costs for tasks and summary tasks when you apply the Cost table to a task sheet. If you add the project summary task to a sheet view with the Cost table applied, you can see the total project cost as well. To apply and analyze costs in the Cost table, follow these steps:
Display the Gantt Chart or other task sheet.
On the View tab, in the Data group, click Tables, and then click Cost.
The Cost table is applied.
If the project summary task is not already showing, on the Format tab, in the Show/Hide group, select the Project Summary Task check box.
The project summary task row appears at the top of the task sheet. The total project cost, as currently scheduled, is displayed in the Total Cost field.
Review the Total Cost field for summary tasks. This is the rolled-up total of all assigned resource costs and fixed costs for the subtasks.
Review the Total Cost field for individual tasks. This is the sum of all assigned resource costs as well as fixed costs for tasks.
If you are using the budget resource type with the Budget Work and Budget Cost fields, you can group and review predetermined budget values against your planned project costs.
Note
For information about how to create and assign budget resources, enter budget values, and align resources with their corresponding budget resources, see Setting Up and Reviewing a Project Budget.
To group and compare resource costs against budget values, follow these steps:
On the View tab, in the Resource Views group, click Resource Usage.
Add the Budget Work, Budget Cost, Work, and Cost fields to the table. To do this, click in the Add New Column heading. Type the first two letters of the field you want to enter, and then click the name.
A new Add New Column column appears after new columns are defined and inserted.
On the View tab, in the Data group, click the arrow in the Group By box, and then click New Group By.
In the Group By field under Field Name, select the name of the text field that you’re using to categorize your resources. Depending on how you set up your budget categories, this could be a custom text field, the Code field, or the Group field.
Click Apply.
The resources in your project are grouped by the budget categories you assigned. Each grouping includes one budget resource. The figures for the budget resource appear in the Budget Cost and Budget Work fields. The figures for all other resources appear in the Cost and Work fields. The total costs for the resources are rolled up in the grouping bar. Compare the rolled-up values against the values for the budget resources to see how the costs in your project are faring against the budget for that category.
To ungroup the Resource Usage view, on the View tab, in the Data group, click the arrow in the Group By box, and then click No Group.
Five cost reports can help you analyze planned project costs, as follows:
Budget report. On the Project tab, in the Reports group, click Reports. Double-click Costs, and then double-click Budget. The Total Cost column is a summary of the resource costs and fixed costs for each task.
Cash Flow report. On the Project tab, in the Reports group, click Reports. Double-click Costs, and then double-click Cash Flow. This report forecasts the funding needed for each period of time, enabling you to see whether budgeted costs will be exceeded at a particular point.
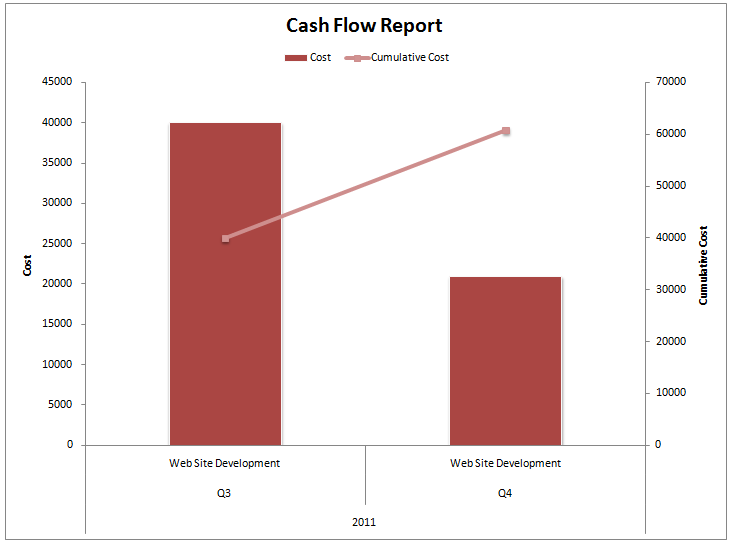
Cash Flow visual report in Excel. On the Project tab, in the Reports group, click Visual Reports. In the Task Usage tab, double-click Cash Flow Report. As shown in Figure 10-18, Microsoft Excel 2010 opens to show the project’s cash flow in a column chart.
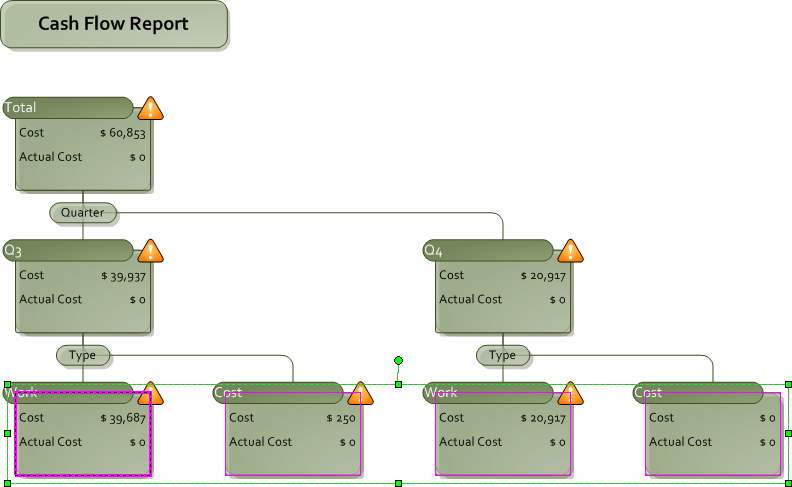
Cash Flow visual report in Visio. On the Project tab, in the Reports group, click Visual Reports. In the Resource Usage tab, double-click Cash Flow Report (Metric) or Cash Flow Report (US). Visio opens to show the project’s cash flow in a PivotDiagram, as shown in Figure 10-19.
You can sort a sheet view by costs. To review task or resource costs in order of amount, do the following:
Display a task sheet or resource sheet, depending on whether you want to see costs by resource or by task.
On the View tab, in the Data group, click Tables, and then click Cost.
On the View tab, in the Data group, click Sort, and then click By Cost.
The sheet view is sorted by the Total Cost field. To return to the original sort order, click View, Data, Sort, By ID.
You can filter a sheet view to display only tasks or resources that have costs exceeding a specified amount. To do this, follow these steps:
Display a task sheet or resource sheet, depending on whether you want to see costs by resource or by task.
On the View tab, in the Data group, click Tables, and then click Cost.
On the View tab, in the Data group, click the arrow in the Filter box, and then click More Filters.
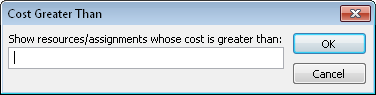
In the More Filters dialog box, click Cost Greater Than and then click Apply.
In the Cost Greater Than dialog box, enter the amount.
To see all tasks or all resources again, on the View tab, in the Data group, click the arrow in the Filter box, and then click No Filter.
If you find that your scheduled costs are higher than your budget, first review the individual costs themselves. Check the resource rates as well as fixed costs for tasks and ensure that they’re accurate.
To check resource rates, review the Resource Sheet with the Entry table applied. With the default fields in the Entry table, you can see each resource’s standard rate, overtime rate, and cost per use.
To check fixed costs for tasks, review a task sheet such as the Gantt Chart with the Cost table applied. The Fixed Cost field displays any costs associated with the tasks that are independent of resource costs.
If many of your resource costs are based on time periods such as an amount per hour or per day, you might be able to cut costs if you can reduce task durations. For example, suppose that you have a 2-day fixed-units task assigned to a $100/hour resource. By default, this resource is assigned to 16 hours of work, for a cost of $1,600. If you reduce the duration to 1 day, the work is reduced to 8 hours, and the cost is reduced to $800.
When you reduce task duration in a fixed-units or fixed-duration task, the amount of work is also reduced. However, if you reduce duration for a fixed-work task, work stays the same and assignment units increase. In this case, resource costs would not be reduced.
Note
For more information, see Controlling Schedule Changes with Task Types and Checking and Adjusting Durations.
Another way to reduce work and therefore cut costs is to reduce work directly. In effect, you’re cutting the amount of time that resources are spending on assigned tasks.
The manner in which a work reduction affects your task and resource scheduling depends on the individual task types. When you decrease work in a fixed-units or fixed-work task, duration is reduced. When you decrease work in a fixed-duration task, units are decreased.
To change work amounts for individual resources, display the Task Usage view or Resource Usage view. Then edit the Work field for the assignment.
You might be using cost resources in your project; that is, those cost items that contribute to the completion of a task but—unlike work or material resources—do not affect the schedule when assigned to that task. Examples of cost resources include airfare, lodging, and rentals.
To review the amounts planned for cost resources, switch to the Resource Usage view. Apply the Cost table: click View, Data, Tables, Cost. If you only want to see cost resources in the table, on the View tab, in the Data group, click the arrow in the Filter box, and then click Resources—Cost.
In this way, you can review the costs for each cost resource. If you need to make any adjustments, you can change the Cost field for the assignment under the cost resource.
Note
You can also adjust scope to cut costs. For more information about cutting scope, see Changing Project Scope.